
|
|||||
|
 | |
| |
| |
| |
| |
| |
|
Gene: HIGD2A |
Gene summary for HIGD2A |
| Gene information | Species | Human | Gene symbol | HIGD2A | Gene ID | 192286 |
| Gene name | HIG1 hypoxia inducible domain family member 2A | |
| Gene Alias | RCF1b | |
| Cytomap | 5q35.2 | |
| Gene Type | protein-coding | GO ID | GO:0006915 | UniProtAcc | A0A024R7Q3 |
Top |
Malignant transformation analysis |
| Identification of the aberrant gene expression in precancerous and cancerous lesions by comparing the gene expression of stem-like cells in diseased tissues with normal stem cells |
| Entrez ID | Symbol | Replicates | Species | Organ | Tissue | Adj P-value | Log2FC | Malignancy |
| 192286 | HIGD2A | CA_HPV_1 | Human | Cervix | CC | 1.47e-04 | -1.69e-01 | 0.0264 |
| 192286 | HIGD2A | CA_HPV_3 | Human | Cervix | CC | 6.47e-04 | 2.31e-02 | 0.0414 |
| 192286 | HIGD2A | N_HPV_2 | Human | Cervix | N_HPV | 1.57e-02 | 5.36e-02 | -0.0131 |
| 192286 | HIGD2A | CCI_1 | Human | Cervix | CC | 5.18e-18 | -8.25e-01 | 0.528 |
| 192286 | HIGD2A | CCI_2 | Human | Cervix | CC | 1.10e-16 | -8.25e-01 | 0.5249 |
| 192286 | HIGD2A | CCI_3 | Human | Cervix | CC | 2.57e-23 | -8.25e-01 | 0.516 |
| 192286 | HIGD2A | CCII_1 | Human | Cervix | CC | 2.36e-31 | -8.25e-01 | 0.3249 |
| 192286 | HIGD2A | Tumor | Human | Cervix | CC | 6.90e-10 | -4.66e-01 | 0.1241 |
| 192286 | HIGD2A | sample3 | Human | Cervix | CC | 3.33e-13 | -4.87e-01 | 0.1387 |
| 192286 | HIGD2A | H2 | Human | Cervix | HSIL_HPV | 1.03e-05 | -3.59e-01 | 0.0632 |
| 192286 | HIGD2A | L1 | Human | Cervix | CC | 3.45e-16 | -6.07e-01 | 0.0802 |
| 192286 | HIGD2A | T1 | Human | Cervix | CC | 1.79e-02 | -2.68e-01 | 0.0918 |
| 192286 | HIGD2A | T3 | Human | Cervix | CC | 4.26e-17 | -4.81e-01 | 0.1389 |
| 192286 | HIGD2A | HTA11_3410_2000001011 | Human | Colorectum | AD | 3.25e-46 | 7.37e-01 | 0.0155 |
| 192286 | HIGD2A | HTA11_2487_2000001011 | Human | Colorectum | SER | 1.97e-41 | 9.75e-01 | -0.1808 |
| 192286 | HIGD2A | HTA11_2951_2000001011 | Human | Colorectum | AD | 6.82e-15 | 8.17e-01 | 0.0216 |
| 192286 | HIGD2A | HTA11_1938_2000001011 | Human | Colorectum | AD | 3.44e-34 | 9.11e-01 | -0.0811 |
| 192286 | HIGD2A | HTA11_78_2000001011 | Human | Colorectum | AD | 4.79e-18 | 3.72e-01 | -0.1088 |
| 192286 | HIGD2A | HTA11_347_2000001011 | Human | Colorectum | AD | 5.01e-54 | 9.72e-01 | -0.1954 |
| 192286 | HIGD2A | HTA11_411_2000001011 | Human | Colorectum | SER | 2.54e-19 | 1.29e+00 | -0.2602 |
| Page: 1 2 3 4 5 6 7 8 9 10 11 12 13 |
| Tissue | Expression Dynamics | Abbreviation |
| Cervix |  | CC: Cervix cancer |
| HSIL_HPV: HPV-infected high-grade squamous intraepithelial lesions | ||
| N_HPV: HPV-infected normal cervix | ||
| Colorectum (GSE201348) |  | FAP: Familial adenomatous polyposis |
| CRC: Colorectal cancer | ||
| Colorectum (HTA11) |  | AD: Adenomas |
| SER: Sessile serrated lesions | ||
| MSI-H: Microsatellite-high colorectal cancer | ||
| MSS: Microsatellite stable colorectal cancer | ||
| Endometrium | 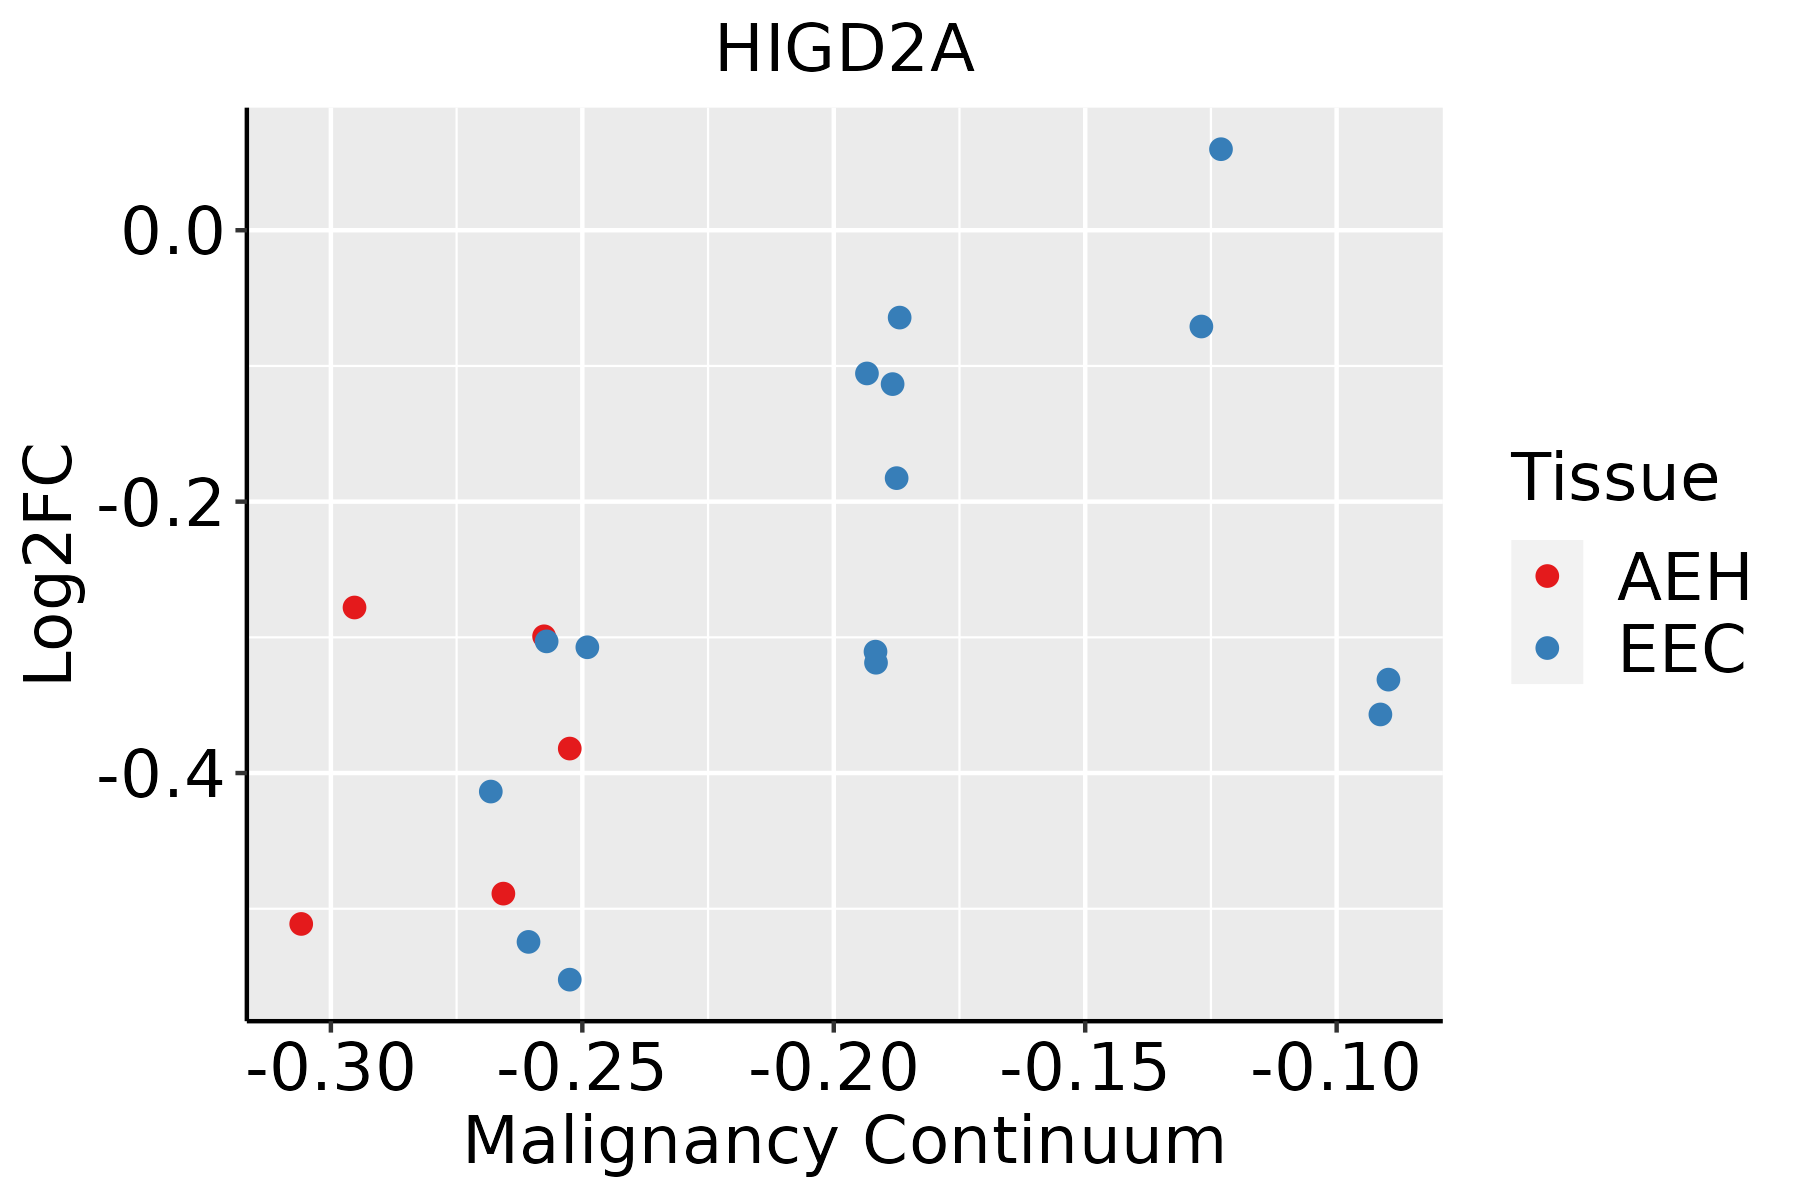 | AEH: Atypical endometrial hyperplasia |
| EEC: Endometrioid Cancer | ||
| Esophagus | 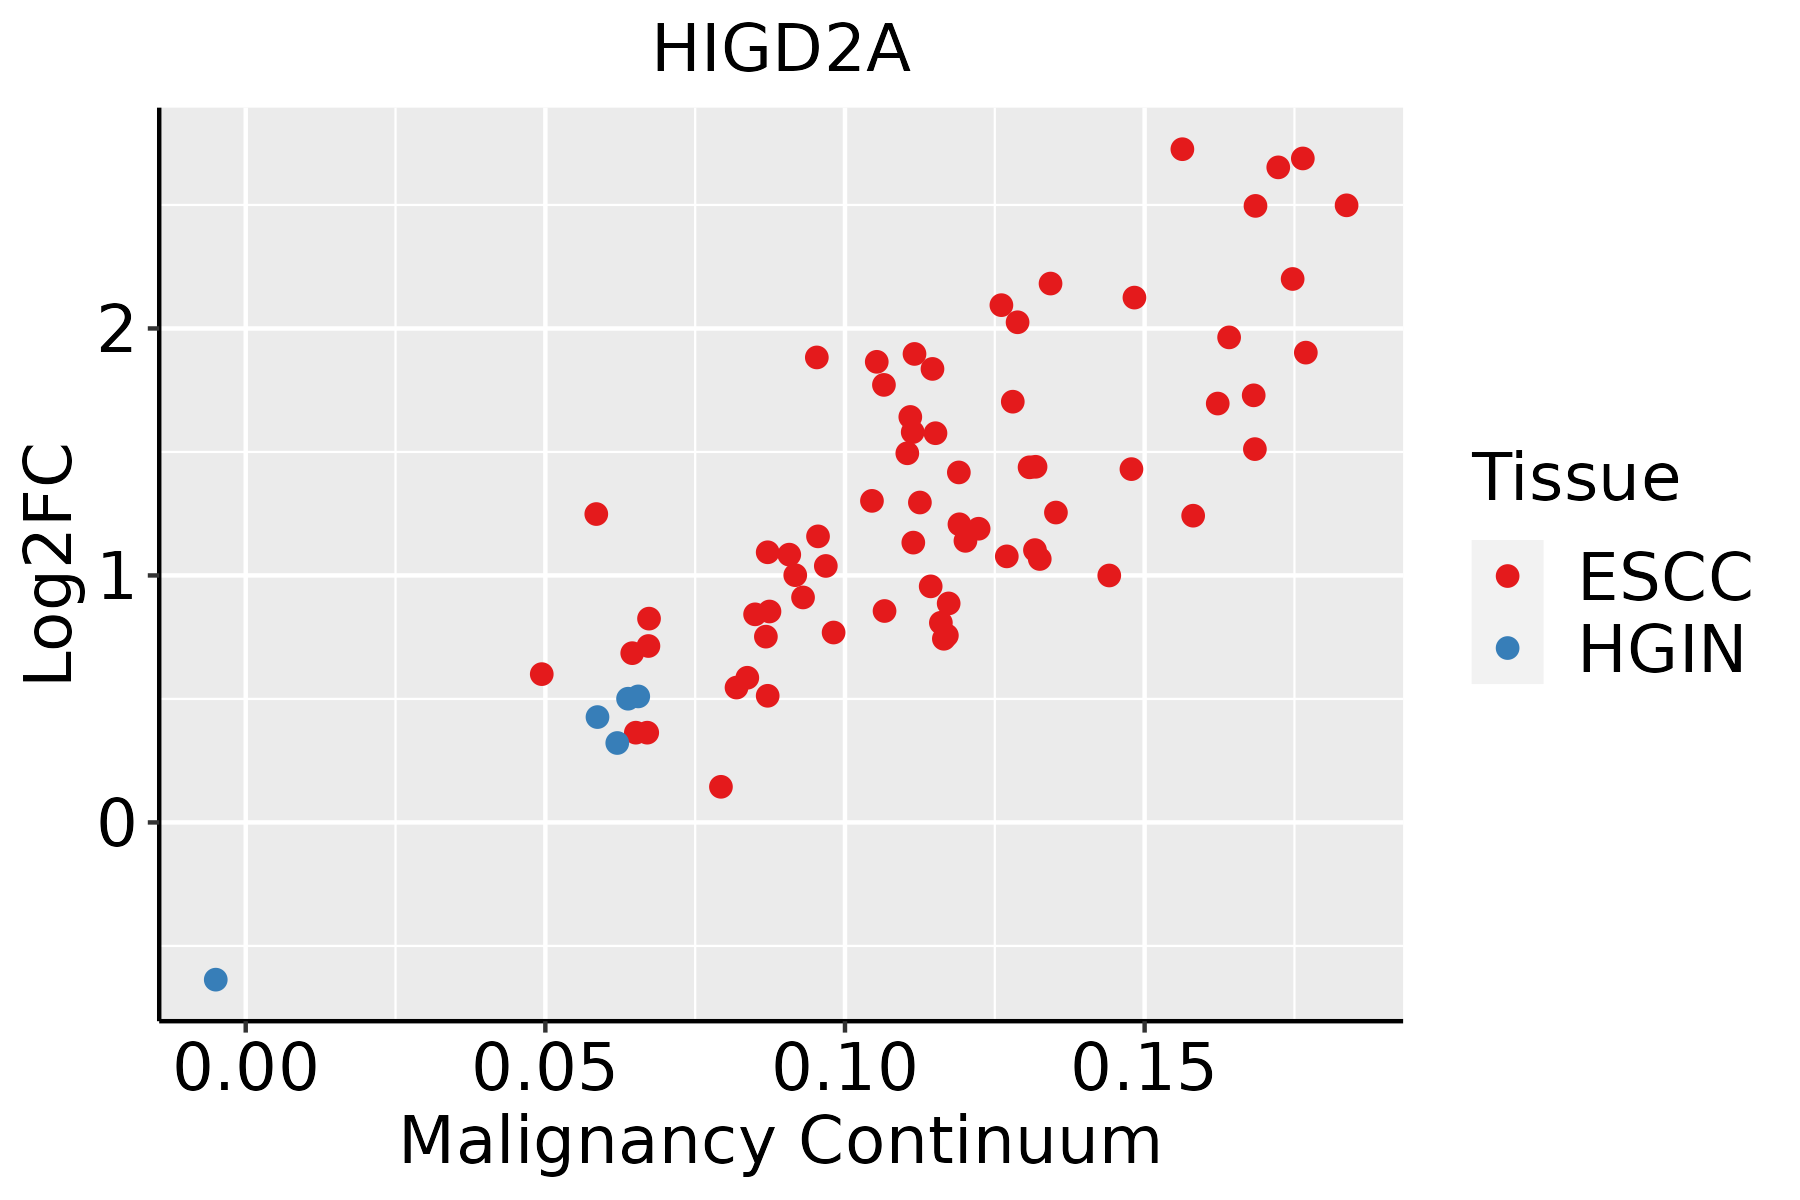 | ESCC: Esophageal squamous cell carcinoma |
| HGIN: High-grade intraepithelial neoplasias | ||
| LGIN: Low-grade intraepithelial neoplasias | ||
| GC | 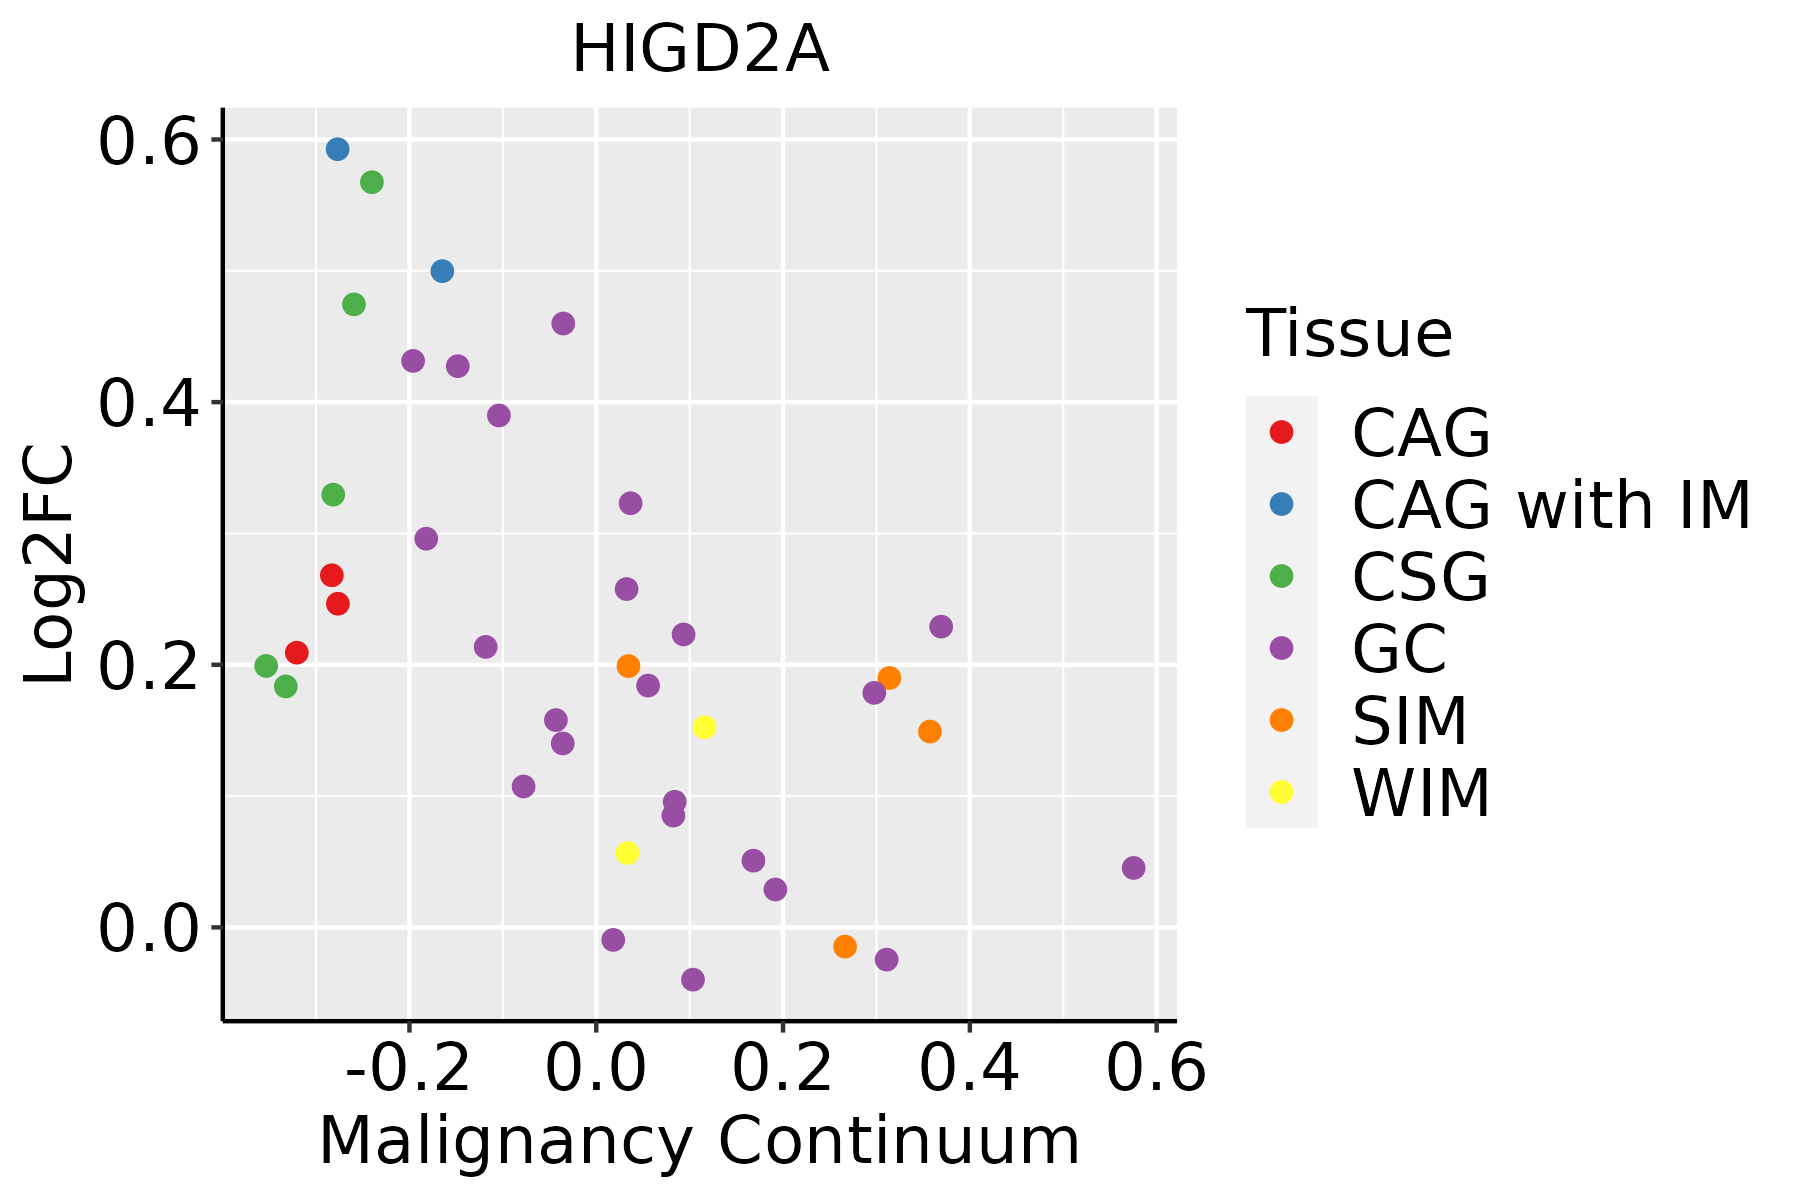 | CAG: Chronic atrophic gastritis |
| CAG with IM: Chronic atrophic gastritis with intestinal metaplasia | ||
| CSG: Chronic superficial gastritis | ||
| GC: Gastric cancer | ||
| SIM: Severe intestinal metaplasia | ||
| WIM: Wild intestinal metaplasia | ||
| Liver |  | HCC: Hepatocellular carcinoma |
| NAFLD: Non-alcoholic fatty liver disease | ||
| Oral Cavity |  | EOLP: Erosive Oral lichen planus |
| LP: leukoplakia | ||
| NEOLP: Non-erosive oral lichen planus | ||
| OSCC: Oral squamous cell carcinoma | ||
| Prostate | 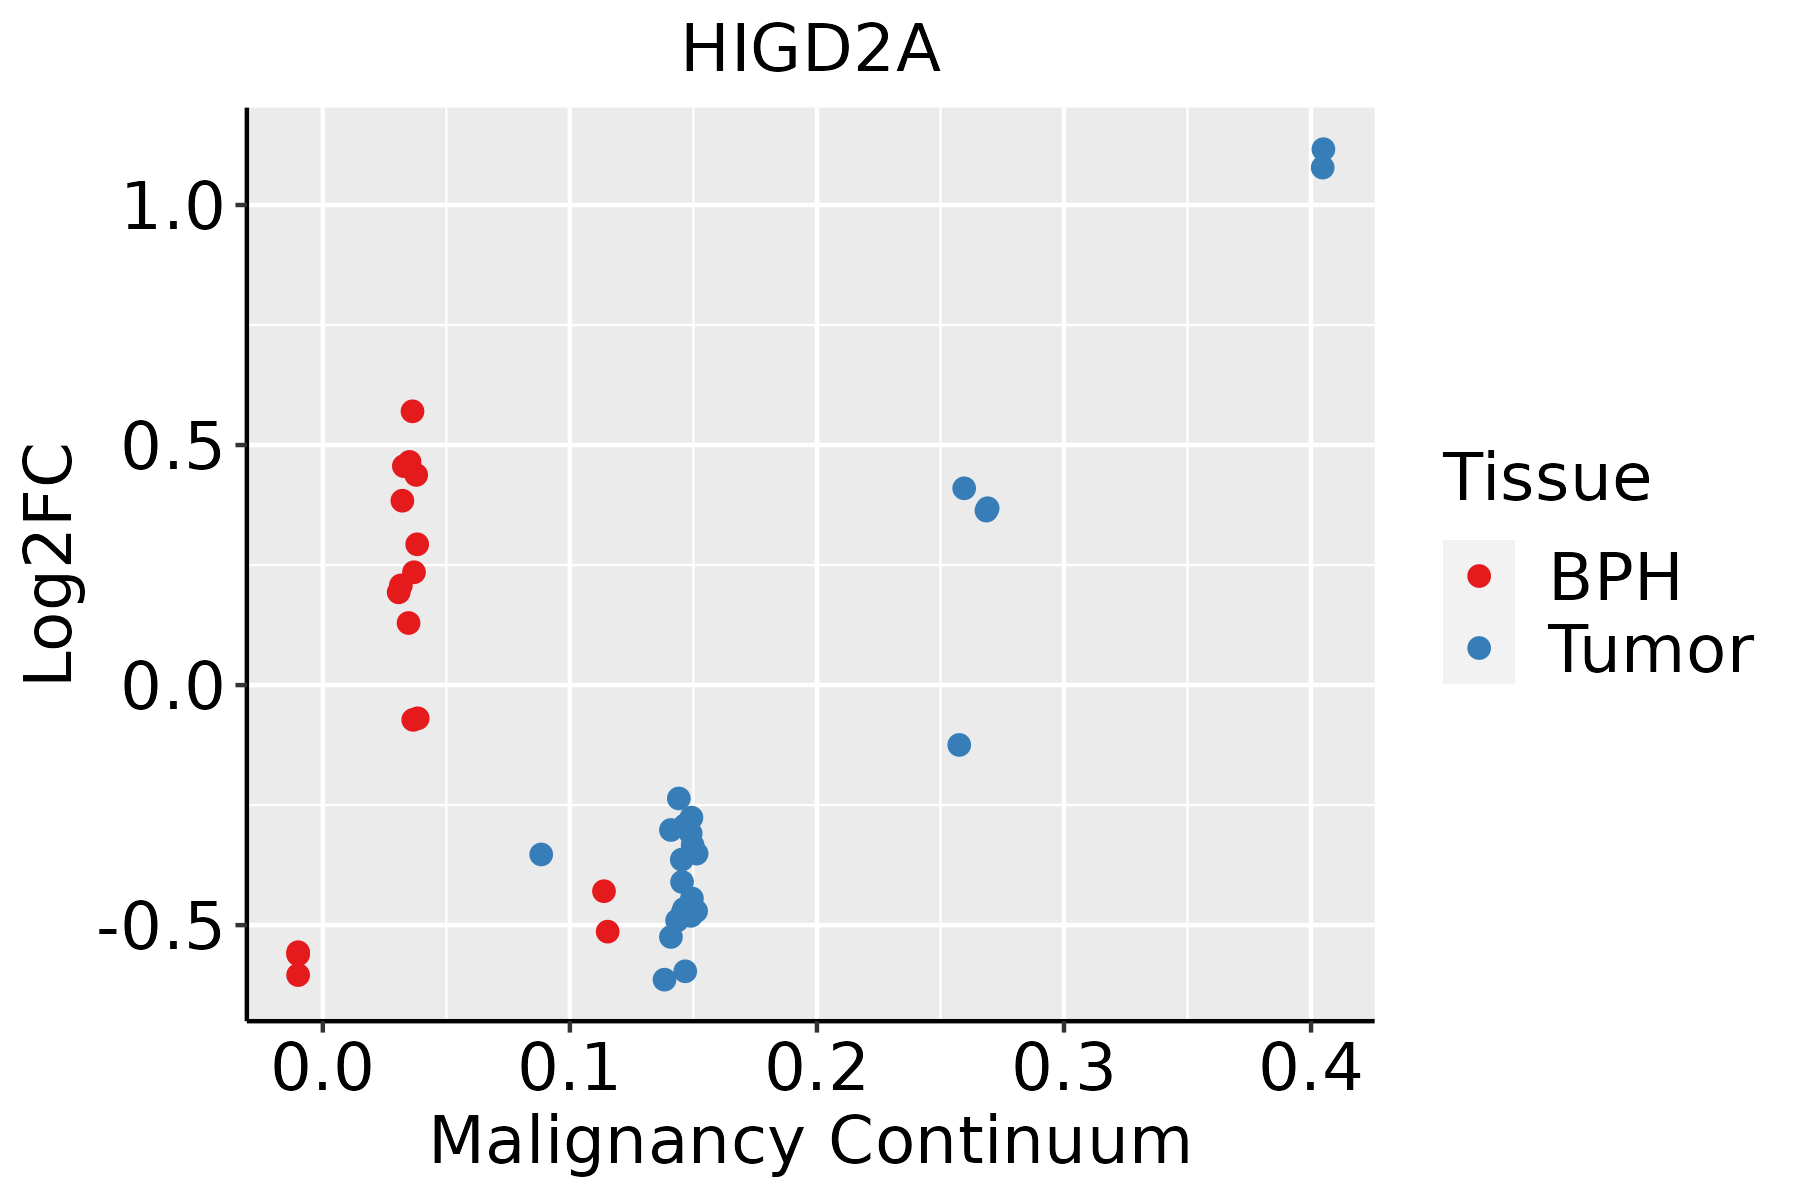 | BPH: Benign Prostatic Hyperplasia |
| Skin | 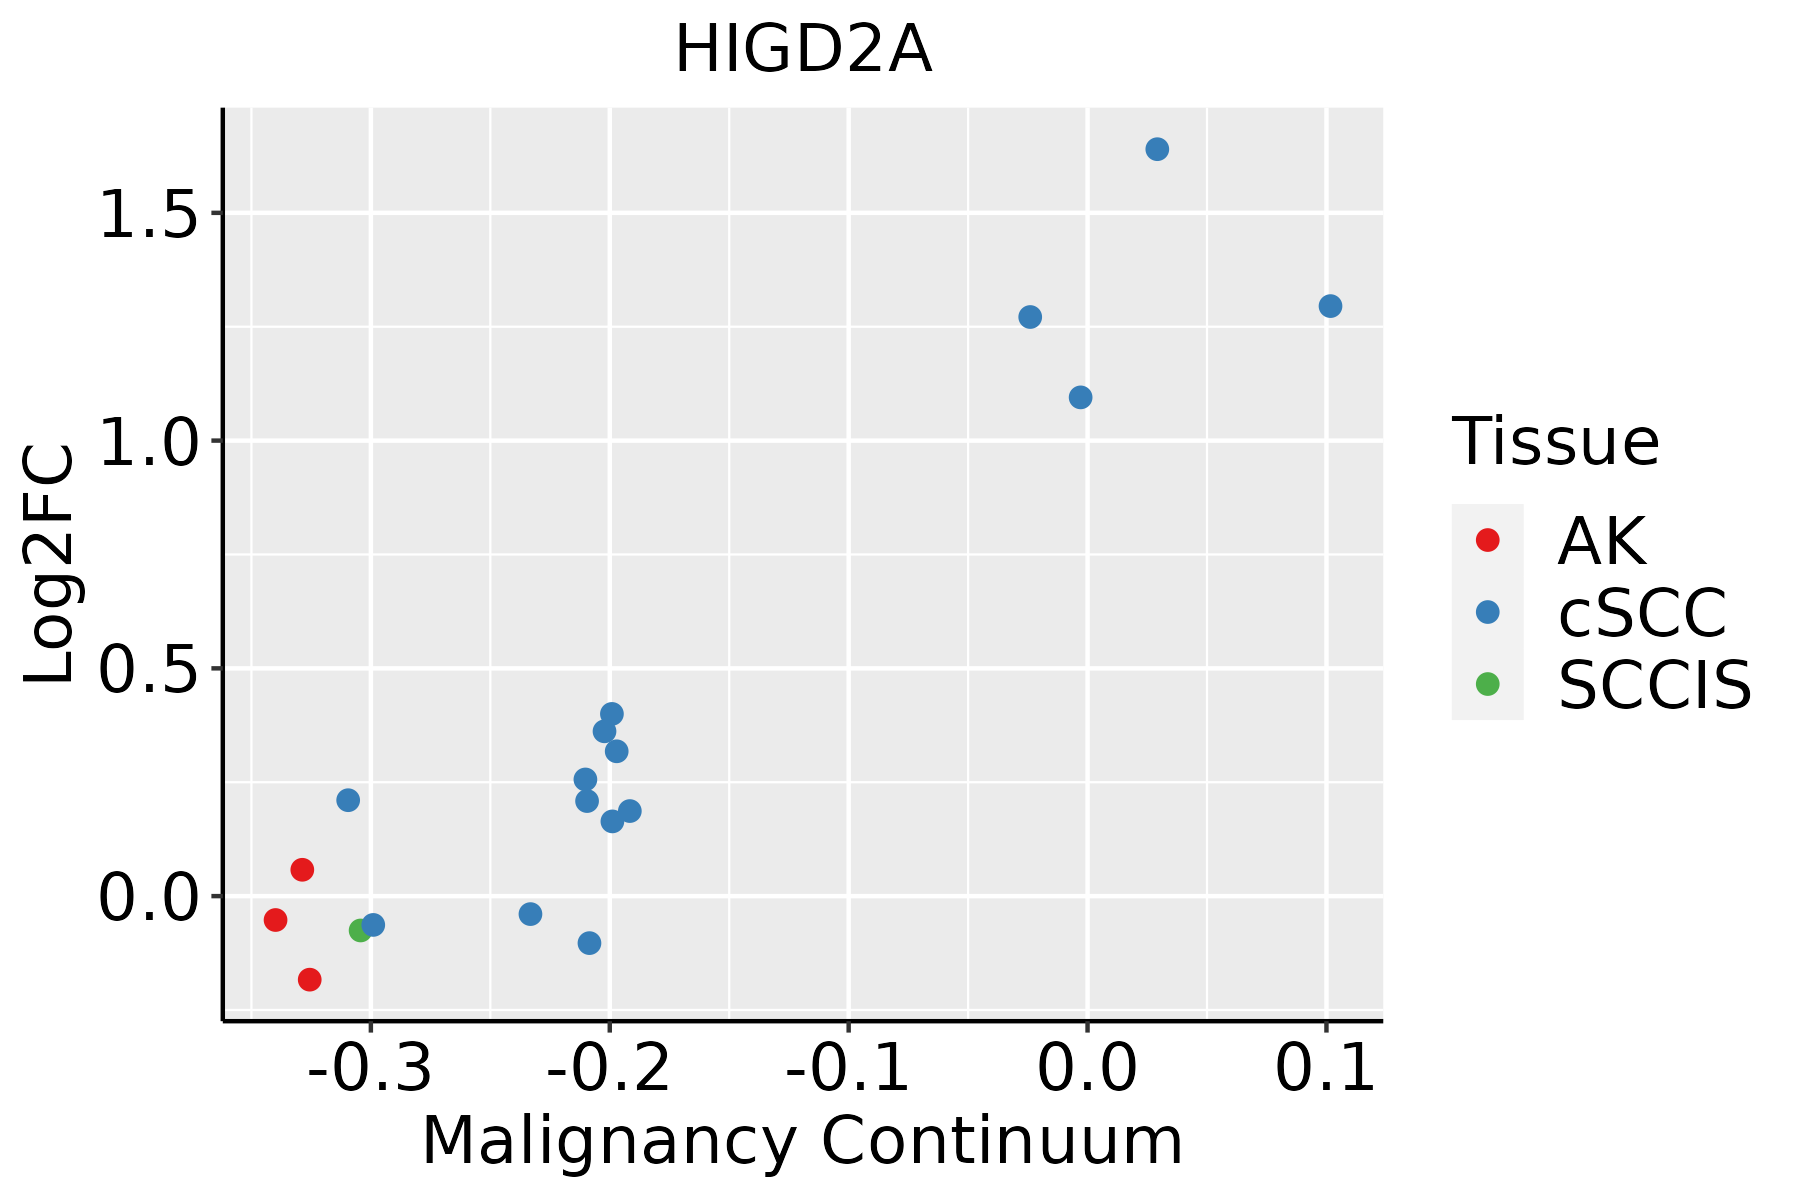 | AK: Actinic keratosis |
| cSCC: Cutaneous squamous cell carcinoma | ||
| SCCIS:squamous cell carcinoma in situ | ||
| Thyroid |  | ATC: Anaplastic thyroid cancer |
| HT: Hashimoto's thyroiditis | ||
| PTC: Papillary thyroid cancer |
| ∗log2FC in expression of this searched gene in stem-like cells from each diseased tissue sample relative to stem-like cells in normal samples in each tissue plotted against the malignancy continuum. Samples are colored based on if they are from different disease stage. |
Top |
Malignant transformation related pathway analysis |
| Find out the enriched GO biological processes and KEGG pathways involved in transition from healthy to precancer to cancer |
| Tissue | Disease Stage | Enriched GO biological Processes |
| Colorectum | AD |  |
| Colorectum | SER |  |
| Colorectum | MSS |  |
| Colorectum | MSI-H |  |
| Colorectum | FAP |  |
| ∗Top 15 enriched GO BP terms are showed in the bar plot of each disease state in each tissue. Each row represents a significant GO biological process which is colored according to the -log10(p.adjust). |
| Page: 1 2 3 4 5 6 7 8 9 |
| GO ID | Tissue | Disease Stage | Description | Gene Ratio | Bg Ratio | pvalue | p.adjust | Count |
| GO:0097250 | Stomach | GC | mitochondrial respirasome assembly | 4/1159 | 10/18723 | 2.27e-03 | 2.20e-02 | 4 |
| GO:00972501 | Stomach | CAG with IM | mitochondrial respirasome assembly | 4/1050 | 10/18723 | 1.57e-03 | 1.75e-02 | 4 |
| GO:00972502 | Stomach | CSG | mitochondrial respirasome assembly | 4/1034 | 10/18723 | 1.48e-03 | 1.68e-02 | 4 |
| GO:00972503 | Stomach | CAG | mitochondrial respirasome assembly | 3/552 | 10/18723 | 2.62e-03 | 2.71e-02 | 3 |
| GO:00972504 | Stomach | SIM | mitochondrial respirasome assembly | 3/708 | 10/18723 | 5.29e-03 | 4.41e-02 | 3 |
| Page: 1 |
| Pathway ID | Tissue | Disease Stage | Description | Gene Ratio | Bg Ratio | pvalue | p.adjust | qvalue | Count |
| Page: 1 |
Top |
Cell-cell communication analysis |
| Identification of potential cell-cell interactions between two cell types and their ligand-receptor pairs for different disease states |
| Ligand | Receptor | LRpair | Pathway | Tissue | Disease Stage |
| Page: 1 |
Top |
Single-cell gene regulatory network inference analysis |
| Find out the significant the regulons (TFs) and the target genes of each regulon across cell types for different disease states |
| TF | Cell Type | Tissue | Disease Stage | Target Gene | RSS | Regulon Activity |
| ∗The dot plots of a searched regulon are shown for all cell subpopulations in each disease state of each tissue based on the regulon specific score inferred using pySCENIC and by calculating the average expression. |
| Page: 1 |
Top |
Somatic mutation of malignant transformation related genes |
| Annotation of somatic variants for genes involved in malignant transformation |
| Hugo Symbol | Variant Class | Variant Classification | dbSNP RS | HGVSc | HGVSp | HGVSp Short | SWISSPROT | BIOTYPE | SIFT | PolyPhen | Tumor Sample Barcode | Tissue | Histology | Sex | Age | Stage | Therapy Types | Drugs | Outcome |
| HIGD2A | SNV | Missense_Mutation | novel | c.68G>C | p.Gly23Ala | p.G23A | Q9BW72 | protein_coding | deleterious(0) | probably_damaging(0.98) | TCGA-C5-A8YR-01 | Cervix | cervical & endocervical cancer | Female | <65 | I/II | Unknown | Unknown | PD |
| HIGD2A | SNV | Missense_Mutation | c.226N>G | p.Gln76Glu | p.Q76E | Q9BW72 | protein_coding | deleterious(0) | possibly_damaging(0.685) | TCGA-JW-A5VL-01 | Cervix | cervical & endocervical cancer | Female | <65 | I/II | Unknown | Unknown | SD | |
| HIGD2A | SNV | Missense_Mutation | c.262T>C | p.Phe88Leu | p.F88L | Q9BW72 | protein_coding | tolerated(0.1) | probably_damaging(0.975) | TCGA-AA-3977-01 | Colorectum | colon adenocarcinoma | Male | >=65 | I/II | Unknown | Unknown | SD | |
| HIGD2A | SNV | Missense_Mutation | c.247A>G | p.Ile83Val | p.I83V | Q9BW72 | protein_coding | tolerated(0.41) | possibly_damaging(0.497) | TCGA-D5-6535-01 | Colorectum | colon adenocarcinoma | Female | >=65 | III/IV | Unknown | Unknown | SD | |
| HIGD2A | SNV | Missense_Mutation | novel | c.209N>A | p.Gly70Asp | p.G70D | Q9BW72 | protein_coding | tolerated(0.05) | possibly_damaging(0.878) | TCGA-AJ-A23O-01 | Endometrium | uterine corpus endometrioid carcinoma | Female | >=65 | I/II | Unknown | Unknown | SD |
| HIGD2A | SNV | Missense_Mutation | c.103T>G | p.Phe35Val | p.F35V | Q9BW72 | protein_coding | tolerated(0.08) | benign(0.189) | TCGA-AP-A0LM-01 | Endometrium | uterine corpus endometrioid carcinoma | Female | <65 | III/IV | Chemotherapy | cisplatin | SD | |
| HIGD2A | SNV | Missense_Mutation | novel | c.105N>A | p.Phe35Leu | p.F35L | Q9BW72 | protein_coding | tolerated(0.1) | possibly_damaging(0.526) | TCGA-BS-A0UV-01 | Endometrium | uterine corpus endometrioid carcinoma | Female | <65 | III/IV | Unknown | Unknown | SD |
| Page: 1 |
Top |
Related drugs of malignant transformation related genes |
| Identification of chemicals and drugs interact with genes involved in malignant transfromation |
| (DGIdb 4.0) |
| Entrez ID | Symbol | Category | Interaction Types | Drug Claim Name | Drug Name | PMIDs |
| Page: 1 |

Copyright 2023-Present -The University of Texas Health Science Center at Houston |