
|
|||||
|
 | |
| |
| |
| |
| |
| |
|
Gene: HIGD1A |
Gene summary for HIGD1A |
| Gene information | Species | Human | Gene symbol | HIGD1A | Gene ID | 25994 |
| Gene name | HIG1 hypoxia inducible domain family member 1A | |
| Gene Alias | HIG1 | |
| Cytomap | 3p22.1 | |
| Gene Type | protein-coding | GO ID | GO:0006915 | UniProtAcc | Q9Y241 |
Top |
Malignant transformation analysis |
| Identification of the aberrant gene expression in precancerous and cancerous lesions by comparing the gene expression of stem-like cells in diseased tissues with normal stem cells |
| Entrez ID | Symbol | Replicates | Species | Organ | Tissue | Adj P-value | Log2FC | Malignancy |
| 25994 | HIGD1A | HTA11_2487_2000001011 | Human | Colorectum | SER | 1.14e-02 | 1.53e-01 | -0.1808 |
| 25994 | HIGD1A | HTA11_78_2000001011 | Human | Colorectum | AD | 5.51e-17 | 4.49e-01 | -0.1088 |
| 25994 | HIGD1A | HTA11_347_2000001011 | Human | Colorectum | AD | 1.69e-05 | 1.32e-01 | -0.1954 |
| 25994 | HIGD1A | HTA11_411_2000001011 | Human | Colorectum | SER | 1.20e-07 | 6.00e-01 | -0.2602 |
| 25994 | HIGD1A | HTA11_83_2000001011 | Human | Colorectum | SER | 1.79e-04 | 2.31e-01 | -0.1526 |
| 25994 | HIGD1A | HTA11_2992_2000001011 | Human | Colorectum | SER | 1.53e-17 | 8.16e-01 | -0.1706 |
| 25994 | HIGD1A | HTA11_5212_2000001011 | Human | Colorectum | AD | 2.50e-18 | 6.68e-01 | -0.2061 |
| 25994 | HIGD1A | HTA11_99999970781_79442 | Human | Colorectum | MSS | 2.05e-06 | 1.98e-01 | 0.294 |
| 25994 | HIGD1A | HTA11_99999965062_69753 | Human | Colorectum | MSI-H | 3.42e-04 | 4.33e-01 | 0.3487 |
| 25994 | HIGD1A | HTA11_99999965104_69814 | Human | Colorectum | MSS | 2.22e-02 | 1.46e-01 | 0.281 |
| 25994 | HIGD1A | HTA11_99999971662_82457 | Human | Colorectum | MSS | 9.56e-07 | 1.69e-01 | 0.3859 |
| 25994 | HIGD1A | LZE3D | Human | Esophagus | HGIN | 4.03e-02 | 3.29e-01 | 0.0668 |
| 25994 | HIGD1A | LZE4T | Human | Esophagus | ESCC | 4.29e-17 | 6.40e-01 | 0.0811 |
| 25994 | HIGD1A | LZE5T | Human | Esophagus | ESCC | 7.31e-03 | 8.44e-01 | 0.0514 |
| 25994 | HIGD1A | LZE7T | Human | Esophagus | ESCC | 6.08e-04 | 7.72e-01 | 0.0667 |
| 25994 | HIGD1A | LZE8T | Human | Esophagus | ESCC | 2.40e-04 | 1.85e-01 | 0.067 |
| 25994 | HIGD1A | LZE20T | Human | Esophagus | ESCC | 3.15e-03 | -6.94e-03 | 0.0662 |
| 25994 | HIGD1A | LZE24T | Human | Esophagus | ESCC | 1.45e-19 | 9.30e-01 | 0.0596 |
| 25994 | HIGD1A | LZE22D3 | Human | Esophagus | HGIN | 8.44e-03 | 2.36e-01 | 0.0653 |
| 25994 | HIGD1A | LZE6T | Human | Esophagus | ESCC | 1.69e-09 | 6.51e-01 | 0.0845 |
| Page: 1 2 3 4 5 6 7 |
| Tissue | Expression Dynamics | Abbreviation |
| Colorectum (GSE201348) |  | FAP: Familial adenomatous polyposis |
| CRC: Colorectal cancer | ||
| Colorectum (HTA11) |  | AD: Adenomas |
| SER: Sessile serrated lesions | ||
| MSI-H: Microsatellite-high colorectal cancer | ||
| MSS: Microsatellite stable colorectal cancer | ||
| Esophagus | 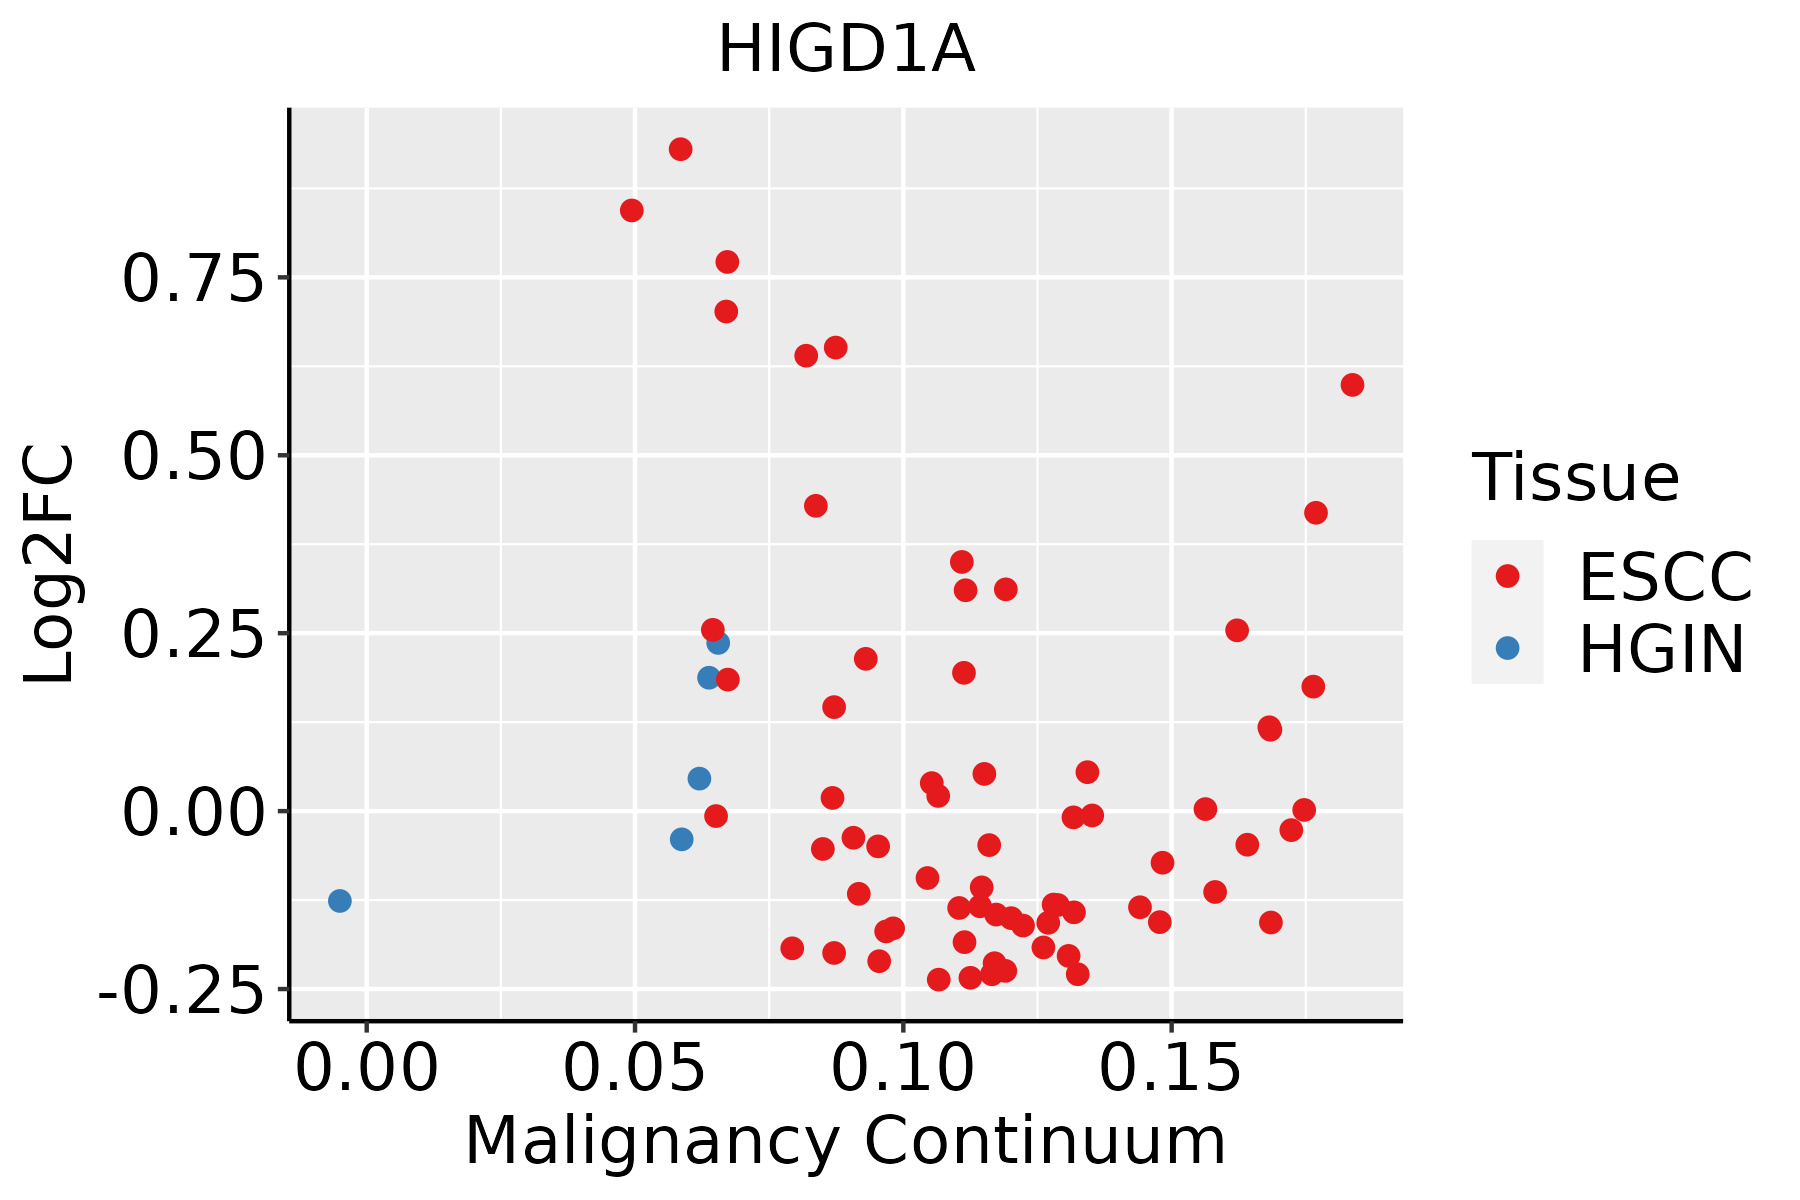 | ESCC: Esophageal squamous cell carcinoma |
| HGIN: High-grade intraepithelial neoplasias | ||
| LGIN: Low-grade intraepithelial neoplasias | ||
| Liver | 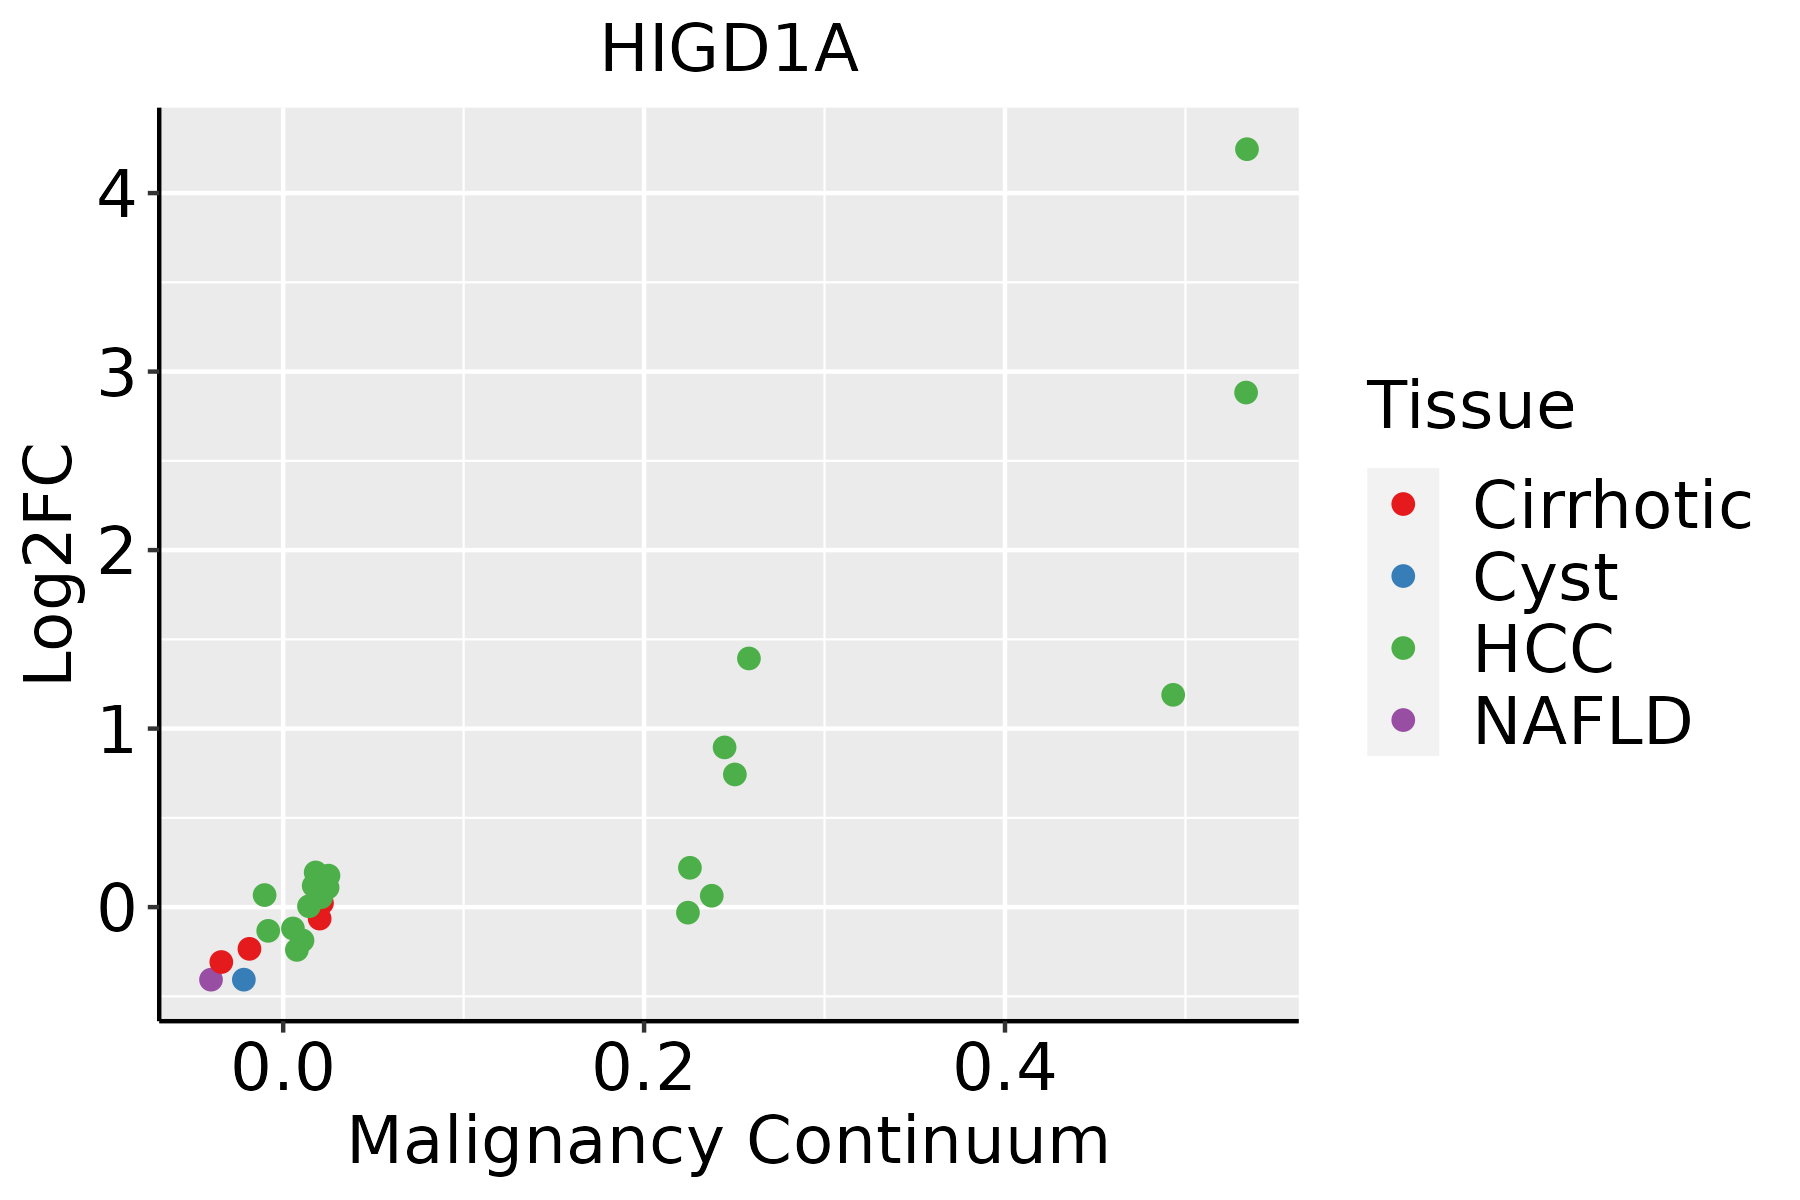 | HCC: Hepatocellular carcinoma |
| NAFLD: Non-alcoholic fatty liver disease | ||
| Oral Cavity |  | EOLP: Erosive Oral lichen planus |
| LP: leukoplakia | ||
| NEOLP: Non-erosive oral lichen planus | ||
| OSCC: Oral squamous cell carcinoma | ||
| Prostate |  | BPH: Benign Prostatic Hyperplasia |
| Skin | 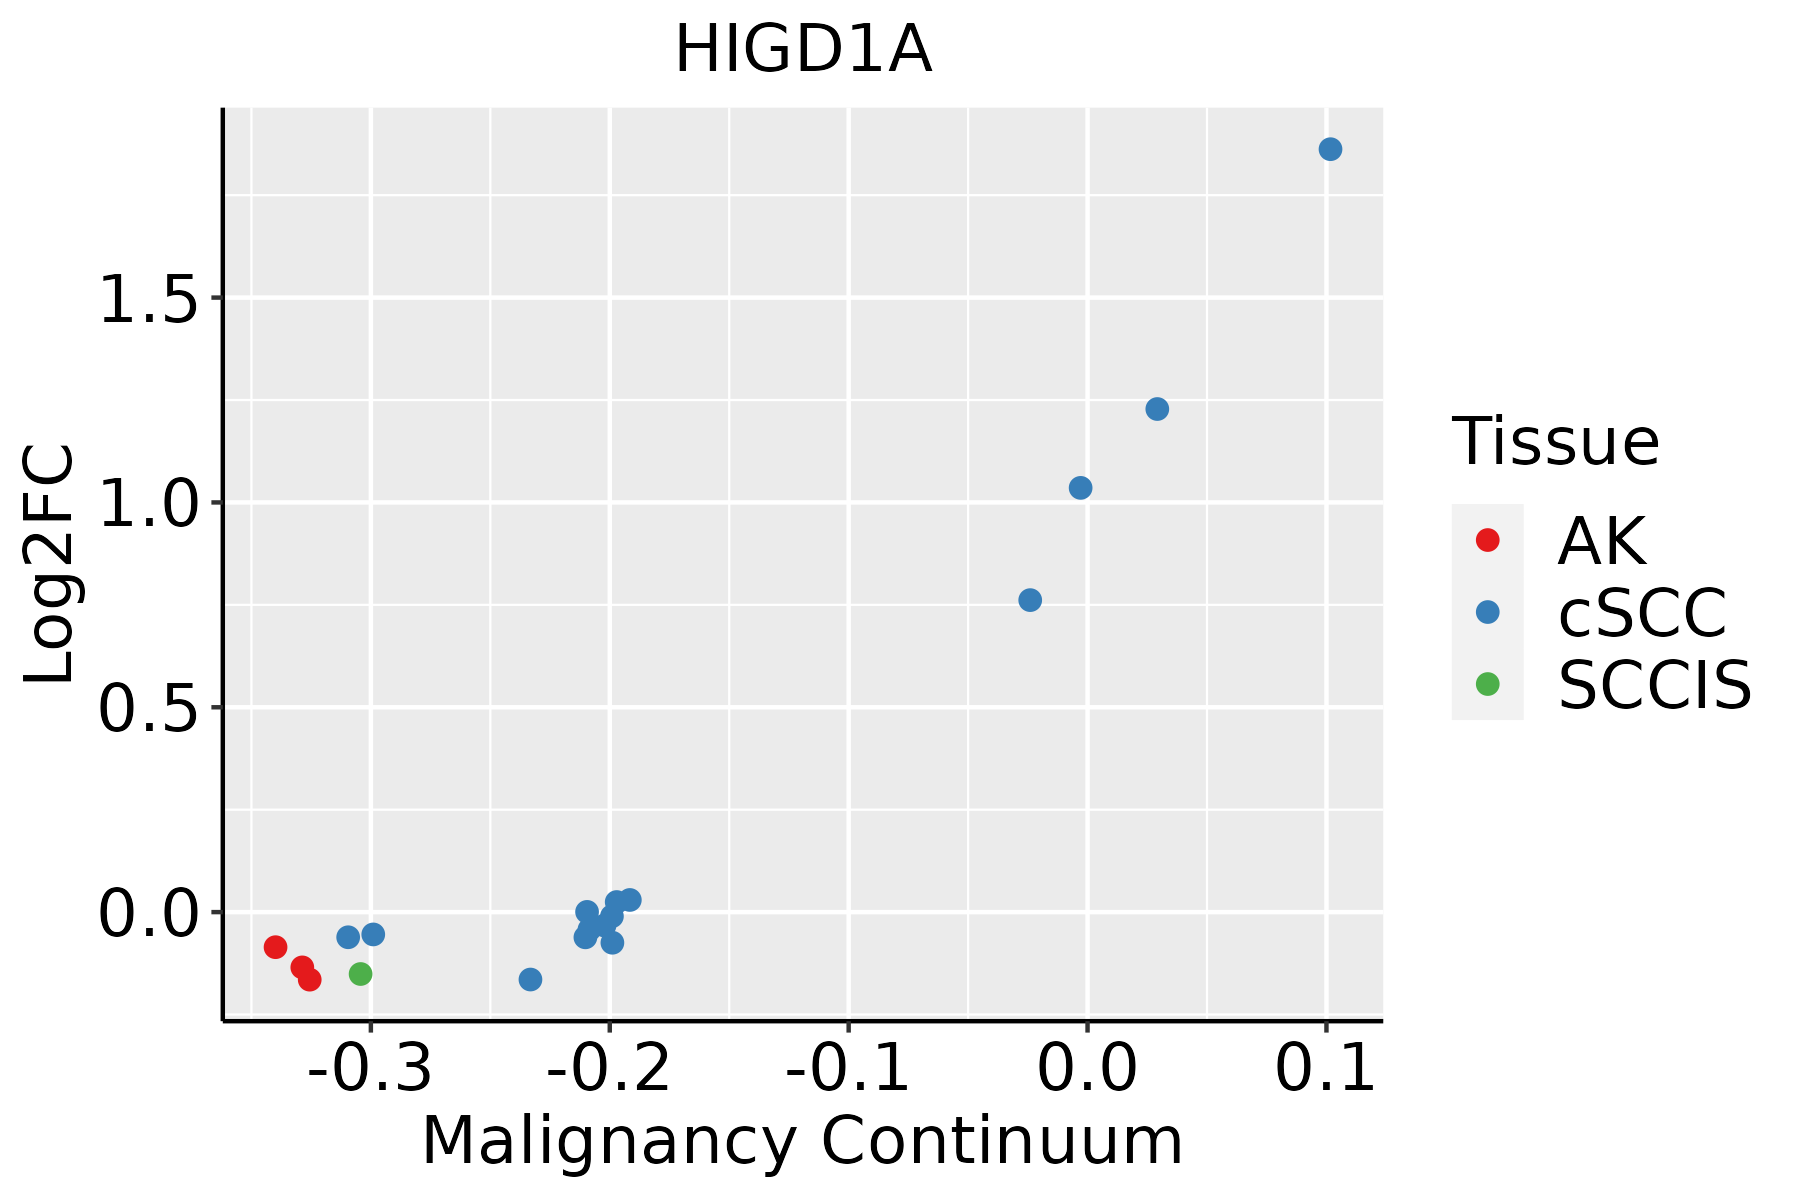 | AK: Actinic keratosis |
| cSCC: Cutaneous squamous cell carcinoma | ||
| SCCIS:squamous cell carcinoma in situ |
| ∗log2FC in expression of this searched gene in stem-like cells from each diseased tissue sample relative to stem-like cells in normal samples in each tissue plotted against the malignancy continuum. Samples are colored based on if they are from different disease stage. |
Top |
Malignant transformation related pathway analysis |
| Find out the enriched GO biological processes and KEGG pathways involved in transition from healthy to precancer to cancer |
| Tissue | Disease Stage | Enriched GO biological Processes |
| Colorectum | AD |  |
| Colorectum | SER |  |
| Colorectum | MSS |  |
| Colorectum | MSI-H |  |
| Colorectum | FAP |  |
| ∗Top 15 enriched GO BP terms are showed in the bar plot of each disease state in each tissue. Each row represents a significant GO biological process which is colored according to the -log10(p.adjust). |
| Page: 1 2 3 4 5 6 7 8 9 |
| GO ID | Tissue | Disease Stage | Description | Gene Ratio | Bg Ratio | pvalue | p.adjust | Count |
| Page: 1 |
| Pathway ID | Tissue | Disease Stage | Description | Gene Ratio | Bg Ratio | pvalue | p.adjust | qvalue | Count |
| Page: 1 |
Top |
Cell-cell communication analysis |
| Identification of potential cell-cell interactions between two cell types and their ligand-receptor pairs for different disease states |
| Ligand | Receptor | LRpair | Pathway | Tissue | Disease Stage |
| Page: 1 |
Top |
Single-cell gene regulatory network inference analysis |
| Find out the significant the regulons (TFs) and the target genes of each regulon across cell types for different disease states |
| TF | Cell Type | Tissue | Disease Stage | Target Gene | RSS | Regulon Activity |
| ∗The dot plots of a searched regulon are shown for all cell subpopulations in each disease state of each tissue based on the regulon specific score inferred using pySCENIC and by calculating the average expression. |
| Page: 1 |
Top |
Somatic mutation of malignant transformation related genes |
| Annotation of somatic variants for genes involved in malignant transformation |
| Hugo Symbol | Variant Class | Variant Classification | dbSNP RS | HGVSc | HGVSp | HGVSp Short | SWISSPROT | BIOTYPE | SIFT | PolyPhen | Tumor Sample Barcode | Tissue | Histology | Sex | Age | Stage | Therapy Types | Drugs | Outcome |
| HIGD1A | SNV | Missense_Mutation | novel | c.79G>C | p.Glu27Gln | p.E27Q | Q9Y241 | protein_coding | deleterious(0.03) | possibly_damaging(0.521) | TCGA-C8-A3M7-01 | Breast | breast invasive carcinoma | Female | <65 | III/IV | Unknown | Unknown | PD |
| HIGD1A | SNV | Missense_Mutation | rs561542879 | c.146N>T | p.Ala49Val | p.A49V | Q9Y241 | protein_coding | deleterious(0.01) | possibly_damaging(0.666) | TCGA-AA-3492-01 | Colorectum | colon adenocarcinoma | Female | >=65 | I/II | Unknown | Unknown | SD |
| HIGD1A | SNV | Missense_Mutation | rs745348917 | c.271N>T | p.Val91Phe | p.V91F | Q9Y241 | protein_coding | deleterious(0.02) | benign(0.007) | TCGA-A5-A0GR-01 | Endometrium | uterine corpus endometrioid carcinoma | Female | >=65 | I/II | Unknown | Unknown | SD |
| HIGD1A | SNV | Missense_Mutation | novel | c.303C>A | p.Phe101Leu | p.F101L | Q9Y241 | protein_coding | tolerated(0.08) | possibly_damaging(0.611) | TCGA-AX-A2HC-01 | Endometrium | uterine corpus endometrioid carcinoma | Female | <65 | III/IV | Chemotherapy | paclitaxel | PD |
| HIGD1A | SNV | Missense_Mutation | novel | c.267G>A | p.Met89Ile | p.M89I | Q9Y241 | protein_coding | tolerated(0.45) | benign(0.03) | TCGA-AX-A2HD-01 | Endometrium | uterine corpus endometrioid carcinoma | Female | >=65 | III/IV | Unknown | Unknown | SD |
| HIGD1A | SNV | Missense_Mutation | c.296N>A | p.Arg99Gln | p.R99Q | Q9Y241 | protein_coding | tolerated(0.49) | benign(0.003) | TCGA-B5-A11N-01 | Endometrium | uterine corpus endometrioid carcinoma | Female | >=65 | I/II | Unknown | Unknown | SD | |
| HIGD1A | SNV | Missense_Mutation | c.192C>A | p.Ser64Arg | p.S64R | Q9Y241 | protein_coding | tolerated(0.14) | benign(0.099) | TCGA-D1-A103-01 | Endometrium | uterine corpus endometrioid carcinoma | Female | >=65 | I/II | Unknown | Unknown | SD | |
| HIGD1A | SNV | Missense_Mutation | rs368330989 | c.277N>G | p.Met93Val | p.M93V | Q9Y241 | protein_coding | tolerated(1) | benign(0.009) | TCGA-K7-A6G5-01 | Liver | liver hepatocellular carcinoma | Male | >=65 | I/II | Unknown | Unknown | SD |
| HIGD1A | SNV | Missense_Mutation | novel | c.134N>T | p.Pro45Leu | p.P45L | Q9Y241 | protein_coding | tolerated(0.06) | probably_damaging(0.984) | TCGA-L4-A4E5-01 | Lung | lung adenocarcinoma | Female | <65 | I/II | Unknown | Unknown | SD |
| HIGD1A | SNV | Missense_Mutation | c.172N>A | p.Gly58Arg | p.G58R | Q9Y241 | protein_coding | tolerated(0.2) | possibly_damaging(0.767) | TCGA-21-1077-01 | Lung | lung squamous cell carcinoma | Male | <65 | I/II | Unknown | Unknown | PD |
| Page: 1 2 |
Top |
Related drugs of malignant transformation related genes |
| Identification of chemicals and drugs interact with genes involved in malignant transfromation |
| (DGIdb 4.0) |
| Entrez ID | Symbol | Category | Interaction Types | Drug Claim Name | Drug Name | PMIDs |
| Page: 1 |

Copyright 2023-Present -The University of Texas Health Science Center at Houston |