
|
|||||
|
 | |
| |
| |
| |
| |
| |
|
Gene: HIF3A |
Gene summary for HIF3A |
| Gene information | Species | Human | Gene symbol | HIF3A | Gene ID | 64344 |
| Gene name | hypoxia inducible factor 3 subunit alpha | |
| Gene Alias | HIF-3A | |
| Cytomap | 19q13.32 | |
| Gene Type | protein-coding | GO ID | GO:0001525 | UniProtAcc | Q9Y2N7 |
Top |
Malignant transformation analysis |
| Identification of the aberrant gene expression in precancerous and cancerous lesions by comparing the gene expression of stem-like cells in diseased tissues with normal stem cells |
| Entrez ID | Symbol | Replicates | Species | Organ | Tissue | Adj P-value | Log2FC | Malignancy |
| 64344 | HIF3A | ATC12 | Human | Thyroid | ATC | 9.50e-14 | 2.73e-01 | 0.34 |
| 64344 | HIF3A | ATC13 | Human | Thyroid | ATC | 4.54e-53 | 1.06e+00 | 0.34 |
| 64344 | HIF3A | ATC4 | Human | Thyroid | ATC | 8.26e-18 | 3.62e-01 | 0.34 |
| 64344 | HIF3A | ATC5 | Human | Thyroid | ATC | 4.84e-63 | 1.12e+00 | 0.34 |
| Page: 1 |
| Tissue | Expression Dynamics | Abbreviation |
| Endometrium | 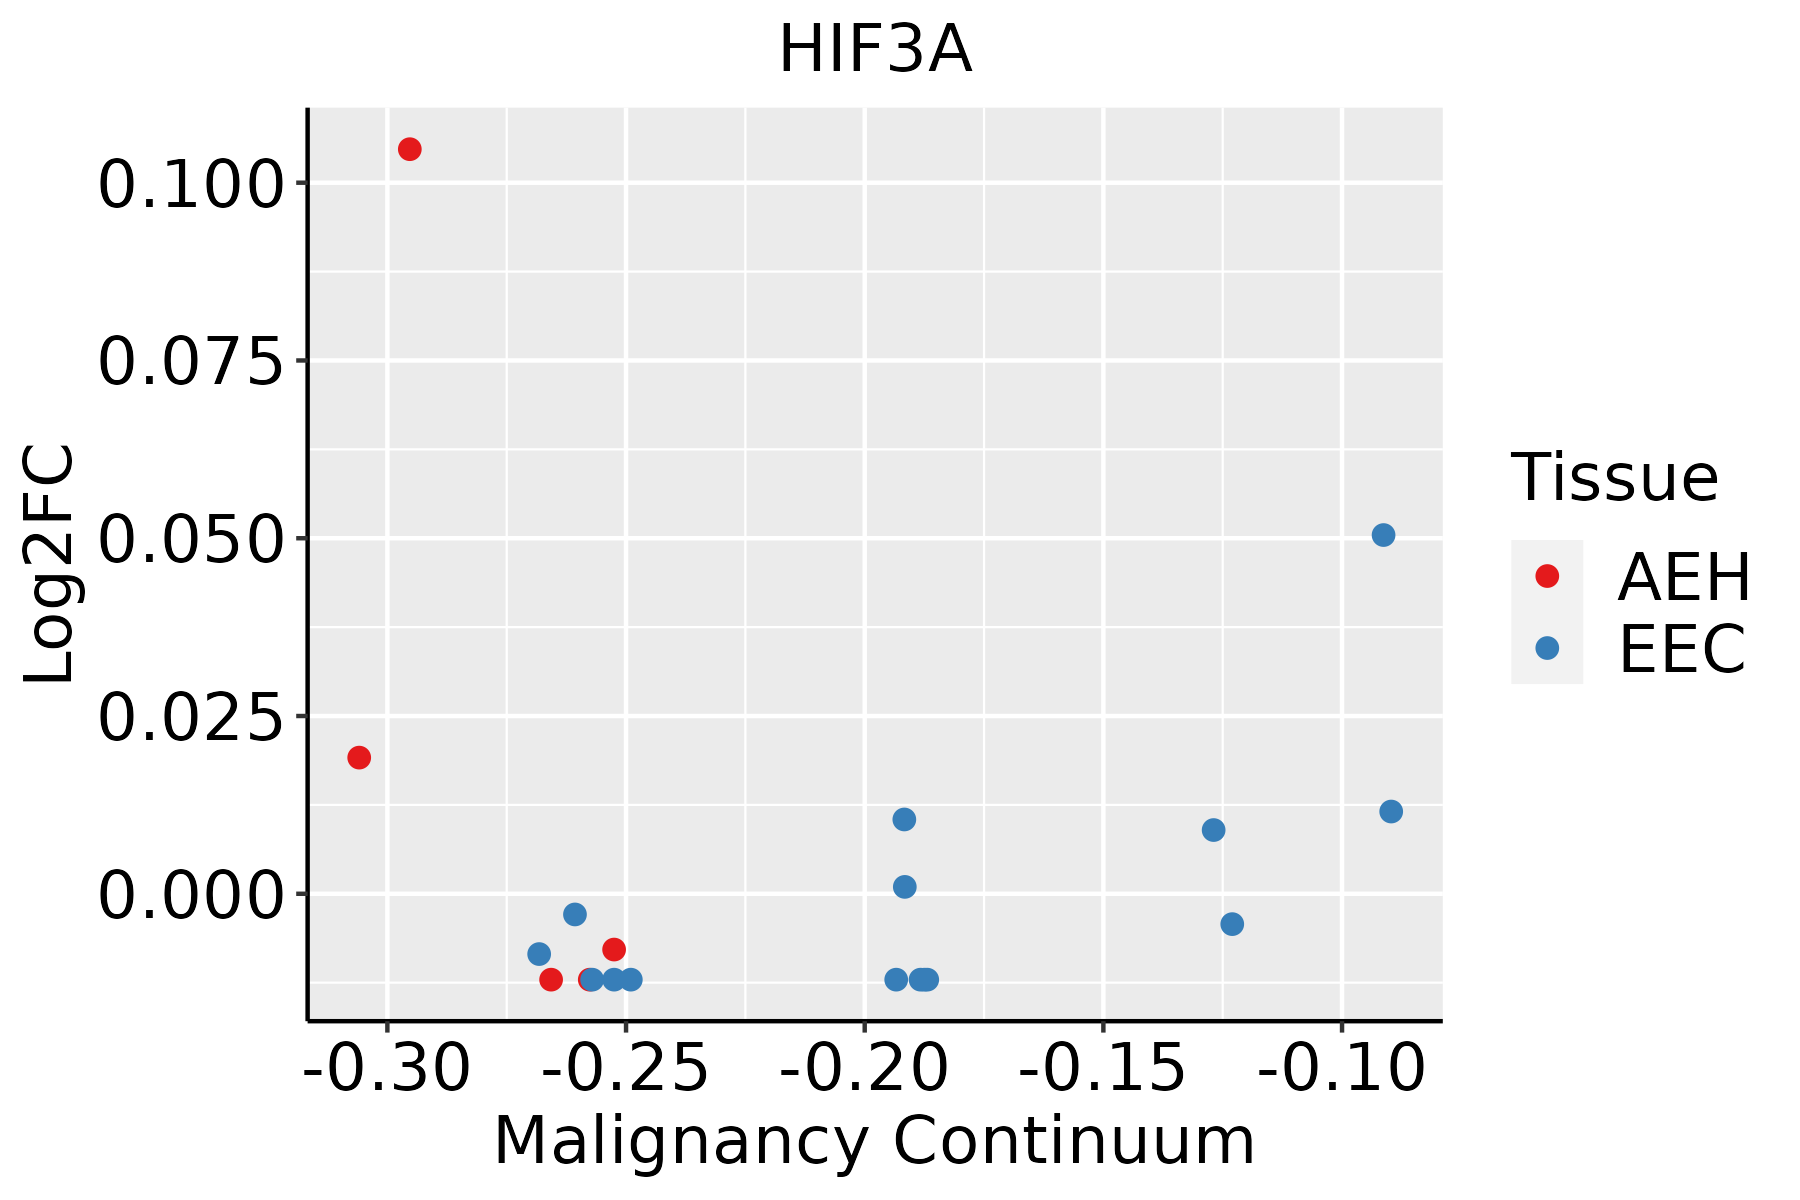 | AEH: Atypical endometrial hyperplasia |
| EEC: Endometrioid Cancer | ||
| Thyroid | 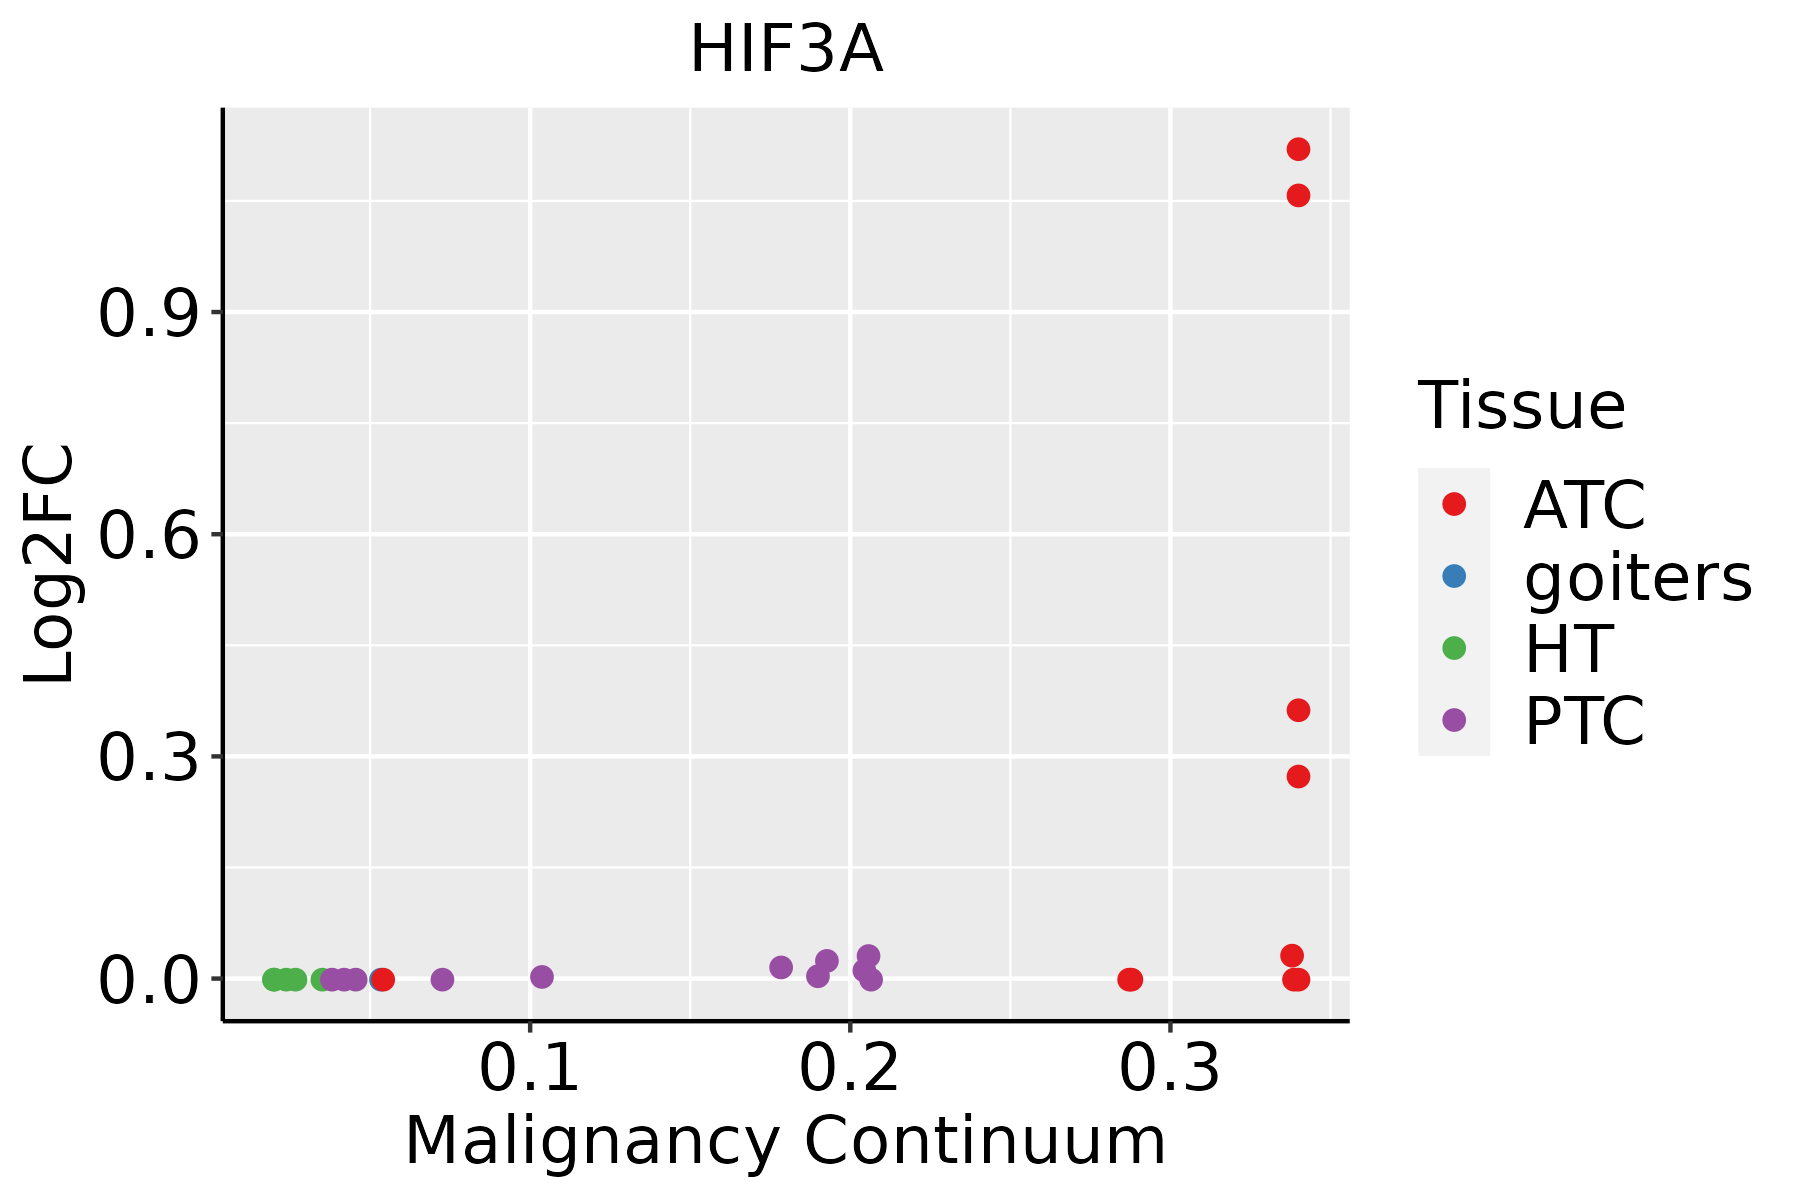 | ATC: Anaplastic thyroid cancer |
| HT: Hashimoto's thyroiditis | ||
| PTC: Papillary thyroid cancer |
| ∗log2FC in expression of this searched gene in stem-like cells from each diseased tissue sample relative to stem-like cells in normal samples in each tissue plotted against the malignancy continuum. Samples are colored based on if they are from different disease stage. |
Top |
Malignant transformation related pathway analysis |
| Find out the enriched GO biological processes and KEGG pathways involved in transition from healthy to precancer to cancer |
| Tissue | Disease Stage | Enriched GO biological Processes |
| Colorectum | AD |  |
| Colorectum | SER |  |
| Colorectum | MSS |  |
| Colorectum | MSI-H |  |
| Colorectum | FAP |  |
| ∗Top 15 enriched GO BP terms are showed in the bar plot of each disease state in each tissue. Each row represents a significant GO biological process which is colored according to the -log10(p.adjust). |
| Page: 1 2 3 4 5 6 7 8 9 |
| GO ID | Tissue | Disease Stage | Description | Gene Ratio | Bg Ratio | pvalue | p.adjust | Count |
| GO:007048228 | Thyroid | ATC | response to oxygen levels | 193/6293 | 347/18723 | 1.83e-17 | 1.93e-15 | 193 |
| GO:003629328 | Thyroid | ATC | response to decreased oxygen levels | 177/6293 | 322/18723 | 1.81e-15 | 1.32e-13 | 177 |
| GO:000166628 | Thyroid | ATC | response to hypoxia | 169/6293 | 307/18723 | 6.58e-15 | 4.12e-13 | 169 |
| Page: 1 |
| Pathway ID | Tissue | Disease Stage | Description | Gene Ratio | Bg Ratio | pvalue | p.adjust | qvalue | Count |
| Page: 1 |
Top |
Cell-cell communication analysis |
| Identification of potential cell-cell interactions between two cell types and their ligand-receptor pairs for different disease states |
| Ligand | Receptor | LRpair | Pathway | Tissue | Disease Stage |
| Page: 1 |
Top |
Single-cell gene regulatory network inference analysis |
| Find out the significant the regulons (TFs) and the target genes of each regulon across cell types for different disease states |
| TF | Cell Type | Tissue | Disease Stage | Target Gene | RSS | Regulon Activity |
| ∗The dot plots of a searched regulon are shown for all cell subpopulations in each disease state of each tissue based on the regulon specific score inferred using pySCENIC and by calculating the average expression. |
| Page: 1 |
Top |
Somatic mutation of malignant transformation related genes |
| Annotation of somatic variants for genes involved in malignant transformation |
| Hugo Symbol | Variant Class | Variant Classification | dbSNP RS | HGVSc | HGVSp | HGVSp Short | SWISSPROT | BIOTYPE | SIFT | PolyPhen | Tumor Sample Barcode | Tissue | Histology | Sex | Age | Stage | Therapy Types | Drugs | Outcome |
| HIF3A | SNV | Missense_Mutation | novel | c.49N>A | p.Glu17Lys | p.E17K | Q9Y2N7 | protein_coding | deleterious(0) | possibly_damaging(0.541) | TCGA-5L-AAT1-01 | Breast | breast invasive carcinoma | Female | <65 | III/IV | Hormone Therapy | letrozol | SD |
| HIF3A | SNV | Missense_Mutation | rs751873472 | c.1195N>A | p.Glu399Lys | p.E399K | Q9Y2N7 | protein_coding | tolerated(0.17) | possibly_damaging(0.557) | TCGA-A1-A0SI-01 | Breast | breast invasive carcinoma | Female | <65 | I/II | Unknown | Unknown | SD |
| HIF3A | SNV | Missense_Mutation | rs762091448 | c.979N>T | p.Arg327Trp | p.R327W | Q9Y2N7 | protein_coding | deleterious(0) | probably_damaging(0.991) | TCGA-A8-A09Z-01 | Breast | breast invasive carcinoma | Female | >=65 | I/II | Unknown | Unknown | SD |
| HIF3A | SNV | Missense_Mutation | novel | c.1772N>G | p.Pro591Arg | p.P591R | Q9Y2N7 | protein_coding | deleterious_low_confidence(0) | probably_damaging(0.994) | TCGA-AC-A5EH-01 | Breast | breast invasive carcinoma | Female | >=65 | I/II | Unknown | Unknown | SD |
| HIF3A | SNV | Missense_Mutation | rs755848938 | c.1969N>A | p.Gly657Ser | p.G657S | Q9Y2N7 | protein_coding | tolerated_low_confidence(1) | benign(0) | TCGA-BH-A0C1-01 | Breast | breast invasive carcinoma | Female | <65 | III/IV | Chemotherapy | adriamycin | PD |
| HIF3A | SNV | Missense_Mutation | c.1419N>T | p.Glu473Asp | p.E473D | Q9Y2N7 | protein_coding | tolerated(0.15) | benign(0.001) | TCGA-BH-A18V-01 | Breast | breast invasive carcinoma | Female | <65 | I/II | Unknown | Unknown | SD | |
| HIF3A | SNV | Missense_Mutation | c.1036N>C | p.Glu346Gln | p.E346Q | Q9Y2N7 | protein_coding | tolerated(0.22) | benign(0.159) | TCGA-D8-A147-01 | Breast | breast invasive carcinoma | Female | <65 | I/II | Chemotherapy | doxorubicine | SD | |
| HIF3A | SNV | Missense_Mutation | rs761192167 | c.1181N>T | p.Pro394Leu | p.P394L | Q9Y2N7 | protein_coding | deleterious(0.02) | benign(0.019) | TCGA-E2-A155-01 | Breast | breast invasive carcinoma | Female | <65 | I/II | Chemotherapy | cytoxan | SD |
| HIF3A | SNV | Missense_Mutation | rs751873472 | c.1195G>A | p.Glu399Lys | p.E399K | Q9Y2N7 | protein_coding | tolerated(0.17) | possibly_damaging(0.557) | TCGA-OL-A5DA-01 | Breast | breast invasive carcinoma | Female | <65 | I/II | Unknown | Unknown | SD |
| HIF3A | insertion | Nonsense_Mutation | novel | c.1059_1060insTAAAAATCTATAAAGAGAATATTTAGTTATTCTGAAGCCTTTC | p.Glu354Ter | p.E354* | Q9Y2N7 | protein_coding | TCGA-B6-A0IK-01 | Breast | breast invasive carcinoma | Female | <65 | III/IV | Unknown | Unknown | PD |
| Page: 1 2 3 4 5 6 7 8 9 10 |
Top |
Related drugs of malignant transformation related genes |
| Identification of chemicals and drugs interact with genes involved in malignant transfromation |
| (DGIdb 4.0) |
| Entrez ID | Symbol | Category | Interaction Types | Drug Claim Name | Drug Name | PMIDs |
| Page: 1 |

Copyright 2023-Present -The University of Texas Health Science Center at Houston |