
|
|||||
|
 | |
| |
| |
| |
| |
| |
|
Gene: HIF1A-AS2 |
Gene summary for HIF1A-AS2 |
| Gene information | Species | Human | Gene symbol | HIF1A-AS2 | Gene ID | 100750247 |
| Gene name | HIF1A antisense RNA 2 | |
| Gene Alias | 3'aHIF-1A | |
| Cytomap | 14q23.2 | |
| Gene Type | ncRNA | GO ID | GO:0001503 | UniProtAcc | NA |
Top |
Malignant transformation analysis |
| Identification of the aberrant gene expression in precancerous and cancerous lesions by comparing the gene expression of stem-like cells in diseased tissues with normal stem cells |
| Entrez ID | Symbol | Replicates | Species | Organ | Tissue | Adj P-value | Log2FC | Malignancy |
| 100750247 | HIF1A-AS2 | P4T-E | Human | Esophagus | ESCC | 2.20e-02 | 1.09e-01 | 0.1323 |
| 100750247 | HIF1A-AS2 | P5T-E | Human | Esophagus | ESCC | 8.40e-04 | 9.69e-02 | 0.1327 |
| 100750247 | HIF1A-AS2 | P8T-E | Human | Esophagus | ESCC | 1.78e-03 | 9.69e-02 | 0.0889 |
| 100750247 | HIF1A-AS2 | P10T-E | Human | Esophagus | ESCC | 8.40e-04 | 1.00e-01 | 0.116 |
| 100750247 | HIF1A-AS2 | P11T-E | Human | Esophagus | ESCC | 9.07e-04 | 2.94e-01 | 0.1426 |
| 100750247 | HIF1A-AS2 | P15T-E | Human | Esophagus | ESCC | 6.21e-15 | 3.61e-01 | 0.1149 |
| 100750247 | HIF1A-AS2 | P23T-E | Human | Esophagus | ESCC | 1.31e-04 | 1.63e-01 | 0.108 |
| 100750247 | HIF1A-AS2 | P26T-E | Human | Esophagus | ESCC | 3.97e-04 | 1.19e-01 | 0.1276 |
| 100750247 | HIF1A-AS2 | P39T-E | Human | Esophagus | ESCC | 3.75e-03 | 1.52e-01 | 0.0894 |
| 100750247 | HIF1A-AS2 | P49T-E | Human | Esophagus | ESCC | 1.65e-10 | 6.23e-01 | 0.1768 |
| 100750247 | HIF1A-AS2 | P54T-E | Human | Esophagus | ESCC | 3.86e-09 | 2.49e-01 | 0.0975 |
| 100750247 | HIF1A-AS2 | P61T-E | Human | Esophagus | ESCC | 1.59e-04 | 1.33e-01 | 0.099 |
| 100750247 | HIF1A-AS2 | P74T-E | Human | Esophagus | ESCC | 3.81e-05 | 2.48e-01 | 0.1479 |
| 100750247 | HIF1A-AS2 | P75T-E | Human | Esophagus | ESCC | 3.75e-03 | 1.50e-01 | 0.1125 |
| 100750247 | HIF1A-AS2 | P82T-E | Human | Esophagus | ESCC | 4.14e-03 | 6.07e-01 | 0.1072 |
| 100750247 | HIF1A-AS2 | P84T-E | Human | Esophagus | ESCC | 1.34e-04 | 6.55e-01 | 0.0933 |
| 100750247 | HIF1A-AS2 | P107T-E | Human | Esophagus | ESCC | 6.90e-07 | 2.79e-01 | 0.171 |
| 100750247 | HIF1A-AS2 | P128T-E | Human | Esophagus | ESCC | 3.42e-23 | 8.22e-01 | 0.1241 |
| 100750247 | HIF1A-AS2 | P130T-E | Human | Esophagus | ESCC | 3.28e-14 | 3.92e-01 | 0.1676 |
| 100750247 | HIF1A-AS2 | ATC2 | Human | Thyroid | ATC | 3.71e-05 | 7.72e-01 | 0.34 |
| Page: 1 |
| Tissue | Expression Dynamics | Abbreviation |
| Endometrium | 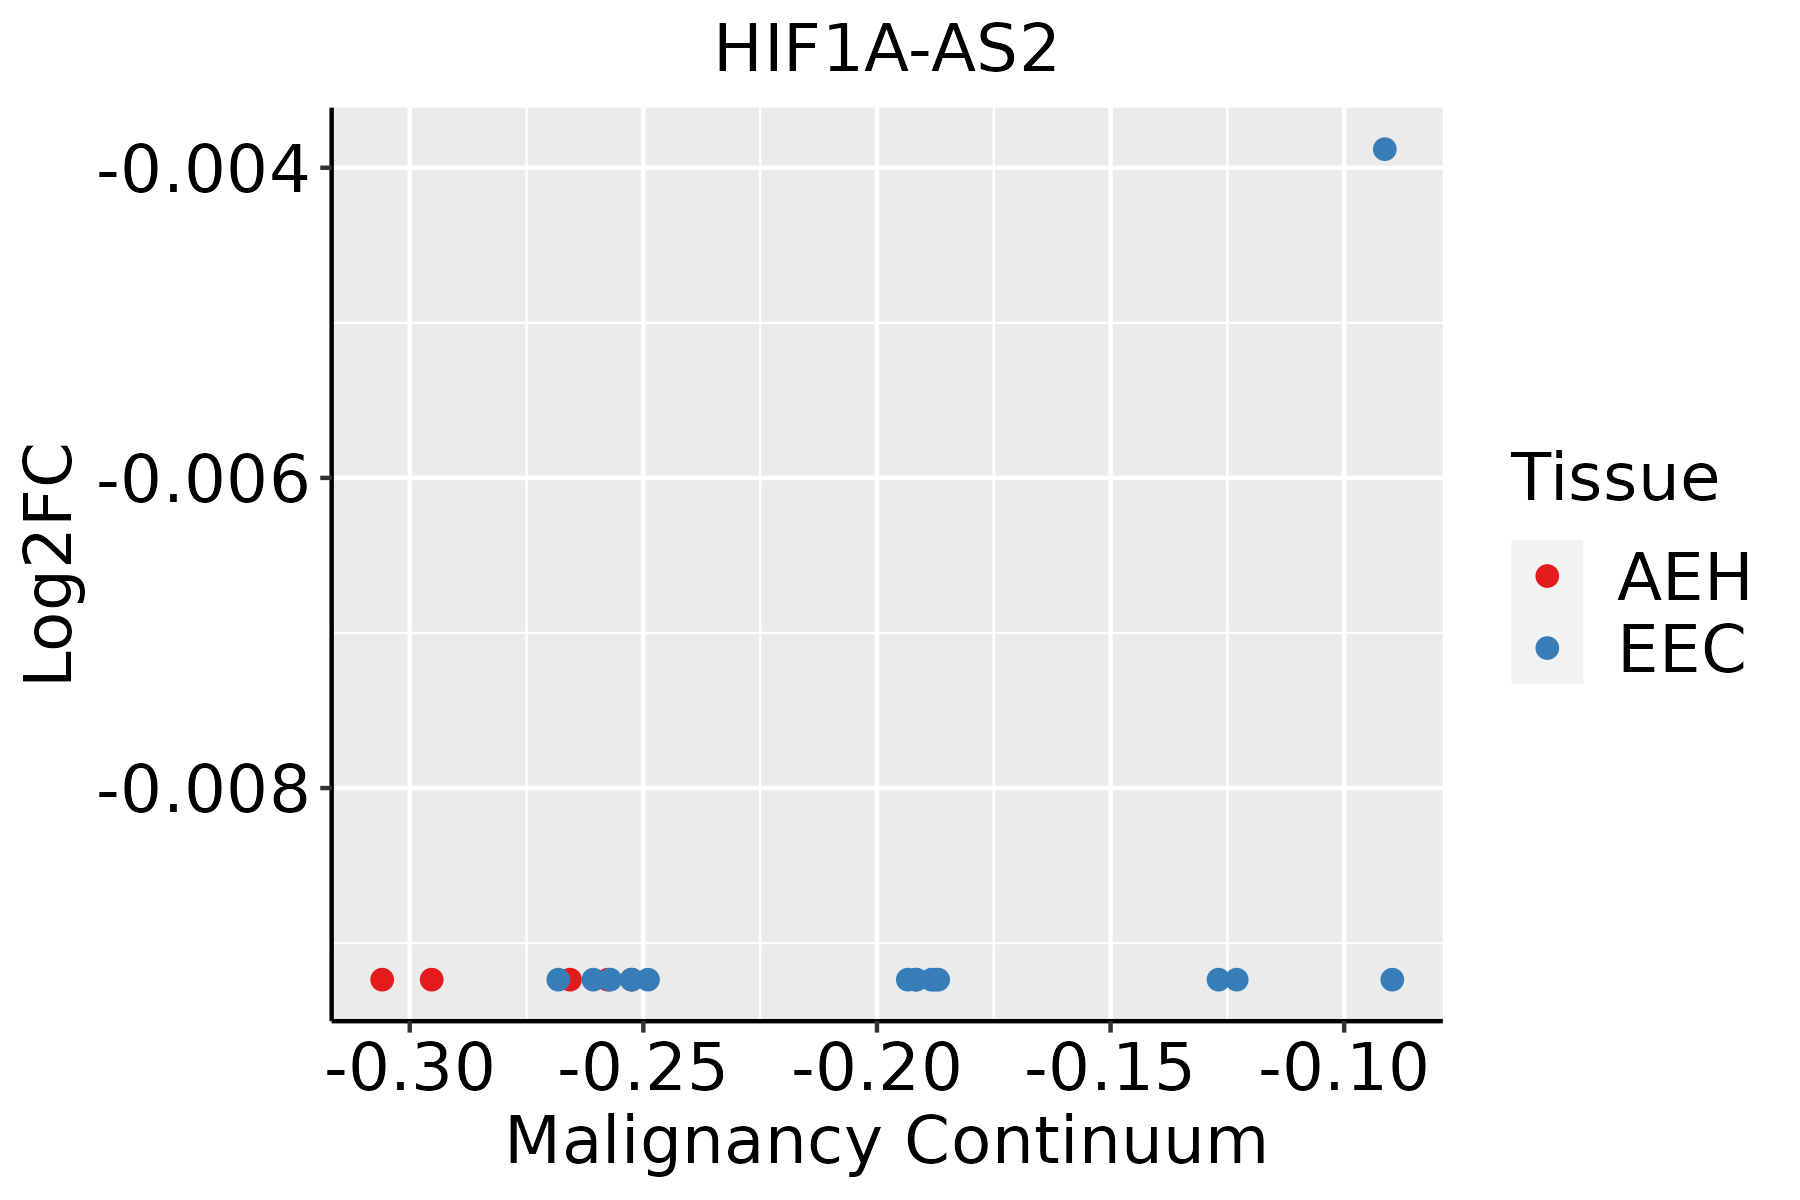 | AEH: Atypical endometrial hyperplasia |
| EEC: Endometrioid Cancer | ||
| Esophagus | 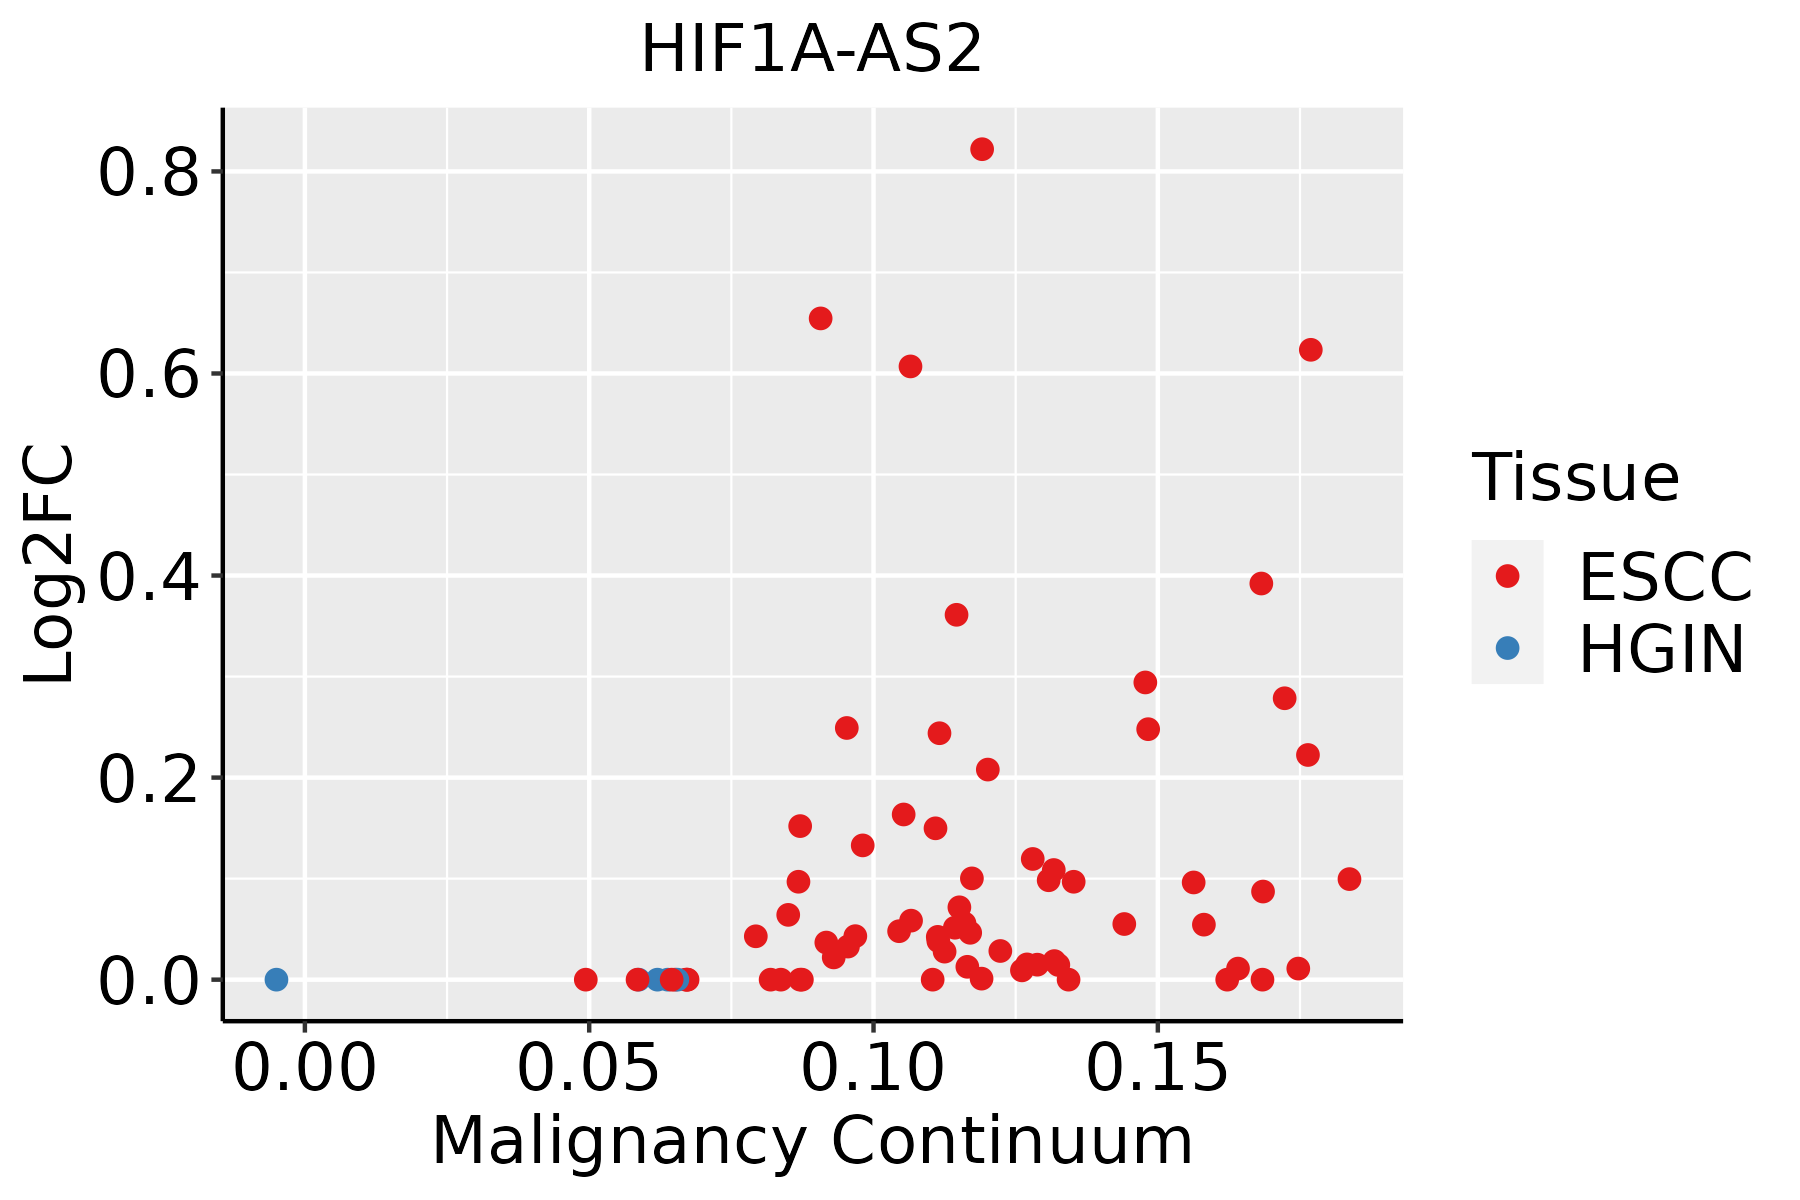 | ESCC: Esophageal squamous cell carcinoma |
| HGIN: High-grade intraepithelial neoplasias | ||
| LGIN: Low-grade intraepithelial neoplasias | ||
| Thyroid | 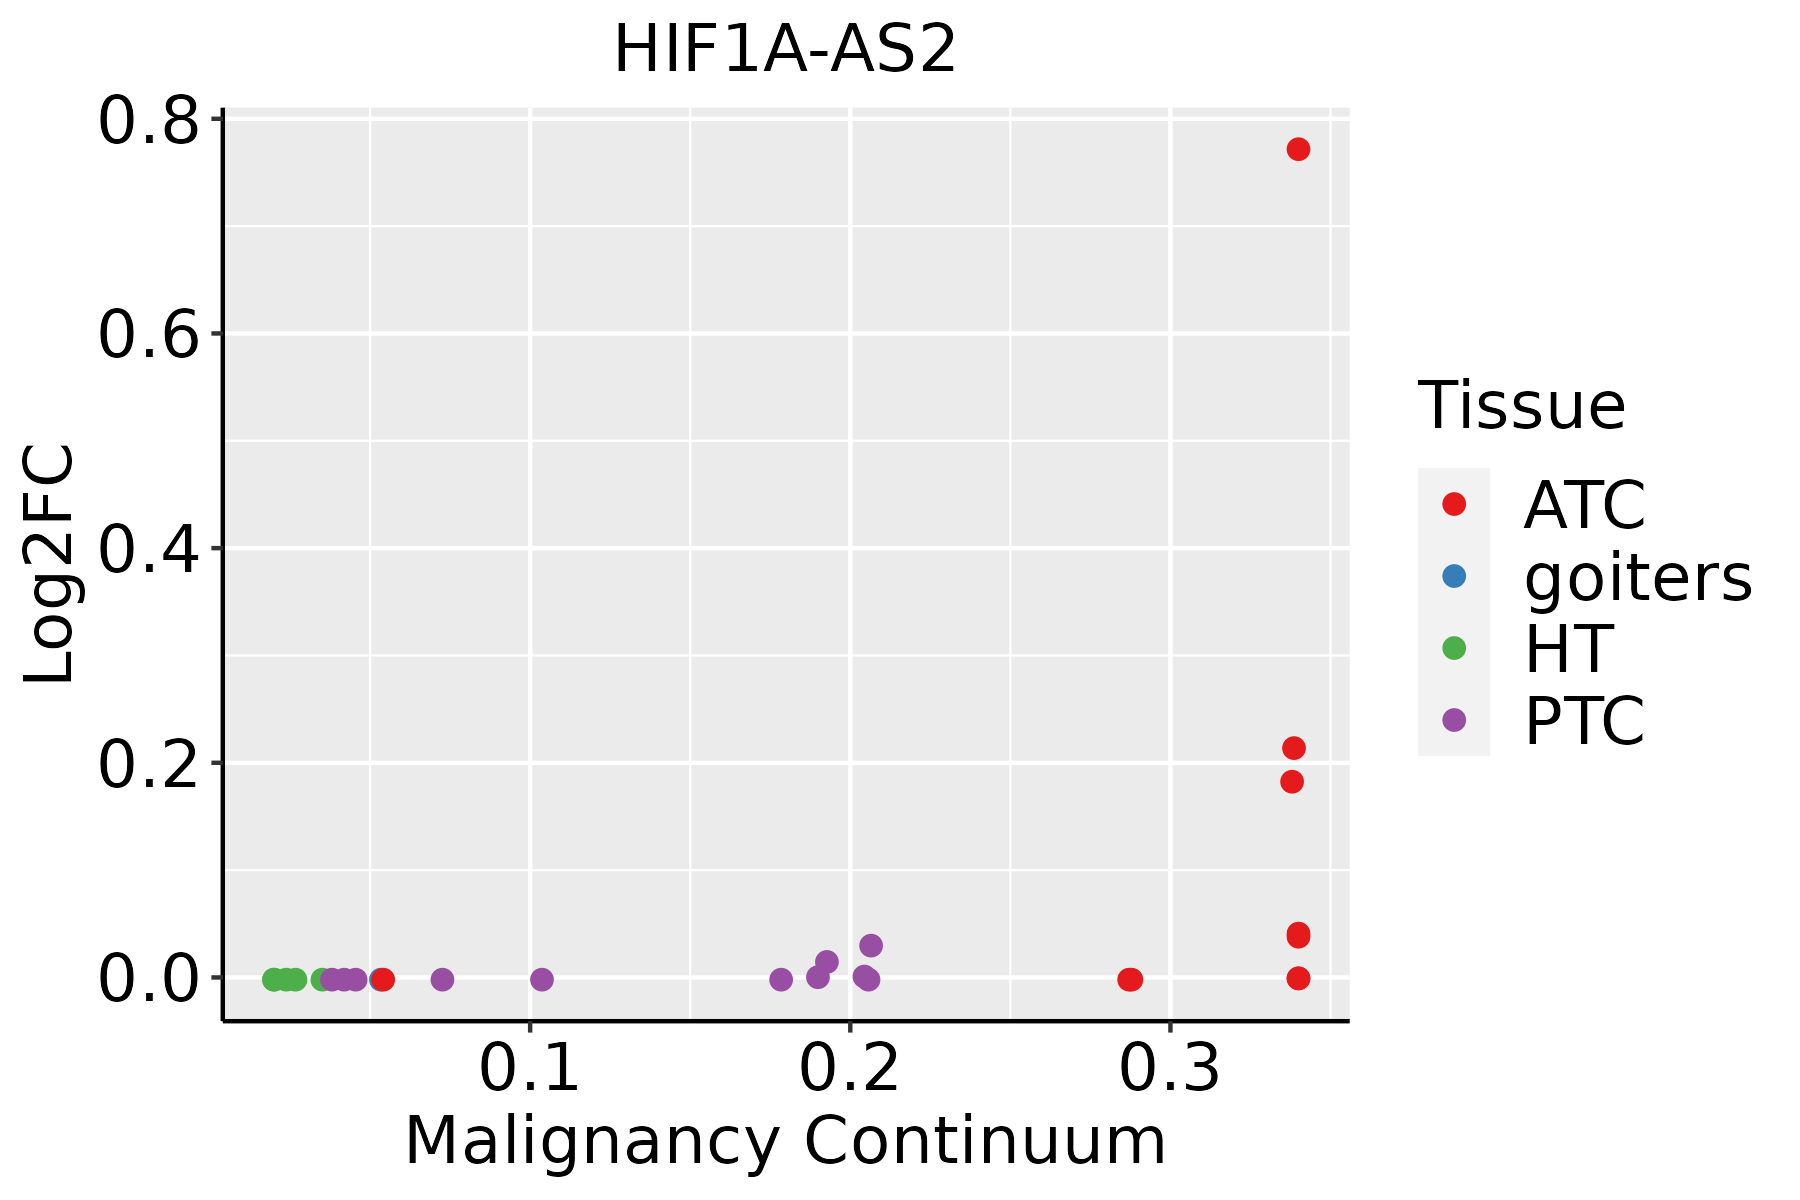 | ATC: Anaplastic thyroid cancer |
| HT: Hashimoto's thyroiditis | ||
| PTC: Papillary thyroid cancer |
| ∗log2FC in expression of this searched gene in stem-like cells from each diseased tissue sample relative to stem-like cells in normal samples in each tissue plotted against the malignancy continuum. Samples are colored based on if they are from different disease stage. |
Top |
Malignant transformation related pathway analysis |
| Find out the enriched GO biological processes and KEGG pathways involved in transition from healthy to precancer to cancer |
| Tissue | Disease Stage | Enriched GO biological Processes |
| Colorectum | AD |  |
| Colorectum | SER |  |
| Colorectum | MSS |  |
| Colorectum | MSI-H |  |
| Colorectum | FAP |  |
| ∗Top 15 enriched GO BP terms are showed in the bar plot of each disease state in each tissue. Each row represents a significant GO biological process which is colored according to the -log10(p.adjust). |
| Page: 1 2 3 4 5 6 7 8 9 |
| GO ID | Tissue | Disease Stage | Description | Gene Ratio | Bg Ratio | pvalue | p.adjust | Count |
| GO:000164918 | Esophagus | ESCC | osteoblast differentiation | 140/8552 | 229/18723 | 1.63e-06 | 1.95e-05 | 140 |
| GO:000150317 | Esophagus | ESCC | ossification | 232/8552 | 408/18723 | 3.00e-06 | 3.40e-05 | 232 |
| GO:00609667 | Esophagus | ESCC | regulation of gene silencing by RNA | 37/8552 | 53/18723 | 3.25e-04 | 1.92e-03 | 37 |
| GO:00601479 | Esophagus | ESCC | regulation of posttranscriptional gene silencing | 36/8552 | 52/18723 | 5.05e-04 | 2.79e-03 | 36 |
| GO:006096410 | Esophagus | ESCC | regulation of gene silencing by miRNA | 34/8552 | 49/18723 | 6.74e-04 | 3.56e-03 | 34 |
| GO:00456675 | Esophagus | ESCC | regulation of osteoblast differentiation | 77/8552 | 132/18723 | 2.28e-03 | 1.00e-02 | 77 |
| GO:00456695 | Esophagus | ESCC | positive regulation of osteoblast differentiation | 43/8552 | 69/18723 | 3.93e-03 | 1.59e-02 | 43 |
| GO:00609686 | Esophagus | ESCC | regulation of gene silencing | 48/8552 | 81/18723 | 9.54e-03 | 3.30e-02 | 48 |
| GO:000150332 | Thyroid | ATC | ossification | 206/6293 | 408/18723 | 9.23e-13 | 3.95e-11 | 206 |
| GO:000164932 | Thyroid | ATC | osteoblast differentiation | 122/6293 | 229/18723 | 6.04e-10 | 1.60e-08 | 122 |
| GO:004566721 | Thyroid | ATC | regulation of osteoblast differentiation | 66/6293 | 132/18723 | 7.03e-05 | 5.36e-04 | 66 |
| GO:006014717 | Thyroid | ATC | regulation of posttranscriptional gene silencing | 31/6293 | 52/18723 | 1.06e-04 | 7.61e-04 | 31 |
| GO:006096616 | Thyroid | ATC | regulation of gene silencing by RNA | 31/6293 | 53/18723 | 1.74e-04 | 1.19e-03 | 31 |
| GO:004566912 | Thyroid | ATC | positive regulation of osteoblast differentiation | 38/6293 | 69/18723 | 1.97e-04 | 1.31e-03 | 38 |
| GO:006096418 | Thyroid | ATC | regulation of gene silencing by miRNA | 29/6293 | 49/18723 | 2.11e-04 | 1.39e-03 | 29 |
| GO:006096815 | Thyroid | ATC | regulation of gene silencing | 38/6293 | 81/18723 | 8.77e-03 | 3.33e-02 | 38 |
| Page: 1 |
| Pathway ID | Tissue | Disease Stage | Description | Gene Ratio | Bg Ratio | pvalue | p.adjust | qvalue | Count |
| Page: 1 |
Top |
Cell-cell communication analysis |
| Identification of potential cell-cell interactions between two cell types and their ligand-receptor pairs for different disease states |
| Ligand | Receptor | LRpair | Pathway | Tissue | Disease Stage |
| Page: 1 |
Top |
Single-cell gene regulatory network inference analysis |
| Find out the significant the regulons (TFs) and the target genes of each regulon across cell types for different disease states |
| TF | Cell Type | Tissue | Disease Stage | Target Gene | RSS | Regulon Activity |
| ∗The dot plots of a searched regulon are shown for all cell subpopulations in each disease state of each tissue based on the regulon specific score inferred using pySCENIC and by calculating the average expression. |
| Page: 1 |
Top |
Somatic mutation of malignant transformation related genes |
| Annotation of somatic variants for genes involved in malignant transformation |
| Hugo Symbol | Variant Class | Variant Classification | dbSNP RS | HGVSc | HGVSp | HGVSp Short | SWISSPROT | BIOTYPE | SIFT | PolyPhen | Tumor Sample Barcode | Tissue | Histology | Sex | Age | Stage | Therapy Types | Drugs | Outcome |
| Page: 1 |
Top |
Related drugs of malignant transformation related genes |
| Identification of chemicals and drugs interact with genes involved in malignant transfromation |
| (DGIdb 4.0) |
| Entrez ID | Symbol | Category | Interaction Types | Drug Claim Name | Drug Name | PMIDs |
| Page: 1 |

Copyright 2023-Present -The University of Texas Health Science Center at Houston |