
|
|||||
|
 | |
| |
| |
| |
| |
| |
|
Gene: HID1 |
Gene summary for HID1 |
| Gene information | Species | Human | Gene symbol | HID1 | Gene ID | 283987 |
| Gene name | HID1 domain containing | |
| Gene Alias | 17orf28 | |
| Cytomap | 17q25.1 | |
| Gene Type | protein-coding | GO ID | GO:0000138 | UniProtAcc | Q8IV36 |
Top |
Malignant transformation analysis |
| Identification of the aberrant gene expression in precancerous and cancerous lesions by comparing the gene expression of stem-like cells in diseased tissues with normal stem cells |
| Entrez ID | Symbol | Replicates | Species | Organ | Tissue | Adj P-value | Log2FC | Malignancy |
| 283987 | HID1 | HTA11_1938_2000001011 | Human | Colorectum | AD | 2.30e-04 | 2.55e-01 | -0.0811 |
| 283987 | HID1 | HTA11_78_2000001011 | Human | Colorectum | AD | 1.23e-03 | 2.14e-01 | -0.1088 |
| 283987 | HID1 | HTA11_2112_2000001011 | Human | Colorectum | SER | 1.00e-02 | 6.64e-01 | -0.2196 |
| 283987 | HID1 | HTA11_696_2000001011 | Human | Colorectum | AD | 3.47e-10 | 3.15e-01 | -0.1464 |
| 283987 | HID1 | HTA11_866_2000001011 | Human | Colorectum | AD | 3.59e-09 | 2.77e-01 | -0.1001 |
| 283987 | HID1 | HTA11_1391_2000001011 | Human | Colorectum | AD | 9.56e-03 | 2.37e-01 | -0.059 |
| 283987 | HID1 | HTA11_546_2000001011 | Human | Colorectum | AD | 6.02e-03 | 3.73e-01 | -0.0842 |
| 283987 | HID1 | HTA11_7696_3000711011 | Human | Colorectum | AD | 1.84e-02 | 1.13e-01 | 0.0674 |
| 283987 | HID1 | HTA11_99999965062_69753 | Human | Colorectum | MSI-H | 4.95e-05 | 6.36e-01 | 0.3487 |
| 283987 | HID1 | HTA11_99999965104_69814 | Human | Colorectum | MSS | 4.42e-03 | 2.87e-01 | 0.281 |
| 283987 | HID1 | HTA11_99999971662_82457 | Human | Colorectum | MSS | 2.75e-05 | 2.51e-01 | 0.3859 |
| 283987 | HID1 | HTA11_99999974143_84620 | Human | Colorectum | MSS | 1.13e-06 | 2.06e-01 | 0.3005 |
| 283987 | HID1 | LZE22T | Human | Esophagus | ESCC | 5.47e-03 | 1.94e-01 | 0.068 |
| 283987 | HID1 | P8T-E | Human | Esophagus | ESCC | 2.62e-13 | 2.69e-01 | 0.0889 |
| 283987 | HID1 | P10T-E | Human | Esophagus | ESCC | 8.02e-06 | 5.72e-02 | 0.116 |
| 283987 | HID1 | P12T-E | Human | Esophagus | ESCC | 2.10e-06 | 7.01e-02 | 0.1122 |
| 283987 | HID1 | P15T-E | Human | Esophagus | ESCC | 2.34e-06 | 5.32e-02 | 0.1149 |
| 283987 | HID1 | P16T-E | Human | Esophagus | ESCC | 2.19e-05 | 8.43e-02 | 0.1153 |
| 283987 | HID1 | P27T-E | Human | Esophagus | ESCC | 3.41e-02 | 1.28e-02 | 0.1055 |
| 283987 | HID1 | P28T-E | Human | Esophagus | ESCC | 5.28e-04 | 1.36e-01 | 0.1149 |
| Page: 1 2 |
| Tissue | Expression Dynamics | Abbreviation |
| Colorectum (GSE201348) |  | FAP: Familial adenomatous polyposis |
| CRC: Colorectal cancer | ||
| Colorectum (HTA11) |  | AD: Adenomas |
| SER: Sessile serrated lesions | ||
| MSI-H: Microsatellite-high colorectal cancer | ||
| MSS: Microsatellite stable colorectal cancer | ||
| Esophagus | 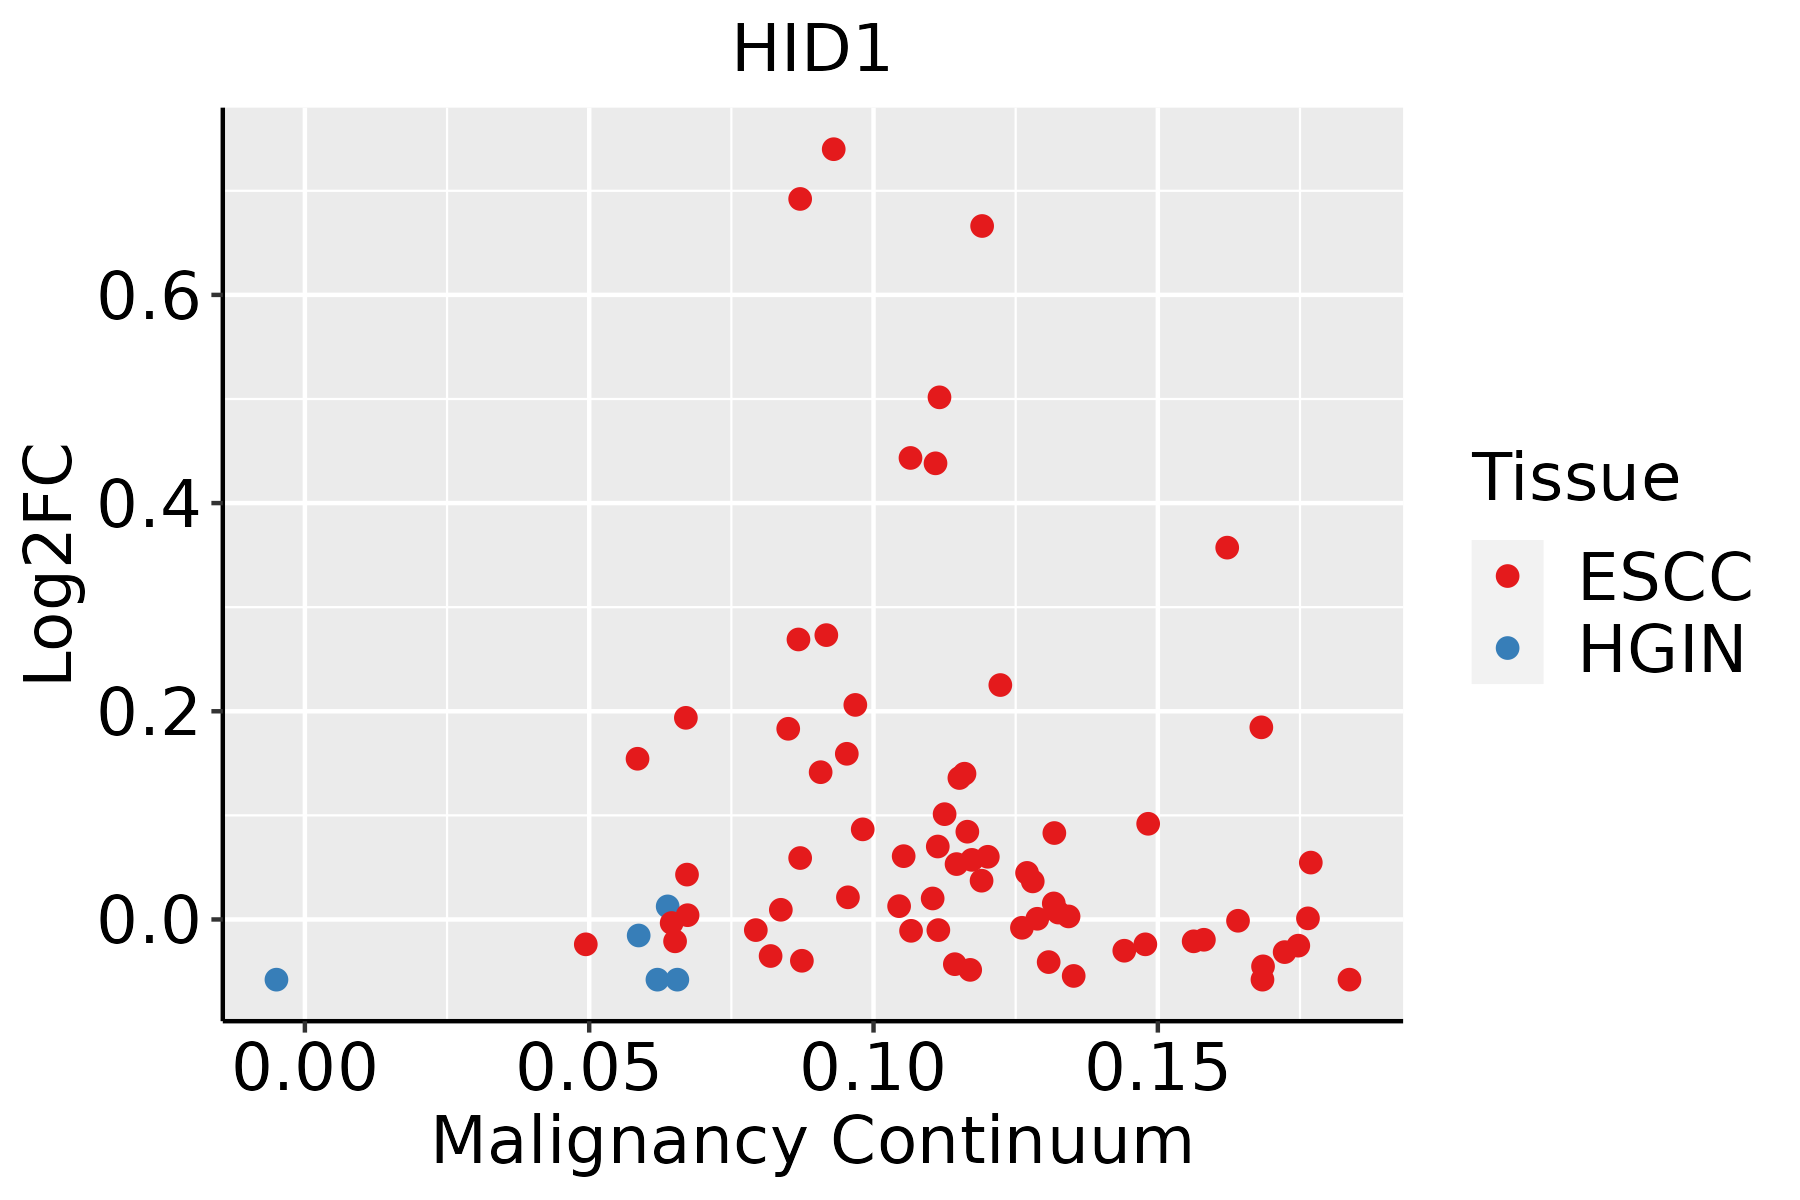 | ESCC: Esophageal squamous cell carcinoma |
| HGIN: High-grade intraepithelial neoplasias | ||
| LGIN: Low-grade intraepithelial neoplasias | ||
| Prostate | 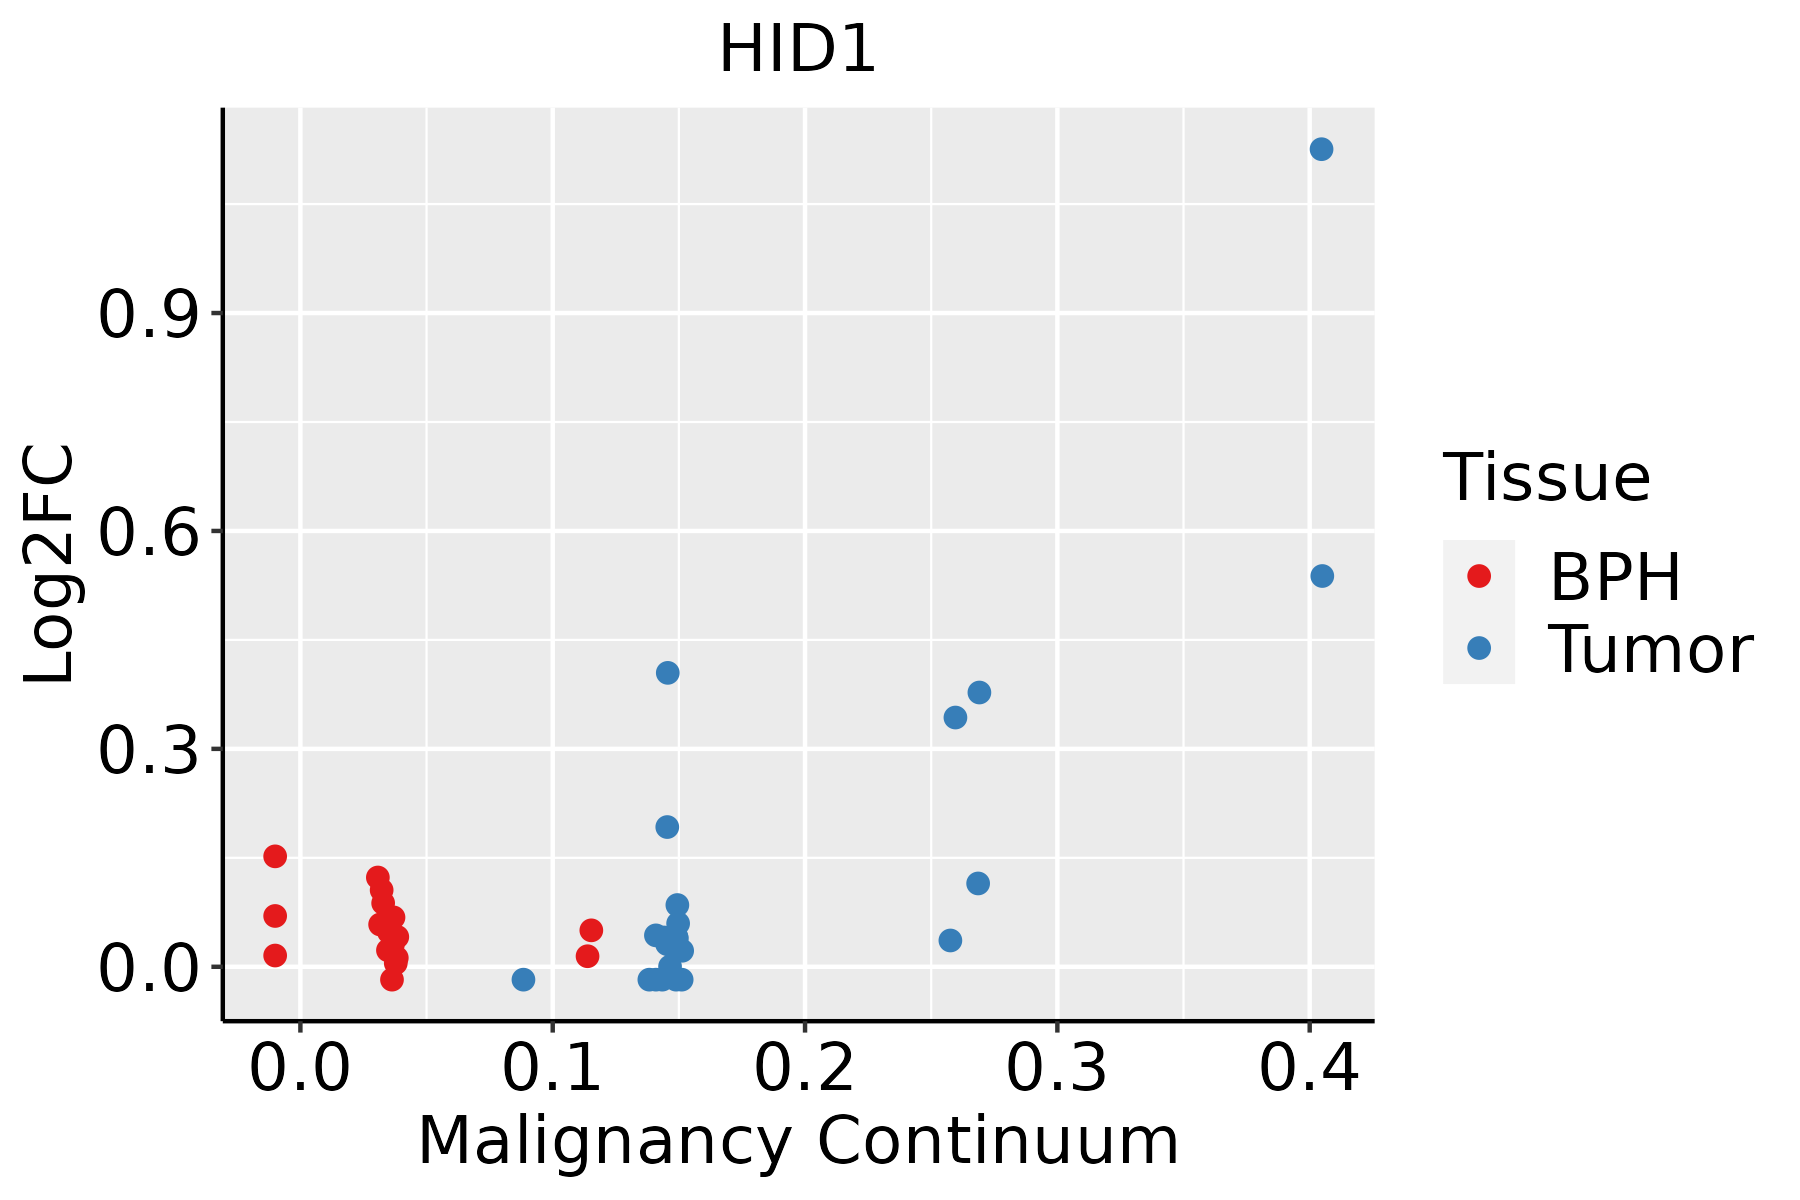 | BPH: Benign Prostatic Hyperplasia |
| ∗log2FC in expression of this searched gene in stem-like cells from each diseased tissue sample relative to stem-like cells in normal samples in each tissue plotted against the malignancy continuum. Samples are colored based on if they are from different disease stage. |
Top |
Malignant transformation related pathway analysis |
| Find out the enriched GO biological processes and KEGG pathways involved in transition from healthy to precancer to cancer |
| Tissue | Disease Stage | Enriched GO biological Processes |
| Colorectum | AD |  |
| Colorectum | SER |  |
| Colorectum | MSS |  |
| Colorectum | MSI-H |  |
| Colorectum | FAP |  |
| ∗Top 15 enriched GO BP terms are showed in the bar plot of each disease state in each tissue. Each row represents a significant GO biological process which is colored according to the -log10(p.adjust). |
| Page: 1 2 3 4 5 6 7 8 9 |
| GO ID | Tissue | Disease Stage | Description | Gene Ratio | Bg Ratio | pvalue | p.adjust | Count |
| Page: 1 |
| Pathway ID | Tissue | Disease Stage | Description | Gene Ratio | Bg Ratio | pvalue | p.adjust | qvalue | Count |
| Page: 1 |
Top |
Cell-cell communication analysis |
| Identification of potential cell-cell interactions between two cell types and their ligand-receptor pairs for different disease states |
| Ligand | Receptor | LRpair | Pathway | Tissue | Disease Stage |
| Page: 1 |
Top |
Single-cell gene regulatory network inference analysis |
| Find out the significant the regulons (TFs) and the target genes of each regulon across cell types for different disease states |
| TF | Cell Type | Tissue | Disease Stage | Target Gene | RSS | Regulon Activity |
| ∗The dot plots of a searched regulon are shown for all cell subpopulations in each disease state of each tissue based on the regulon specific score inferred using pySCENIC and by calculating the average expression. |
| Page: 1 |
Top |
Somatic mutation of malignant transformation related genes |
| Annotation of somatic variants for genes involved in malignant transformation |
| Hugo Symbol | Variant Class | Variant Classification | dbSNP RS | HGVSc | HGVSp | HGVSp Short | SWISSPROT | BIOTYPE | SIFT | PolyPhen | Tumor Sample Barcode | Tissue | Histology | Sex | Age | Stage | Therapy Types | Drugs | Outcome |
| HID1 | SNV | Missense_Mutation | novel | c.616G>C | p.Glu206Gln | p.E206Q | Q8IV36 | protein_coding | deleterious(0) | probably_damaging(0.988) | TCGA-AN-A0FX-01 | Breast | breast invasive carcinoma | Female | <65 | I/II | Unknown | Unknown | SD |
| HID1 | SNV | Missense_Mutation | novel | c.1498N>G | p.Met500Val | p.M500V | Q8IV36 | protein_coding | deleterious(0) | possibly_damaging(0.516) | TCGA-AR-A1AO-01 | Breast | breast invasive carcinoma | Female | <65 | I/II | Chemotherapy | doxorubicin | SD |
| HID1 | SNV | Missense_Mutation | rs747017591 | c.734C>T | p.Ala245Val | p.A245V | Q8IV36 | protein_coding | tolerated(0.25) | benign(0.26) | TCGA-B6-A0IE-01 | Breast | breast invasive carcinoma | Female | <65 | III/IV | Unknown | Unknown | PD |
| HID1 | SNV | Missense_Mutation | novel | c.185N>T | p.Ser62Leu | p.S62L | Q8IV36 | protein_coding | tolerated(0.16) | benign(0.209) | TCGA-BH-A0B6-01 | Breast | breast invasive carcinoma | Female | <65 | I/II | Unknown | Unknown | SD |
| HID1 | SNV | Missense_Mutation | c.1633G>C | p.Asp545His | p.D545H | Q8IV36 | protein_coding | deleterious(0) | possibly_damaging(0.807) | TCGA-C8-A1HI-01 | Breast | breast invasive carcinoma | Female | <65 | III/IV | Unknown | Unknown | SD | |
| HID1 | SNV | Missense_Mutation | c.1562N>T | p.Ser521Phe | p.S521F | Q8IV36 | protein_coding | deleterious(0) | probably_damaging(0.992) | TCGA-D8-A27N-01 | Breast | breast invasive carcinoma | Female | <65 | III/IV | Chemotherapy | taxol+adriamycin+cyclophosphamide+herceptin | SD | |
| HID1 | SNV | Missense_Mutation | rs145666436 | c.2173N>T | p.Arg725Trp | p.R725W | Q8IV36 | protein_coding | deleterious(0) | possibly_damaging(0.817) | TCGA-E9-A226-01 | Breast | breast invasive carcinoma | Female | <65 | III/IV | Hormone Therapy | tamoxiphen | PD |
| HID1 | insertion | Nonsense_Mutation | novel | c.617_618insATTTTAAAATTAAAAAAAGTTAAAAAGTAAAATTGGGCCAGGCGCG | p.Leu207PhefsTer2 | p.L207Ffs*2 | Q8IV36 | protein_coding | TCGA-AN-A0FX-01 | Breast | breast invasive carcinoma | Female | <65 | I/II | Unknown | Unknown | SD | ||
| HID1 | SNV | Missense_Mutation | rs777264298 | c.649N>A | p.Glu217Lys | p.E217K | Q8IV36 | protein_coding | tolerated(0.09) | possibly_damaging(0.529) | TCGA-A6-6781-01 | Colorectum | colon adenocarcinoma | Male | <65 | III/IV | Chemotherapy | oxaliplatin | SD |
| HID1 | SNV | Missense_Mutation | novel | c.1874N>C | p.Lys625Thr | p.K625T | Q8IV36 | protein_coding | tolerated(0.25) | benign(0.098) | TCGA-AA-3984-01 | Colorectum | colon adenocarcinoma | Female | <65 | I/II | Unknown | Unknown | SD |
| Page: 1 2 3 4 5 6 7 8 |
Top |
Related drugs of malignant transformation related genes |
| Identification of chemicals and drugs interact with genes involved in malignant transfromation |
| (DGIdb 4.0) |
| Entrez ID | Symbol | Category | Interaction Types | Drug Claim Name | Drug Name | PMIDs |
| Page: 1 |

Copyright 2023-Present -The University of Texas Health Science Center at Houston |