
|
|||||
|
 | |
| |
| |
| |
| |
| |
|
Gene: HIC2 |
Gene summary for HIC2 |
| Gene information | Species | Human | Gene symbol | HIC2 | Gene ID | 23119 |
| Gene name | HIC ZBTB transcriptional repressor 2 | |
| Gene Alias | HRG22 | |
| Cytomap | 22q11.21 | |
| Gene Type | protein-coding | GO ID | GO:0000122 | UniProtAcc | Q96JB3 |
Top |
Malignant transformation analysis |
| Identification of the aberrant gene expression in precancerous and cancerous lesions by comparing the gene expression of stem-like cells in diseased tissues with normal stem cells |
| Entrez ID | Symbol | Replicates | Species | Organ | Tissue | Adj P-value | Log2FC | Malignancy |
| 23119 | HIC2 | LZE7T | Human | Esophagus | ESCC | 2.48e-05 | 3.58e-01 | 0.0667 |
| 23119 | HIC2 | LZE24T | Human | Esophagus | ESCC | 3.07e-05 | 1.08e-01 | 0.0596 |
| 23119 | HIC2 | P1T-E | Human | Esophagus | ESCC | 3.06e-03 | 3.24e-01 | 0.0875 |
| 23119 | HIC2 | P2T-E | Human | Esophagus | ESCC | 2.65e-17 | 1.04e-01 | 0.1177 |
| 23119 | HIC2 | P4T-E | Human | Esophagus | ESCC | 4.00e-12 | 2.98e-01 | 0.1323 |
| 23119 | HIC2 | P5T-E | Human | Esophagus | ESCC | 4.12e-02 | 5.54e-02 | 0.1327 |
| 23119 | HIC2 | P8T-E | Human | Esophagus | ESCC | 5.47e-04 | 6.91e-02 | 0.0889 |
| 23119 | HIC2 | P9T-E | Human | Esophagus | ESCC | 4.72e-04 | 1.93e-01 | 0.1131 |
| 23119 | HIC2 | P10T-E | Human | Esophagus | ESCC | 5.48e-11 | 2.16e-01 | 0.116 |
| 23119 | HIC2 | P11T-E | Human | Esophagus | ESCC | 4.31e-03 | 2.10e-01 | 0.1426 |
| 23119 | HIC2 | P12T-E | Human | Esophagus | ESCC | 7.38e-10 | 2.32e-01 | 0.1122 |
| 23119 | HIC2 | P15T-E | Human | Esophagus | ESCC | 1.65e-03 | 6.95e-02 | 0.1149 |
| 23119 | HIC2 | P16T-E | Human | Esophagus | ESCC | 6.25e-10 | 1.40e-01 | 0.1153 |
| 23119 | HIC2 | P21T-E | Human | Esophagus | ESCC | 2.05e-09 | 3.53e-01 | 0.1617 |
| 23119 | HIC2 | P22T-E | Human | Esophagus | ESCC | 3.76e-04 | 8.21e-02 | 0.1236 |
| 23119 | HIC2 | P23T-E | Human | Esophagus | ESCC | 2.08e-06 | 2.35e-01 | 0.108 |
| 23119 | HIC2 | P24T-E | Human | Esophagus | ESCC | 3.97e-05 | 5.76e-02 | 0.1287 |
| 23119 | HIC2 | P26T-E | Human | Esophagus | ESCC | 4.75e-24 | 3.66e-01 | 0.1276 |
| 23119 | HIC2 | P27T-E | Human | Esophagus | ESCC | 7.79e-08 | 1.99e-01 | 0.1055 |
| 23119 | HIC2 | P28T-E | Human | Esophagus | ESCC | 1.79e-23 | 6.08e-01 | 0.1149 |
| Page: 1 2 3 |
| Tissue | Expression Dynamics | Abbreviation |
| Esophagus | 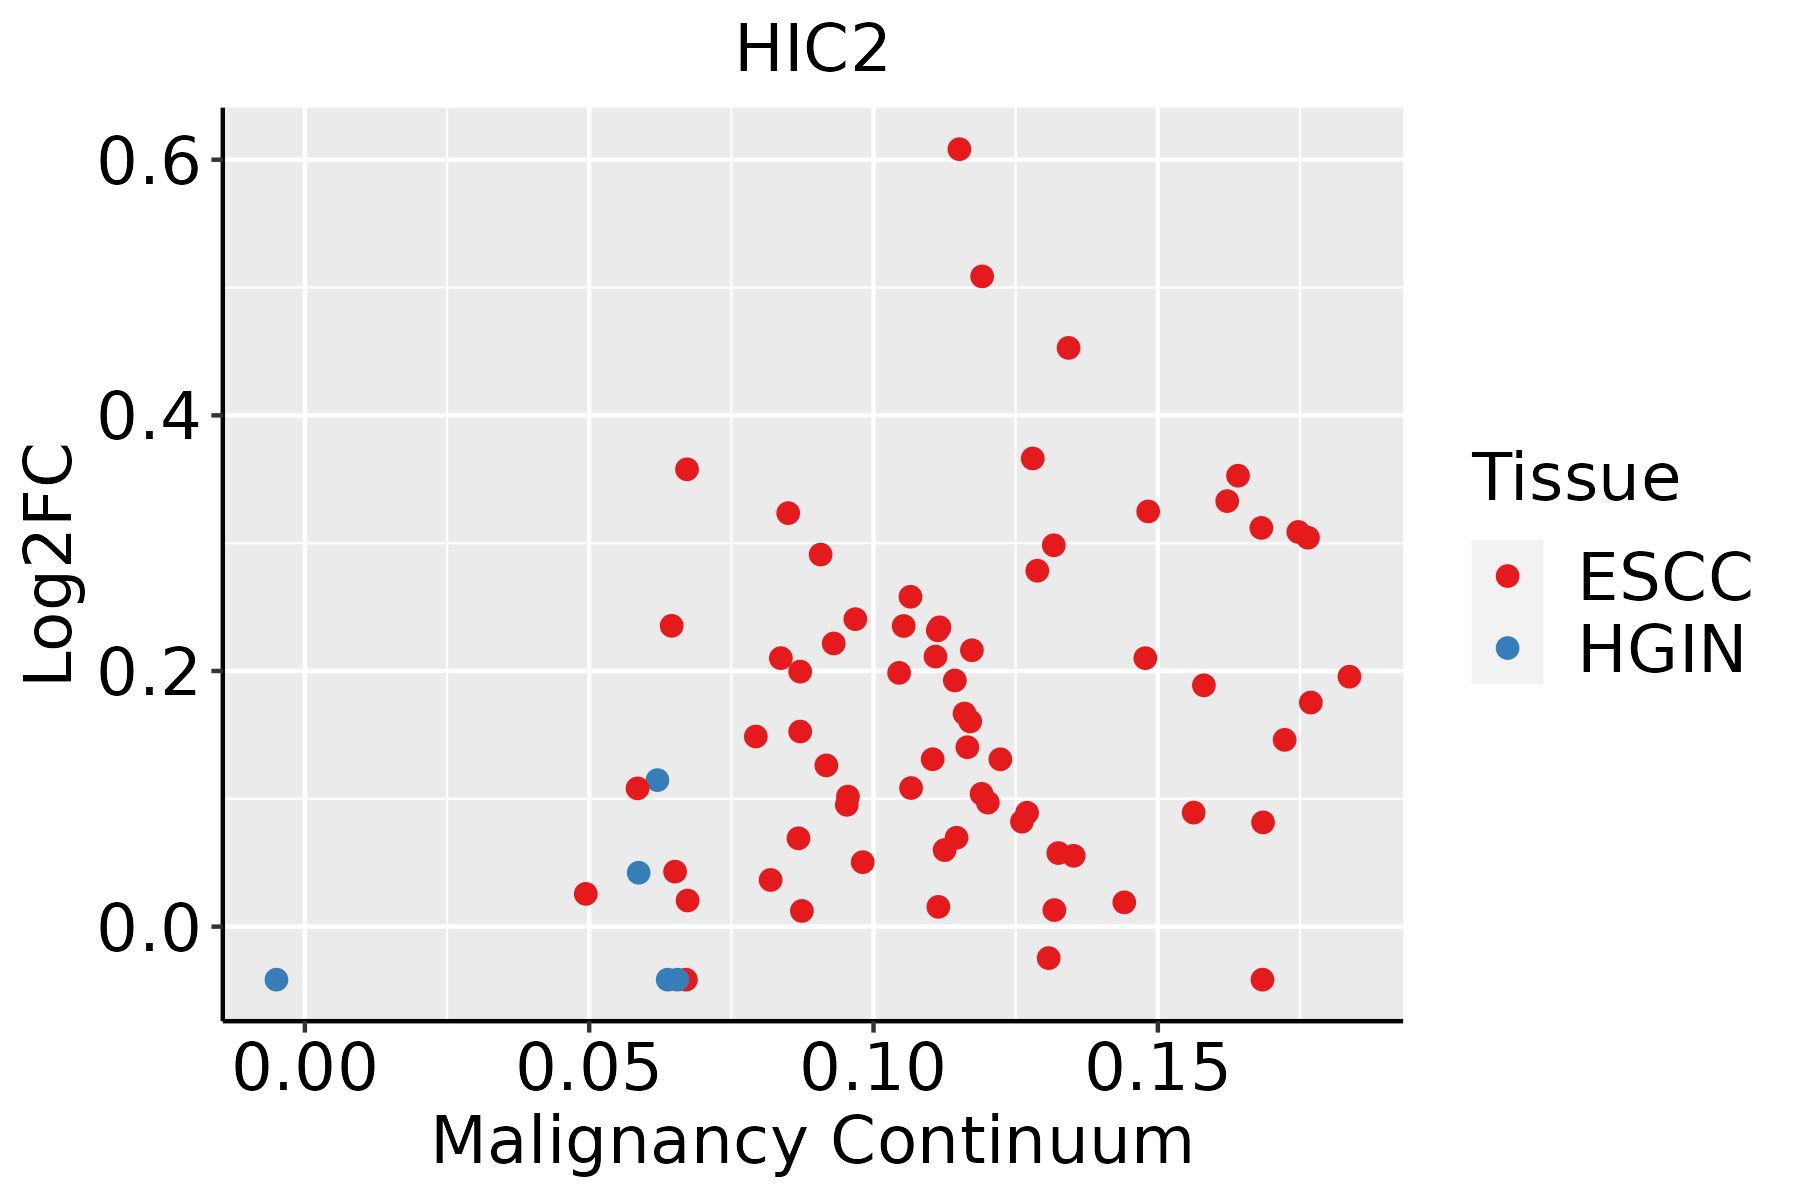 | ESCC: Esophageal squamous cell carcinoma |
| HGIN: High-grade intraepithelial neoplasias | ||
| LGIN: Low-grade intraepithelial neoplasias |
| ∗log2FC in expression of this searched gene in stem-like cells from each diseased tissue sample relative to stem-like cells in normal samples in each tissue plotted against the malignancy continuum. Samples are colored based on if they are from different disease stage. |
Top |
Malignant transformation related pathway analysis |
| Find out the enriched GO biological processes and KEGG pathways involved in transition from healthy to precancer to cancer |
| Tissue | Disease Stage | Enriched GO biological Processes |
| Colorectum | AD |  |
| Colorectum | SER |  |
| Colorectum | MSS |  |
| Colorectum | MSI-H |  |
| Colorectum | FAP |  |
| ∗Top 15 enriched GO BP terms are showed in the bar plot of each disease state in each tissue. Each row represents a significant GO biological process which is colored according to the -log10(p.adjust). |
| Page: 1 2 3 4 5 6 7 8 9 |
| GO ID | Tissue | Disease Stage | Description | Gene Ratio | Bg Ratio | pvalue | p.adjust | Count |
| Page: 1 |
| Pathway ID | Tissue | Disease Stage | Description | Gene Ratio | Bg Ratio | pvalue | p.adjust | qvalue | Count |
| Page: 1 |
Top |
Cell-cell communication analysis |
| Identification of potential cell-cell interactions between two cell types and their ligand-receptor pairs for different disease states |
| Ligand | Receptor | LRpair | Pathway | Tissue | Disease Stage |
| Page: 1 |
Top |
Single-cell gene regulatory network inference analysis |
| Find out the significant the regulons (TFs) and the target genes of each regulon across cell types for different disease states |
| TF | Cell Type | Tissue | Disease Stage | Target Gene | RSS | Regulon Activity |
| HIC2 | MSC.MVA | Oral cavity | Healthy | CSF3,TSPAN15,RRP12, etc. | 1.54e-02 |  |
| HIC2 | PVA | Oral cavity | NEOLP | CSF3,TSPAN15,RRP12, etc. | 1.72e-02 |  |
| HIC2 | CD8TCM | Pancreas | ADJ | MCOLN2,RHEBL1,ITGA6, etc. | 0.00e+00 |  |
| HIC2 | TREG | Pancreas | ADJ | MCOLN2,RHEBL1,ITGA6, etc. | 0.00e+00 | |
| HIC2 | PLA | Pancreas | ADJ | MCOLN2,RHEBL1,ITGA6, etc. | 5.01e-03 | |
| HIC2 | CD8TRM | Pancreas | Healthy | MCOLN2,RHEBL1,ITGA6, etc. | 2.15e-02 |  |
| HIC2 | CD8TEREX | Pancreas | PanIN | MCOLN2,RHEBL1,ITGA6, etc. | 3.82e-02 |  |
| HIC2 | CD8TEXP | Pancreas | PDAC | MCOLN2,RHEBL1,ITGA6, etc. | 2.89e-04 |  |
| HIC2 | M1MAC | Pancreas | PDAC | MCOLN2,RHEBL1,ITGA6, etc. | 5.33e-02 | |
| HIC2 | PLA | Pancreas | PDAC | MCOLN2,RHEBL1,ITGA6, etc. | 8.57e-04 | |
| ∗The dot plots of a searched regulon are shown for all cell subpopulations in each disease state of each tissue based on the regulon specific score inferred using pySCENIC and by calculating the average expression. |
| Page: 1 2 |
Top |
Somatic mutation of malignant transformation related genes |
| Annotation of somatic variants for genes involved in malignant transformation |
| Hugo Symbol | Variant Class | Variant Classification | dbSNP RS | HGVSc | HGVSp | HGVSp Short | SWISSPROT | BIOTYPE | SIFT | PolyPhen | Tumor Sample Barcode | Tissue | Histology | Sex | Age | Stage | Therapy Types | Drugs | Outcome |
| HIC2 | SNV | Missense_Mutation | novel | c.1805N>C | p.Arg602Pro | p.R602P | Q96JB3 | protein_coding | deleterious(0) | possibly_damaging(0.831) | TCGA-A2-A3XU-01 | Breast | breast invasive carcinoma | Female | <65 | I/II | Hormone Therapy | arimidex | PD |
| HIC2 | SNV | Missense_Mutation | novel | c.1706G>A | p.Arg569His | p.R569H | Q96JB3 | protein_coding | deleterious(0) | probably_damaging(0.91) | TCGA-AN-A0AK-01 | Breast | breast invasive carcinoma | Female | >=65 | I/II | Unknown | Unknown | SD |
| HIC2 | SNV | Missense_Mutation | rs561071418 | c.808G>A | p.Ala270Thr | p.A270T | Q96JB3 | protein_coding | tolerated(0.6) | benign(0) | TCGA-A6-6653-01 | Colorectum | colon adenocarcinoma | Male | >=65 | I/II | Unknown | Unknown | SD |
| HIC2 | SNV | Missense_Mutation | c.1742G>A | p.Arg581His | p.R581H | Q96JB3 | protein_coding | deleterious(0) | probably_damaging(0.95) | TCGA-AA-3715-01 | Colorectum | colon adenocarcinoma | Male | >=65 | I/II | Unknown | Unknown | PD | |
| HIC2 | SNV | Missense_Mutation | rs371166847 | c.545N>A | p.Arg182His | p.R182H | Q96JB3 | protein_coding | tolerated(0.26) | benign(0.003) | TCGA-AA-3811-01 | Colorectum | colon adenocarcinoma | Female | >=65 | III/IV | Unknown | Unknown | PD |
| HIC2 | SNV | Missense_Mutation | novel | c.899N>A | p.Gly300Asp | p.G300D | Q96JB3 | protein_coding | tolerated(0.18) | benign(0.028) | TCGA-AA-3947-01 | Colorectum | colon adenocarcinoma | Female | <65 | I/II | Unknown | Unknown | SD |
| HIC2 | SNV | Missense_Mutation | novel | c.1769N>G | p.Glu590Gly | p.E590G | Q96JB3 | protein_coding | deleterious(0) | benign(0.396) | TCGA-AA-A010-01 | Colorectum | colon adenocarcinoma | Female | <65 | I/II | Chemotherapy | folinic | CR |
| HIC2 | SNV | Missense_Mutation | rs764207081 | c.47G>A | p.Arg16His | p.R16H | Q96JB3 | protein_coding | tolerated_low_confidence(0.24) | benign(0.001) | TCGA-AM-5821-01 | Colorectum | colon adenocarcinoma | Female | >=65 | I/II | Unknown | Unknown | SD |
| HIC2 | SNV | Missense_Mutation | rs200393389 | c.1783N>A | p.Gly595Arg | p.G595R | Q96JB3 | protein_coding | deleterious(0) | probably_damaging(1) | TCGA-AZ-6601-01 | Colorectum | colon adenocarcinoma | Male | >=65 | I/II | Unknown | Unknown | PD |
| HIC2 | SNV | Missense_Mutation | c.1657N>T | p.Arg553Trp | p.R553W | Q96JB3 | protein_coding | deleterious(0) | probably_damaging(0.91) | TCGA-CK-4951-01 | Colorectum | colon adenocarcinoma | Female | >=65 | I/II | Unknown | Unknown | PD |
| Page: 1 2 3 4 5 6 7 |
Top |
Related drugs of malignant transformation related genes |
| Identification of chemicals and drugs interact with genes involved in malignant transfromation |
| (DGIdb 4.0) |
| Entrez ID | Symbol | Category | Interaction Types | Drug Claim Name | Drug Name | PMIDs |
| Page: 1 |

Copyright 2023-Present -The University of Texas Health Science Center at Houston |