
|
|||||
|
 | |
| |
| |
| |
| |
| |
|
Gene: HIC1 |
Gene summary for HIC1 |
| Gene information | Species | Human | Gene symbol | HIC1 | Gene ID | 3090 |
| Gene name | HIC ZBTB transcriptional repressor 1 | |
| Gene Alias | ZBTB29 | |
| Cytomap | 17p13.3 | |
| Gene Type | protein-coding | GO ID | GO:0000122 | UniProtAcc | Q14526 |
Top |
Malignant transformation analysis |
| Identification of the aberrant gene expression in precancerous and cancerous lesions by comparing the gene expression of stem-like cells in diseased tissues with normal stem cells |
| Entrez ID | Symbol | Replicates | Species | Organ | Tissue | Adj P-value | Log2FC | Malignancy |
| 3090 | HIC1 | ATC12 | Human | Thyroid | ATC | 1.65e-23 | 4.93e-01 | 0.34 |
| 3090 | HIC1 | ATC13 | Human | Thyroid | ATC | 3.31e-66 | 1.28e+00 | 0.34 |
| 3090 | HIC1 | ATC4 | Human | Thyroid | ATC | 4.64e-31 | 6.56e-01 | 0.34 |
| 3090 | HIC1 | ATC5 | Human | Thyroid | ATC | 1.45e-70 | 1.36e+00 | 0.34 |
| Page: 1 |
| Tissue | Expression Dynamics | Abbreviation |
| Thyroid | 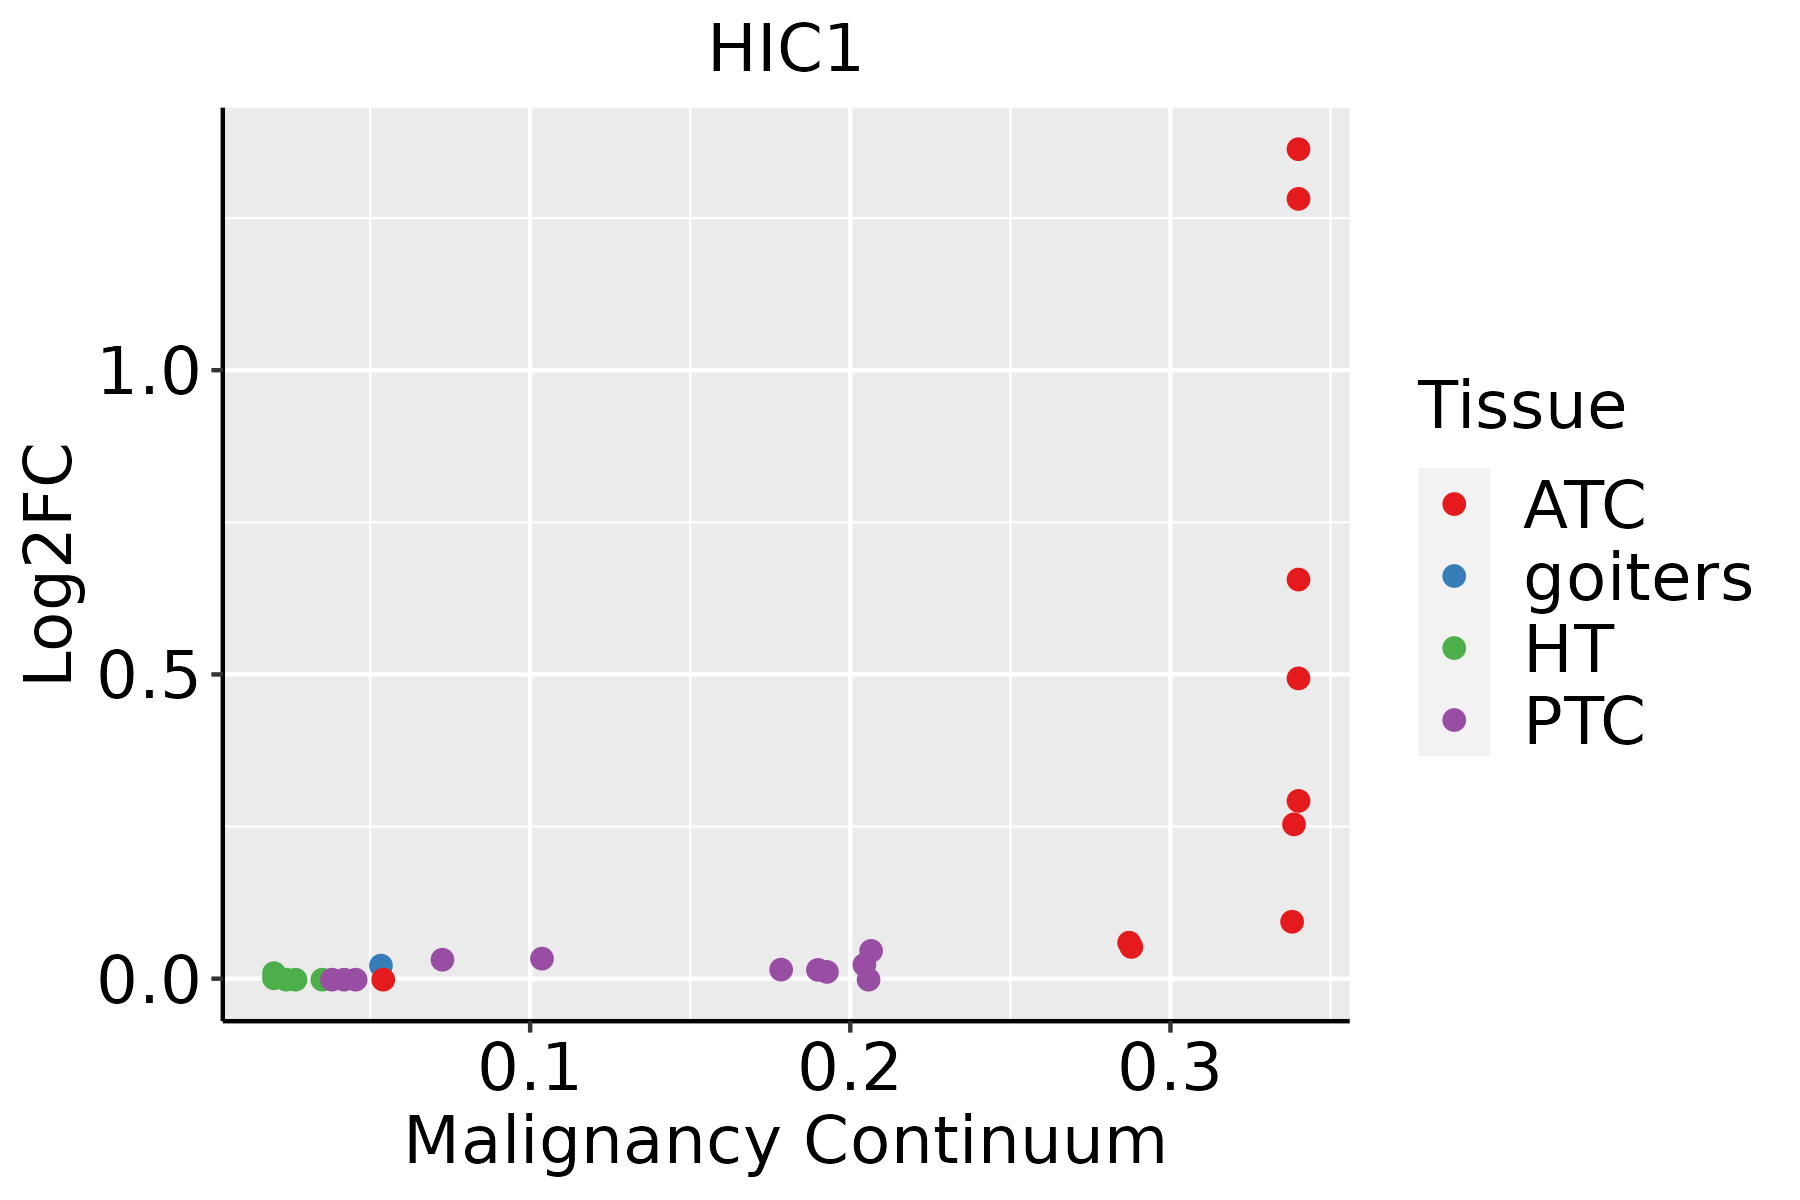 | ATC: Anaplastic thyroid cancer |
| HT: Hashimoto's thyroiditis | ||
| PTC: Papillary thyroid cancer |
| ∗log2FC in expression of this searched gene in stem-like cells from each diseased tissue sample relative to stem-like cells in normal samples in each tissue plotted against the malignancy continuum. Samples are colored based on if they are from different disease stage. |
Top |
Malignant transformation related pathway analysis |
| Find out the enriched GO biological processes and KEGG pathways involved in transition from healthy to precancer to cancer |
| Tissue | Disease Stage | Enriched GO biological Processes |
| Colorectum | AD |  |
| Colorectum | SER |  |
| Colorectum | MSS |  |
| Colorectum | MSI-H |  |
| Colorectum | FAP |  |
| ∗Top 15 enriched GO BP terms are showed in the bar plot of each disease state in each tissue. Each row represents a significant GO biological process which is colored according to the -log10(p.adjust). |
| Page: 1 2 3 4 5 6 7 8 9 |
| GO ID | Tissue | Disease Stage | Description | Gene Ratio | Bg Ratio | pvalue | p.adjust | Count |
| GO:009719335 | Thyroid | ATC | intrinsic apoptotic signaling pathway | 171/6293 | 288/18723 | 1.86e-19 | 2.67e-17 | 171 |
| GO:001605525 | Thyroid | ATC | Wnt signaling pathway | 234/6293 | 444/18723 | 4.64e-17 | 4.31e-15 | 234 |
| GO:019873825 | Thyroid | ATC | cell-cell signaling by wnt | 234/6293 | 446/18723 | 9.26e-17 | 8.25e-15 | 234 |
| GO:003011125 | Thyroid | ATC | regulation of Wnt signaling pathway | 177/6293 | 328/18723 | 1.83e-14 | 1.05e-12 | 177 |
| GO:007233135 | Thyroid | ATC | signal transduction by p53 class mediator | 102/6293 | 163/18723 | 3.16e-14 | 1.75e-12 | 102 |
| GO:190179635 | Thyroid | ATC | regulation of signal transduction by p53 class mediator | 66/6293 | 93/18723 | 1.86e-13 | 9.20e-12 | 66 |
| GO:200102026 | Thyroid | ATC | regulation of response to DNA damage stimulus | 121/6293 | 219/18723 | 3.22e-11 | 1.08e-09 | 121 |
| GO:004277016 | Thyroid | ATC | signal transduction in response to DNA damage | 90/6293 | 172/18723 | 3.01e-07 | 4.52e-06 | 90 |
| GO:190179834 | Thyroid | ATC | positive regulation of signal transduction by p53 class mediator | 21/6293 | 25/18723 | 3.02e-07 | 4.52e-06 | 21 |
| GO:003033033 | Thyroid | ATC | DNA damage response, signal transduction by p53 class mediator | 45/6293 | 72/18723 | 4.87e-07 | 7.03e-06 | 45 |
| GO:200102214 | Thyroid | ATC | positive regulation of response to DNA damage stimulus | 59/6293 | 105/18723 | 1.62e-06 | 1.97e-05 | 59 |
| GO:000863026 | Thyroid | ATC | intrinsic apoptotic signaling pathway in response to DNA damage | 56/6293 | 99/18723 | 2.22e-06 | 2.63e-05 | 56 |
| GO:003017815 | Thyroid | ATC | negative regulation of Wnt signaling pathway | 85/6293 | 170/18723 | 6.94e-06 | 7.16e-05 | 85 |
| GO:004351631 | Thyroid | ATC | regulation of DNA damage response, signal transduction by p53 class mediator | 24/6293 | 34/18723 | 1.15e-05 | 1.12e-04 | 24 |
| GO:00435171 | Thyroid | ATC | positive regulation of DNA damage response, signal transduction by p53 class mediator | 11/6293 | 14/18723 | 7.46e-04 | 4.14e-03 | 11 |
| Page: 1 |
| Pathway ID | Tissue | Disease Stage | Description | Gene Ratio | Bg Ratio | pvalue | p.adjust | qvalue | Count |
| Page: 1 |
Top |
Cell-cell communication analysis |
| Identification of potential cell-cell interactions between two cell types and their ligand-receptor pairs for different disease states |
| Ligand | Receptor | LRpair | Pathway | Tissue | Disease Stage |
| Page: 1 |
Top |
Single-cell gene regulatory network inference analysis |
| Find out the significant the regulons (TFs) and the target genes of each regulon across cell types for different disease states |
| TF | Cell Type | Tissue | Disease Stage | Target Gene | RSS | Regulon Activity |
| HIC1 | CD8TEREX | Breast | ADJ | XCL2,TMIGD2,CD160, etc. | 2.14e-02 |  |
| HIC1 | CD8TRM | Breast | ADJ | XCL2,TMIGD2,CD160, etc. | 3.80e-02 | |
| HIC1 | CD8TEXP | Breast | ADJ | XCL2,TMIGD2,CD160, etc. | 9.41e-02 | |
| HIC1 | CD8TEXP | Breast | DCIS | XCL2,TMIGD2,CD160, etc. | 5.78e-02 |  |
| HIC1 | CD8TEREX | Breast | DCIS | XCL2,TMIGD2,CD160, etc. | 2.63e-01 | |
| HIC1 | CD8TCM | Breast | DCIS | XCL2,TMIGD2,CD160, etc. | 9.84e-02 | |
| HIC1 | CD8TCM | Breast | Healthy | XCL2,TMIGD2,CD160, etc. | 1.63e-01 |  |
| HIC1 | CD8TEREX | Breast | Healthy | XCL2,TMIGD2,CD160, etc. | 1.22e-01 | |
| HIC1 | CD8TEXP | Breast | Healthy | XCL2,TMIGD2,CD160, etc. | 2.91e-02 | |
| HIC1 | GC | Breast | Healthy | XCL2,TMIGD2,CD160, etc. | 0.00e+00 | |
| ∗The dot plots of a searched regulon are shown for all cell subpopulations in each disease state of each tissue based on the regulon specific score inferred using pySCENIC and by calculating the average expression. |
| Page: 1 2 3 |
Top |
Somatic mutation of malignant transformation related genes |
| Annotation of somatic variants for genes involved in malignant transformation |
| Hugo Symbol | Variant Class | Variant Classification | dbSNP RS | HGVSc | HGVSp | HGVSp Short | SWISSPROT | BIOTYPE | SIFT | PolyPhen | Tumor Sample Barcode | Tissue | Histology | Sex | Age | Stage | Therapy Types | Drugs | Outcome |
| HIC1 | SNV | Missense_Mutation | novel | c.1691C>T | p.Ala564Val | p.A564V | Q14526 | protein_coding | deleterious(0.01) | probably_damaging(0.999) | TCGA-5M-AAT6-01 | Colorectum | colon adenocarcinoma | Female | <65 | III/IV | Unknown | Unknown | PD |
| HIC1 | SNV | Missense_Mutation | novel | c.1046N>A | p.Arg349His | p.R349H | Q14526 | protein_coding | tolerated(0.14) | benign(0.339) | TCGA-A6-5665-01 | Colorectum | colon adenocarcinoma | Female | >=65 | I/II | Unknown | Unknown | PD |
| HIC1 | SNV | Missense_Mutation | rs759366814 | c.313C>T | p.Arg105Cys | p.R105C | Q14526 | protein_coding | deleterious(0.01) | probably_damaging(0.999) | TCGA-CK-5916-01 | Colorectum | colon adenocarcinoma | Female | >=65 | I/II | Unknown | Unknown | PD |
| HIC1 | SNV | Missense_Mutation | c.1312G>A | p.Val438Met | p.V438M | Q14526 | protein_coding | deleterious(0) | probably_damaging(0.999) | TCGA-D5-6540-01 | Colorectum | colon adenocarcinoma | Male | >=65 | I/II | Unknown | Unknown | SD | |
| HIC1 | SNV | Missense_Mutation | c.199N>A | p.Ala67Thr | p.A67T | Q14526 | protein_coding | deleterious(0) | probably_damaging(0.999) | TCGA-F4-6703-01 | Colorectum | colon adenocarcinoma | Male | <65 | I/II | Unknown | Unknown | SD | |
| HIC1 | SNV | Missense_Mutation | c.1729C>T | p.Arg577Cys | p.R577C | Q14526 | protein_coding | deleterious(0) | probably_damaging(0.989) | TCGA-F4-6856-01 | Colorectum | colon adenocarcinoma | Male | <65 | I/II | Ancillary | leucovorin | CR | |
| HIC1 | SNV | Missense_Mutation | novel | c.1433G>T | p.Gly478Val | p.G478V | Q14526 | protein_coding | tolerated(0.08) | possibly_damaging(0.48) | TCGA-AJ-A23O-01 | Endometrium | uterine corpus endometrioid carcinoma | Female | >=65 | I/II | Unknown | Unknown | SD |
| HIC1 | SNV | Missense_Mutation | novel | c.1790N>A | p.Gly597Asp | p.G597D | Q14526 | protein_coding | deleterious(0) | probably_damaging(0.996) | TCGA-AP-A1DK-01 | Endometrium | uterine corpus endometrioid carcinoma | Female | <65 | I/II | Unknown | Unknown | SD |
| HIC1 | SNV | Missense_Mutation | novel | c.1664N>A | p.Arg555His | p.R555H | Q14526 | protein_coding | deleterious(0) | probably_damaging(0.999) | TCGA-EY-A1GD-01 | Endometrium | uterine corpus endometrioid carcinoma | Female | <65 | I/II | Unknown | Unknown | SD |
| HIC1 | SNV | Missense_Mutation | novel | c.1418N>T | p.Ala473Val | p.A473V | Q14526 | protein_coding | tolerated(0.07) | benign(0.055) | TCGA-EY-A5W2-01 | Endometrium | uterine corpus endometrioid carcinoma | Female | >=65 | I/II | Unknown | Unknown | SD |
| Page: 1 2 3 |
Top |
Related drugs of malignant transformation related genes |
| Identification of chemicals and drugs interact with genes involved in malignant transfromation |
| (DGIdb 4.0) |
| Entrez ID | Symbol | Category | Interaction Types | Drug Claim Name | Drug Name | PMIDs |
| Page: 1 |

Copyright 2023-Present -The University of Texas Health Science Center at Houston |