
|
|||||
|
 | |
| |
| |
| |
| |
| |
|
Gene: HIBADH |
Gene summary for HIBADH |
| Gene information | Species | Human | Gene symbol | HIBADH | Gene ID | 11112 |
| Gene name | 3-hydroxyisobutyrate dehydrogenase | |
| Gene Alias | NS5ATP1 | |
| Cytomap | 7p15.2 | |
| Gene Type | protein-coding | GO ID | GO:0006082 | UniProtAcc | A0A024RA75 |
Top |
Malignant transformation analysis |
| Identification of the aberrant gene expression in precancerous and cancerous lesions by comparing the gene expression of stem-like cells in diseased tissues with normal stem cells |
| Entrez ID | Symbol | Replicates | Species | Organ | Tissue | Adj P-value | Log2FC | Malignancy |
| 11112 | HIBADH | HTA11_3410_2000001011 | Human | Colorectum | AD | 4.63e-09 | -2.04e-01 | 0.0155 |
| 11112 | HIBADH | HTA11_866_2000001011 | Human | Colorectum | AD | 1.06e-02 | -2.83e-01 | -0.1001 |
| 11112 | HIBADH | HTA11_99999965104_69814 | Human | Colorectum | MSS | 1.99e-02 | 5.93e-01 | 0.281 |
| 11112 | HIBADH | A015-C-203 | Human | Colorectum | FAP | 1.13e-16 | -3.81e-01 | -0.1294 |
| 11112 | HIBADH | A015-C-204 | Human | Colorectum | FAP | 1.15e-05 | -2.57e-01 | -0.0228 |
| 11112 | HIBADH | A002-C-201 | Human | Colorectum | FAP | 7.36e-11 | -3.13e-01 | 0.0324 |
| 11112 | HIBADH | A002-C-203 | Human | Colorectum | FAP | 4.06e-02 | 2.45e-01 | 0.2786 |
| 11112 | HIBADH | A001-C-119 | Human | Colorectum | FAP | 2.17e-04 | -3.03e-01 | -0.1557 |
| 11112 | HIBADH | A001-C-108 | Human | Colorectum | FAP | 2.78e-08 | -2.56e-01 | -0.0272 |
| 11112 | HIBADH | A002-C-205 | Human | Colorectum | FAP | 5.82e-18 | -3.76e-01 | -0.1236 |
| 11112 | HIBADH | A015-C-006 | Human | Colorectum | FAP | 6.58e-11 | -3.89e-01 | -0.0994 |
| 11112 | HIBADH | A015-C-106 | Human | Colorectum | FAP | 4.25e-03 | -5.88e-02 | -0.0511 |
| 11112 | HIBADH | A002-C-114 | Human | Colorectum | FAP | 6.68e-18 | -4.58e-01 | -0.1561 |
| 11112 | HIBADH | A015-C-104 | Human | Colorectum | FAP | 2.13e-16 | -2.92e-01 | -0.1899 |
| 11112 | HIBADH | A001-C-014 | Human | Colorectum | FAP | 2.49e-08 | -2.88e-01 | 0.0135 |
| 11112 | HIBADH | A002-C-016 | Human | Colorectum | FAP | 2.79e-13 | -2.86e-01 | 0.0521 |
| 11112 | HIBADH | A015-C-002 | Human | Colorectum | FAP | 4.74e-10 | -4.62e-01 | -0.0763 |
| 11112 | HIBADH | A001-C-203 | Human | Colorectum | FAP | 9.35e-09 | -1.95e-01 | -0.0481 |
| 11112 | HIBADH | A002-C-116 | Human | Colorectum | FAP | 3.02e-24 | -4.57e-01 | -0.0452 |
| 11112 | HIBADH | A014-C-008 | Human | Colorectum | FAP | 1.01e-08 | -1.93e-01 | -0.191 |
| Page: 1 2 3 4 5 6 7 |
| Tissue | Expression Dynamics | Abbreviation |
| Colorectum (GSE201348) |  | FAP: Familial adenomatous polyposis |
| CRC: Colorectal cancer | ||
| Colorectum (HTA11) |  | AD: Adenomas |
| SER: Sessile serrated lesions | ||
| MSI-H: Microsatellite-high colorectal cancer | ||
| MSS: Microsatellite stable colorectal cancer | ||
| Esophagus | 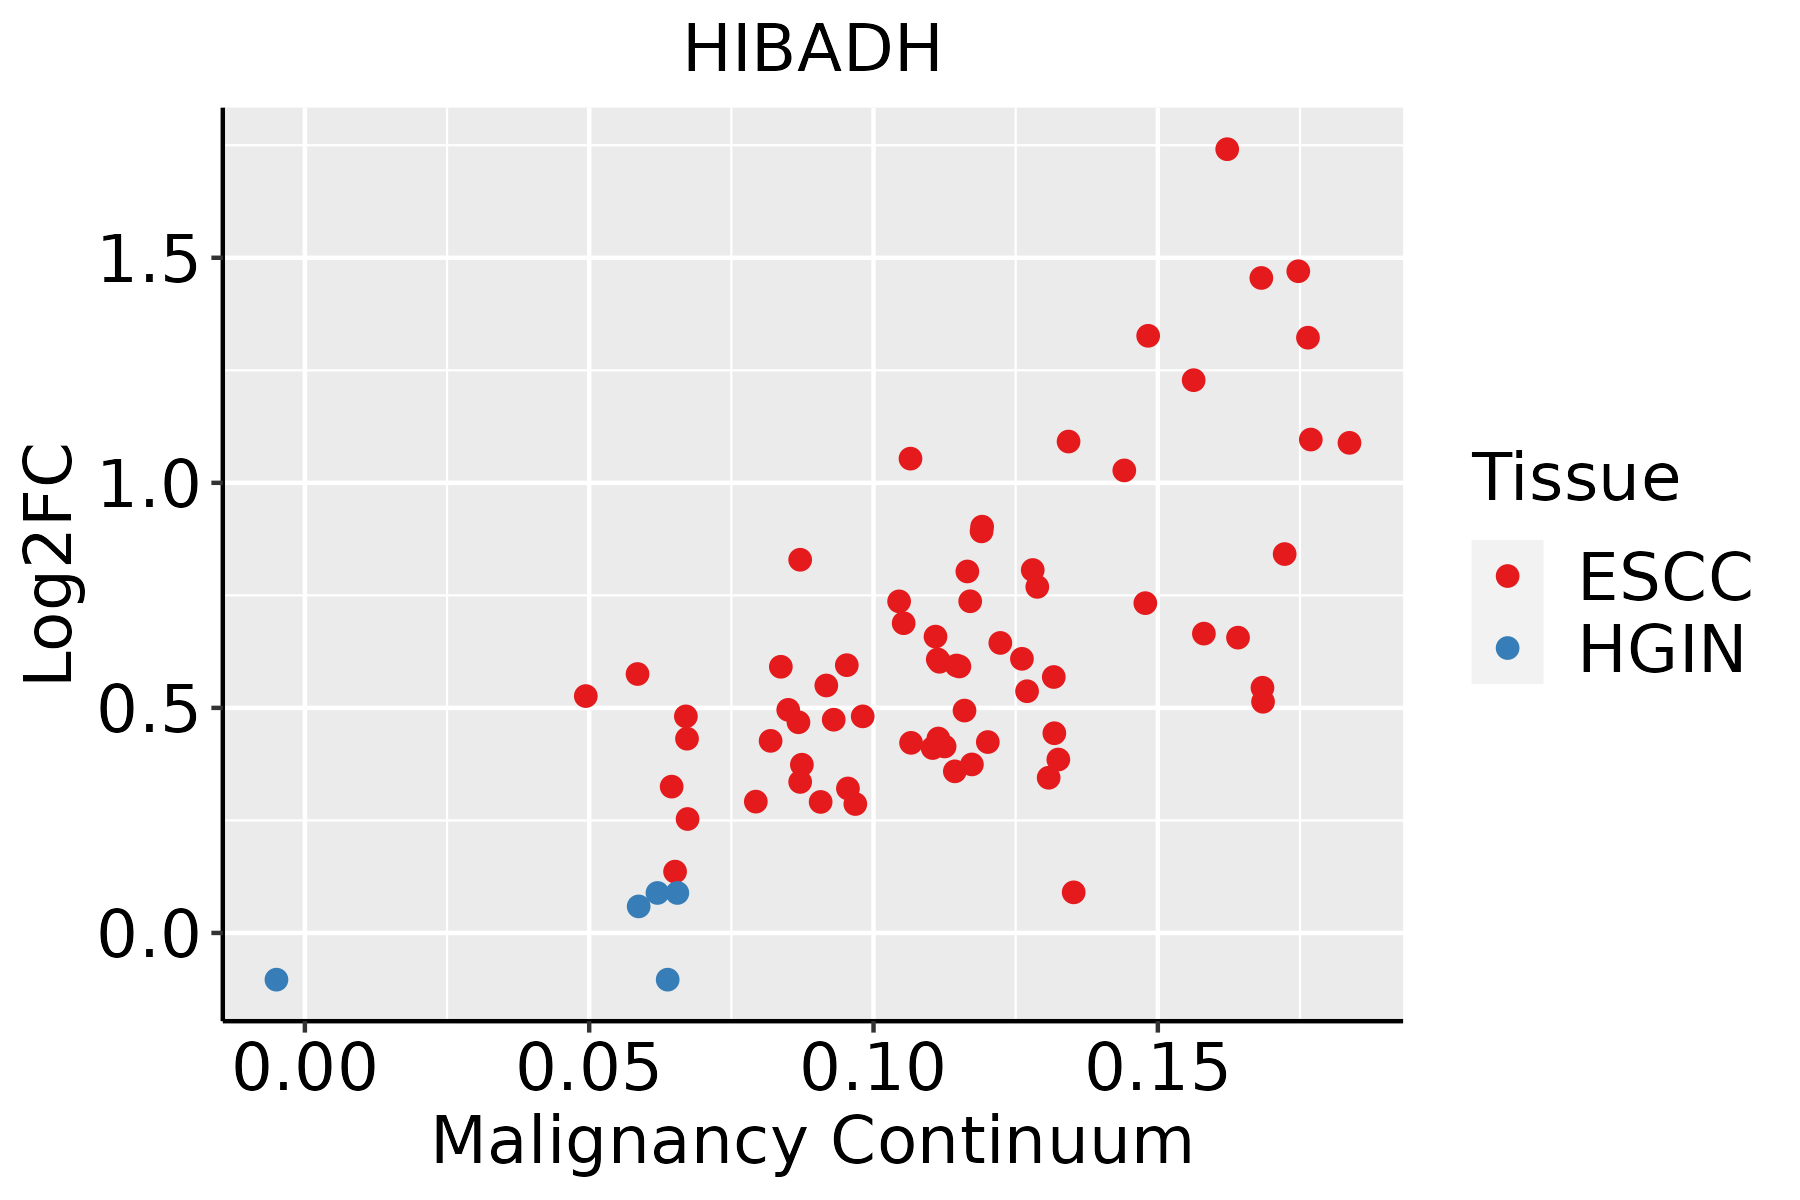 | ESCC: Esophageal squamous cell carcinoma |
| HGIN: High-grade intraepithelial neoplasias | ||
| LGIN: Low-grade intraepithelial neoplasias | ||
| Liver | 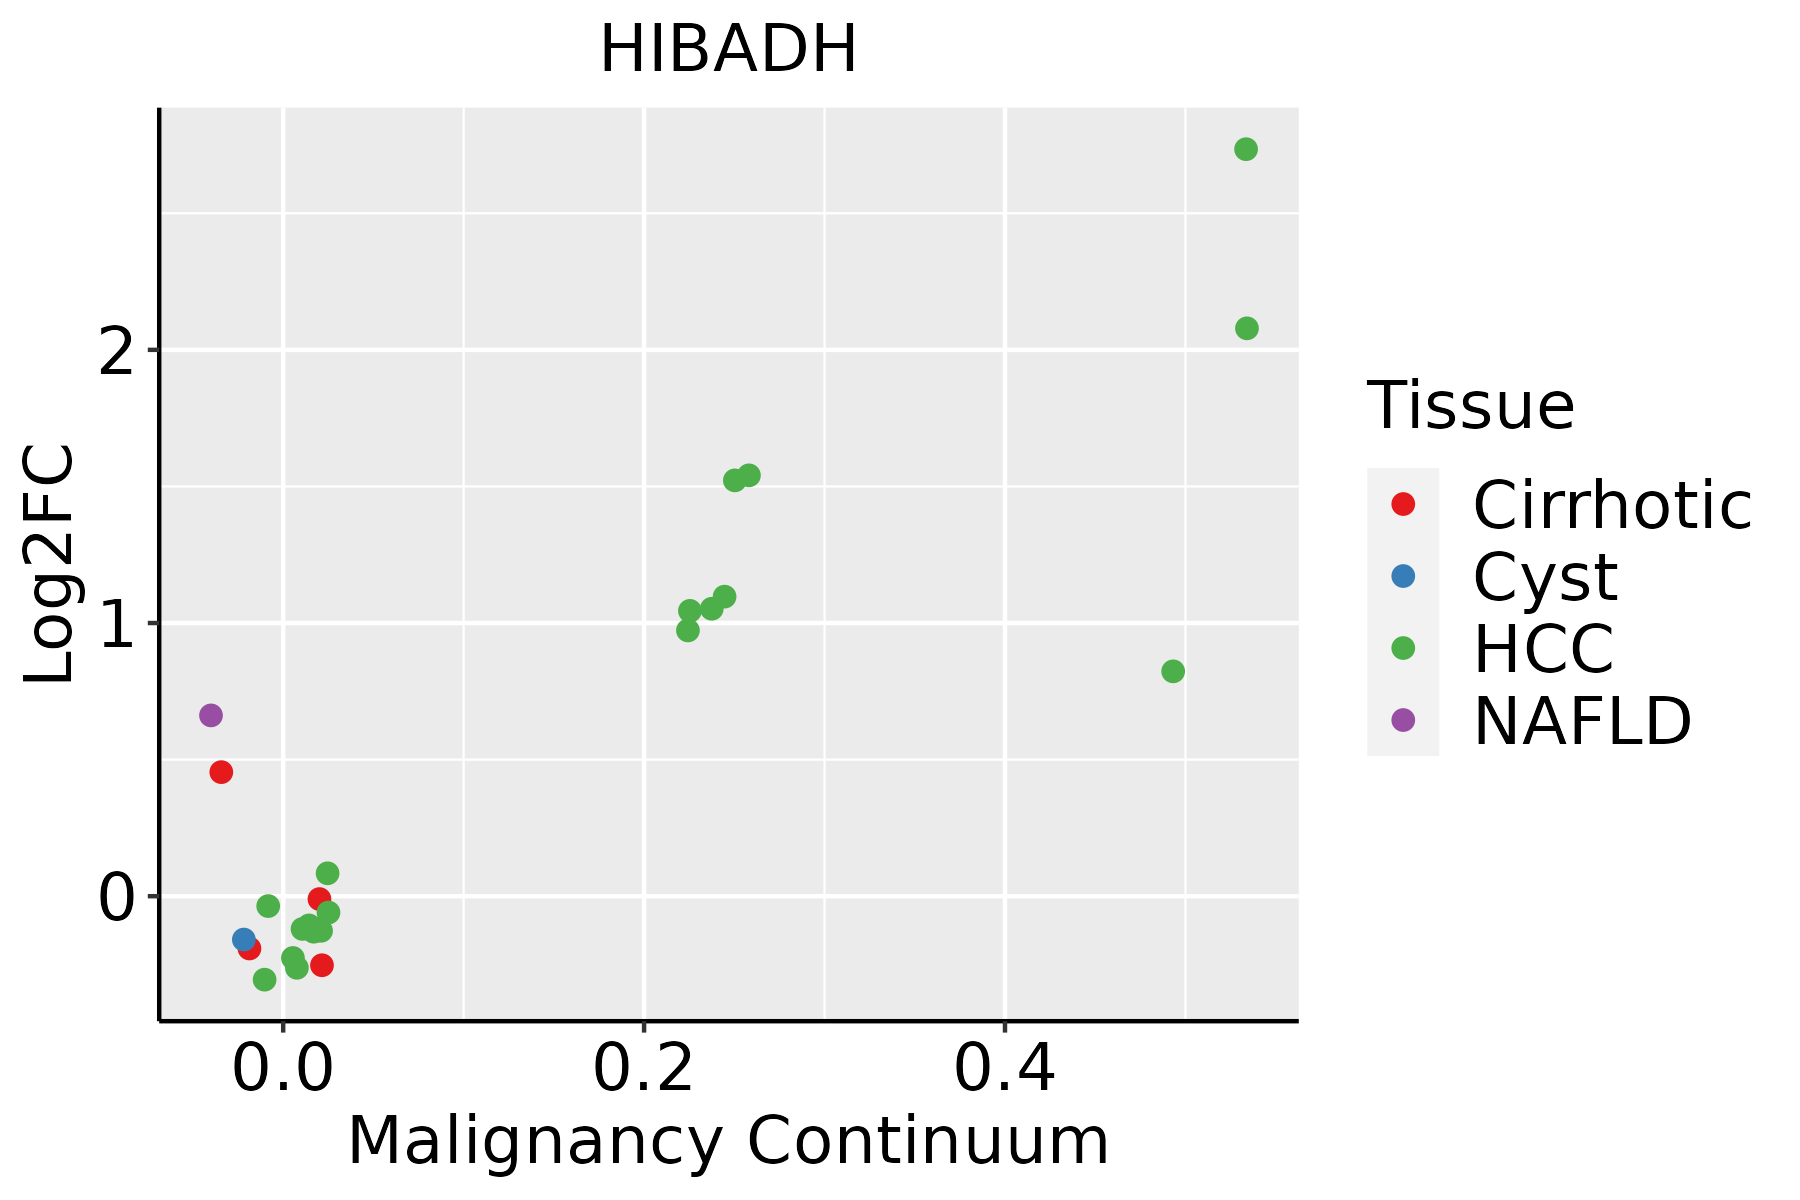 | HCC: Hepatocellular carcinoma |
| NAFLD: Non-alcoholic fatty liver disease | ||
| Oral Cavity |  | EOLP: Erosive Oral lichen planus |
| LP: leukoplakia | ||
| NEOLP: Non-erosive oral lichen planus | ||
| OSCC: Oral squamous cell carcinoma | ||
| Thyroid | 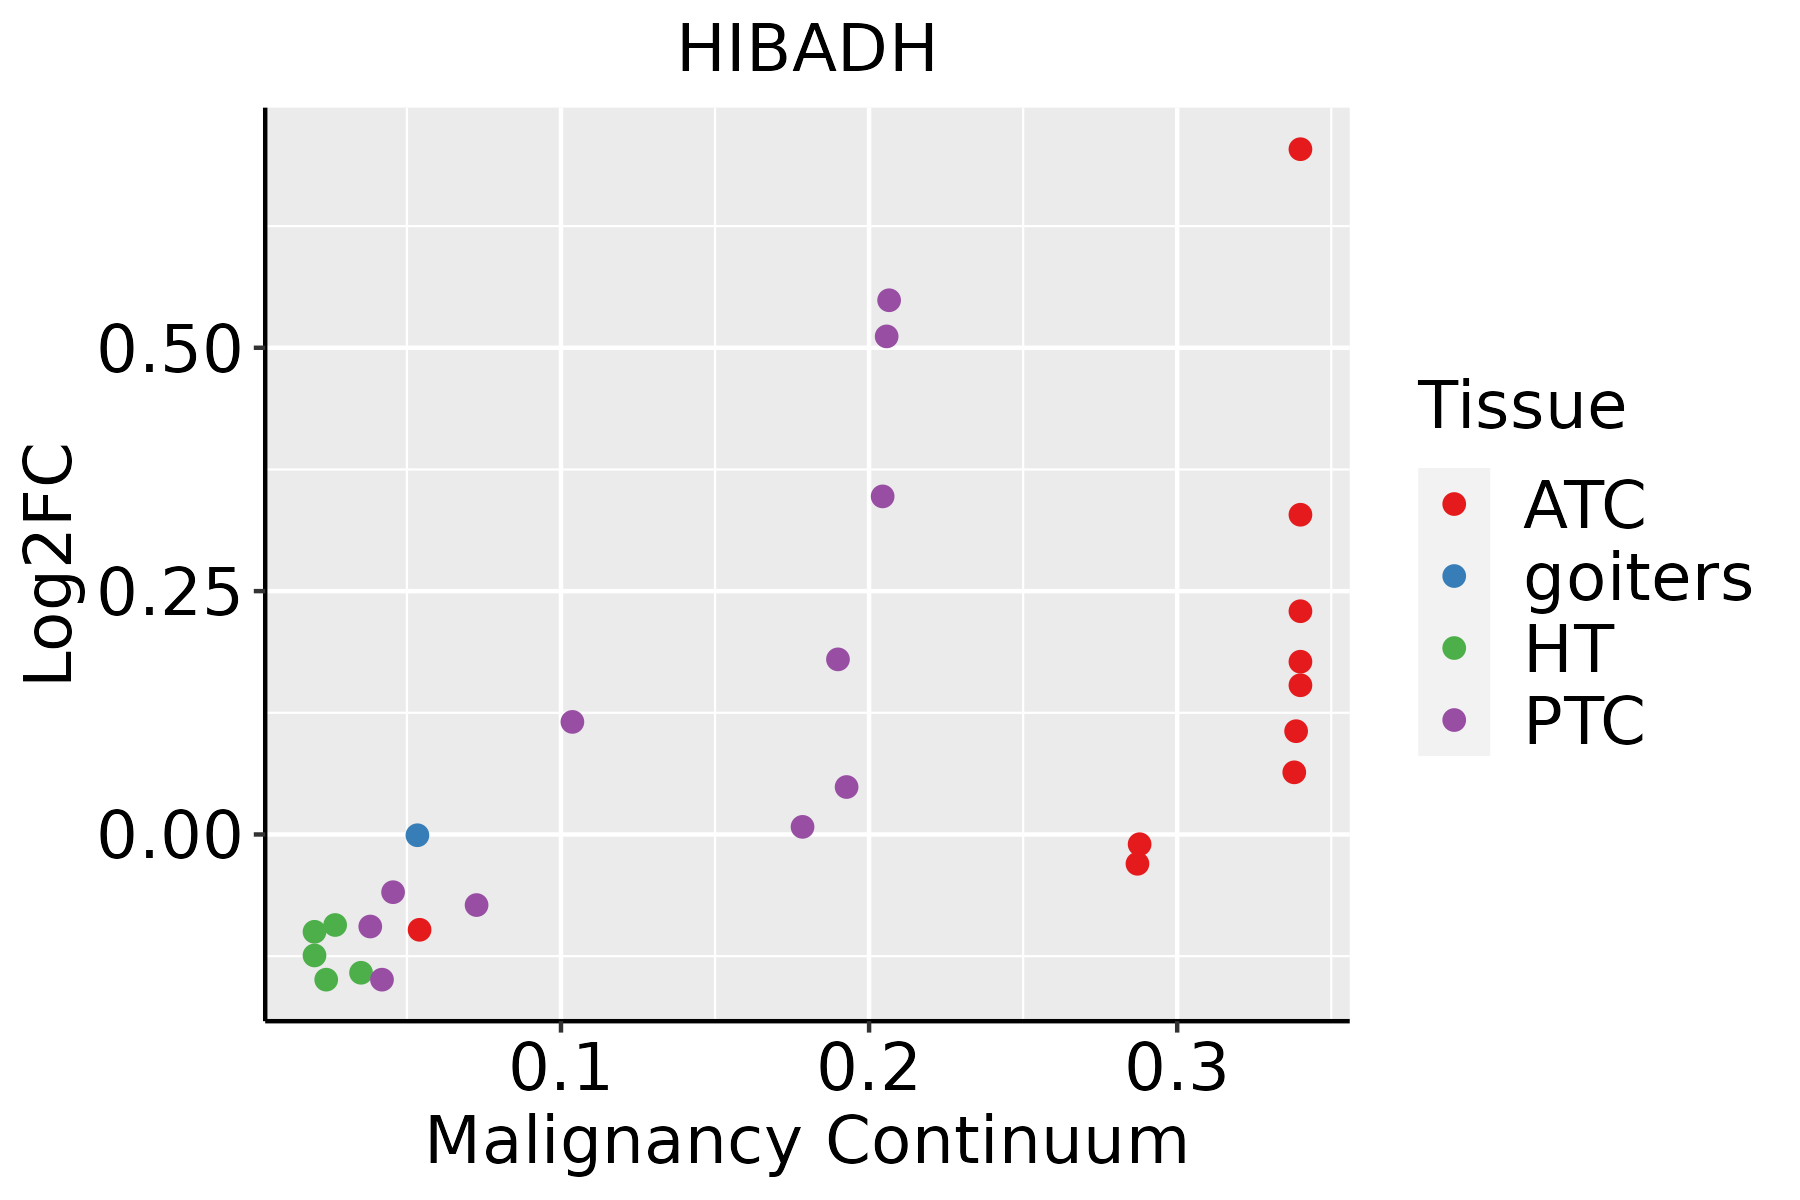 | ATC: Anaplastic thyroid cancer |
| HT: Hashimoto's thyroiditis | ||
| PTC: Papillary thyroid cancer |
| ∗log2FC in expression of this searched gene in stem-like cells from each diseased tissue sample relative to stem-like cells in normal samples in each tissue plotted against the malignancy continuum. Samples are colored based on if they are from different disease stage. |
Top |
Malignant transformation related pathway analysis |
| Find out the enriched GO biological processes and KEGG pathways involved in transition from healthy to precancer to cancer |
| Tissue | Disease Stage | Enriched GO biological Processes |
| Colorectum | AD |  |
| Colorectum | SER |  |
| Colorectum | MSS |  |
| Colorectum | MSI-H |  |
| Colorectum | FAP |  |
| ∗Top 15 enriched GO BP terms are showed in the bar plot of each disease state in each tissue. Each row represents a significant GO biological process which is colored according to the -log10(p.adjust). |
| Page: 1 2 3 4 5 6 7 8 9 |
| GO ID | Tissue | Disease Stage | Description | Gene Ratio | Bg Ratio | pvalue | p.adjust | Count |
| GO:0044282 | Colorectum | AD | small molecule catabolic process | 118/3918 | 376/18723 | 1.05e-06 | 3.55e-05 | 118 |
| GO:0009083 | Colorectum | AD | branched-chain amino acid catabolic process | 10/3918 | 15/18723 | 1.68e-04 | 2.29e-03 | 10 |
| GO:0016054 | Colorectum | AD | organic acid catabolic process | 73/3918 | 240/18723 | 3.20e-04 | 3.81e-03 | 73 |
| GO:0046395 | Colorectum | AD | carboxylic acid catabolic process | 70/3918 | 236/18723 | 9.06e-04 | 8.71e-03 | 70 |
| GO:0006520 | Colorectum | AD | cellular amino acid metabolic process | 81/3918 | 284/18723 | 1.37e-03 | 1.19e-02 | 81 |
| GO:0009081 | Colorectum | AD | branched-chain amino acid metabolic process | 10/3918 | 19/18723 | 2.25e-03 | 1.77e-02 | 10 |
| GO:00090831 | Colorectum | MSS | branched-chain amino acid catabolic process | 10/3467 | 15/18723 | 5.64e-05 | 9.87e-04 | 10 |
| GO:00090811 | Colorectum | MSS | branched-chain amino acid metabolic process | 10/3467 | 19/18723 | 8.39e-04 | 8.68e-03 | 10 |
| GO:00442822 | Colorectum | MSS | small molecule catabolic process | 94/3467 | 376/18723 | 9.85e-04 | 9.86e-03 | 94 |
| GO:00160542 | Colorectum | MSS | organic acid catabolic process | 61/3467 | 240/18723 | 4.72e-03 | 3.31e-02 | 61 |
| GO:00442823 | Colorectum | FAP | small molecule catabolic process | 77/2622 | 376/18723 | 3.25e-04 | 4.16e-03 | 77 |
| GO:00160543 | Colorectum | FAP | organic acid catabolic process | 50/2622 | 240/18723 | 2.30e-03 | 1.85e-02 | 50 |
| GO:00090832 | Colorectum | FAP | branched-chain amino acid catabolic process | 7/2622 | 15/18723 | 2.40e-03 | 1.90e-02 | 7 |
| GO:00463951 | Colorectum | FAP | carboxylic acid catabolic process | 48/2622 | 236/18723 | 4.53e-03 | 3.08e-02 | 48 |
| GO:00090833 | Colorectum | CRC | branched-chain amino acid catabolic process | 6/2078 | 15/18723 | 3.82e-03 | 3.19e-02 | 6 |
| GO:00442827 | Esophagus | ESCC | small molecule catabolic process | 201/8552 | 376/18723 | 1.35e-03 | 6.41e-03 | 201 |
| GO:00090836 | Esophagus | ESCC | branched-chain amino acid catabolic process | 12/8552 | 15/18723 | 7.31e-03 | 2.63e-02 | 12 |
| GO:00090815 | Esophagus | ESCC | branched-chain amino acid metabolic process | 14/8552 | 19/18723 | 1.27e-02 | 4.21e-02 | 14 |
| GO:00463953 | Liver | NAFLD | carboxylic acid catabolic process | 73/1882 | 236/18723 | 4.16e-19 | 1.22e-15 | 73 |
| GO:00160544 | Liver | NAFLD | organic acid catabolic process | 73/1882 | 240/18723 | 1.20e-18 | 2.34e-15 | 73 |
| Page: 1 2 |
| Pathway ID | Tissue | Disease Stage | Description | Gene Ratio | Bg Ratio | pvalue | p.adjust | qvalue | Count |
| hsa00280 | Colorectum | AD | Valine, leucine and isoleucine degradation | 25/2092 | 48/8465 | 3.97e-05 | 3.41e-04 | 2.18e-04 | 25 |
| hsa002801 | Colorectum | AD | Valine, leucine and isoleucine degradation | 25/2092 | 48/8465 | 3.97e-05 | 3.41e-04 | 2.18e-04 | 25 |
| hsa002802 | Colorectum | MSS | Valine, leucine and isoleucine degradation | 21/1875 | 48/8465 | 6.73e-04 | 4.51e-03 | 2.76e-03 | 21 |
| hsa002803 | Colorectum | MSS | Valine, leucine and isoleucine degradation | 21/1875 | 48/8465 | 6.73e-04 | 4.51e-03 | 2.76e-03 | 21 |
| hsa002804 | Colorectum | FAP | Valine, leucine and isoleucine degradation | 18/1404 | 48/8465 | 3.94e-04 | 3.06e-03 | 1.86e-03 | 18 |
| hsa002805 | Colorectum | FAP | Valine, leucine and isoleucine degradation | 18/1404 | 48/8465 | 3.94e-04 | 3.06e-03 | 1.86e-03 | 18 |
| hsa002809 | Esophagus | ESCC | Valine, leucine and isoleucine degradation | 34/4205 | 48/8465 | 2.34e-03 | 6.54e-03 | 3.35e-03 | 34 |
| hsa0028014 | Esophagus | ESCC | Valine, leucine and isoleucine degradation | 34/4205 | 48/8465 | 2.34e-03 | 6.54e-03 | 3.35e-03 | 34 |
| hsa002806 | Liver | NAFLD | Valine, leucine and isoleucine degradation | 20/1043 | 48/8465 | 3.03e-07 | 1.65e-05 | 1.33e-05 | 20 |
| hsa0028011 | Liver | NAFLD | Valine, leucine and isoleucine degradation | 20/1043 | 48/8465 | 3.03e-07 | 1.65e-05 | 1.33e-05 | 20 |
| hsa0028021 | Liver | Cirrhotic | Valine, leucine and isoleucine degradation | 32/2530 | 48/8465 | 1.45e-07 | 2.02e-06 | 1.24e-06 | 32 |
| hsa0028031 | Liver | Cirrhotic | Valine, leucine and isoleucine degradation | 32/2530 | 48/8465 | 1.45e-07 | 2.02e-06 | 1.24e-06 | 32 |
| hsa0028041 | Liver | HCC | Valine, leucine and isoleucine degradation | 41/4020 | 48/8465 | 4.84e-08 | 7.05e-07 | 3.92e-07 | 41 |
| hsa0028051 | Liver | HCC | Valine, leucine and isoleucine degradation | 41/4020 | 48/8465 | 4.84e-08 | 7.05e-07 | 3.92e-07 | 41 |
| hsa002808 | Oral cavity | OSCC | Valine, leucine and isoleucine degradation | 30/3704 | 48/8465 | 6.75e-03 | 1.57e-02 | 7.99e-03 | 30 |
| hsa0028013 | Oral cavity | OSCC | Valine, leucine and isoleucine degradation | 30/3704 | 48/8465 | 6.75e-03 | 1.57e-02 | 7.99e-03 | 30 |
| hsa0028022 | Oral cavity | LP | Valine, leucine and isoleucine degradation | 22/2418 | 48/8465 | 7.98e-03 | 3.02e-02 | 1.95e-02 | 22 |
| hsa0028032 | Oral cavity | LP | Valine, leucine and isoleucine degradation | 22/2418 | 48/8465 | 7.98e-03 | 3.02e-02 | 1.95e-02 | 22 |
| Page: 1 |
Top |
Cell-cell communication analysis |
| Identification of potential cell-cell interactions between two cell types and their ligand-receptor pairs for different disease states |
| Ligand | Receptor | LRpair | Pathway | Tissue | Disease Stage |
| Page: 1 |
Top |
Single-cell gene regulatory network inference analysis |
| Find out the significant the regulons (TFs) and the target genes of each regulon across cell types for different disease states |
| TF | Cell Type | Tissue | Disease Stage | Target Gene | RSS | Regulon Activity |
| ∗The dot plots of a searched regulon are shown for all cell subpopulations in each disease state of each tissue based on the regulon specific score inferred using pySCENIC and by calculating the average expression. |
| Page: 1 |
Top |
Somatic mutation of malignant transformation related genes |
| Annotation of somatic variants for genes involved in malignant transformation |
| Hugo Symbol | Variant Class | Variant Classification | dbSNP RS | HGVSc | HGVSp | HGVSp Short | SWISSPROT | BIOTYPE | SIFT | PolyPhen | Tumor Sample Barcode | Tissue | Histology | Sex | Age | Stage | Therapy Types | Drugs | Outcome |
| HIBADH | SNV | Missense_Mutation | c.139N>A | p.Leu47Met | p.L47M | P31937 | protein_coding | deleterious(0) | probably_damaging(0.999) | TCGA-A1-A0SO-01 | Breast | breast invasive carcinoma | Female | >=65 | I/II | Chemotherapy | SD | ||
| HIBADH | SNV | Missense_Mutation | rs768479109 | c.500G>A | p.Arg167Gln | p.R167Q | P31937 | protein_coding | tolerated(0.53) | benign(0.007) | TCGA-AN-A046-01 | Breast | breast invasive carcinoma | Female | >=65 | I/II | Unknown | Unknown | SD |
| HIBADH | SNV | Missense_Mutation | c.644N>C | p.Leu215Pro | p.L215P | P31937 | protein_coding | deleterious(0) | probably_damaging(0.984) | TCGA-D8-A1X9-01 | Breast | breast invasive carcinoma | Female | >=65 | I/II | Chemotherapy | adriamycin+cyclophosphamide | SD | |
| HIBADH | SNV | Missense_Mutation | novel | c.689G>T | p.Gly230Val | p.G230V | P31937 | protein_coding | deleterious(0) | possibly_damaging(0.9) | TCGA-2W-A8YY-01 | Cervix | cervical & endocervical cancer | Female | <65 | I/II | Chemotherapy | cisplatin | CR |
| HIBADH | SNV | Missense_Mutation | novel | c.794N>G | p.Asp265Gly | p.D265G | P31937 | protein_coding | deleterious(0.04) | benign(0.035) | TCGA-5M-AAT6-01 | Colorectum | colon adenocarcinoma | Female | <65 | III/IV | Unknown | Unknown | PD |
| HIBADH | SNV | Missense_Mutation | c.722N>G | p.Ala241Gly | p.A241G | P31937 | protein_coding | deleterious(0.01) | benign(0.037) | TCGA-A6-A566-01 | Colorectum | colon adenocarcinoma | Female | <65 | III/IV | Chemotherapy | oxaliplatin | PD | |
| HIBADH | SNV | Missense_Mutation | rs753848362 | c.852N>C | p.Lys284Asn | p.K284N | P31937 | protein_coding | deleterious(0) | probably_damaging(0.999) | TCGA-A6-A56B-01 | Colorectum | colon adenocarcinoma | Male | <65 | III/IV | Chemotherapy | fluorouracil | PD |
| HIBADH | SNV | Missense_Mutation | novel | c.169A>C | p.Asn57His | p.N57H | P31937 | protein_coding | deleterious(0.03) | possibly_damaging(0.724) | TCGA-CA-6717-01 | Colorectum | colon adenocarcinoma | Male | <65 | I/II | Chemotherapy | oxaliplatin | CR |
| HIBADH | SNV | Missense_Mutation | novel | c.748C>T | p.Arg250Trp | p.R250W | P31937 | protein_coding | deleterious(0) | probably_damaging(0.981) | TCGA-A5-A0G2-01 | Endometrium | uterine corpus endometrioid carcinoma | Female | <65 | III/IV | Unknown | Unknown | SD |
| HIBADH | SNV | Missense_Mutation | novel | c.494C>A | p.Ala165Asp | p.A165D | P31937 | protein_coding | deleterious(0) | probably_damaging(0.975) | TCGA-A5-A0G2-01 | Endometrium | uterine corpus endometrioid carcinoma | Female | <65 | III/IV | Unknown | Unknown | SD |
| Page: 1 2 3 4 |
Top |
Related drugs of malignant transformation related genes |
| Identification of chemicals and drugs interact with genes involved in malignant transfromation |
| (DGIdb 4.0) |
| Entrez ID | Symbol | Category | Interaction Types | Drug Claim Name | Drug Name | PMIDs |
| Page: 1 |

Copyright 2023-Present -The University of Texas Health Science Center at Houston |