
|
|||||
|
 | |
| |
| |
| |
| |
| |
|
Gene: HHLA2 |
Gene summary for HHLA2 |
| Gene information | Species | Human | Gene symbol | HHLA2 | Gene ID | 11148 |
| Gene name | HERV-H LTR-associating 2 | |
| Gene Alias | B7-H5 | |
| Cytomap | 3q13.13 | |
| Gene Type | protein-coding | GO ID | GO:0001775 | UniProtAcc | Q9UM44 |
Top |
Malignant transformation analysis |
| Identification of the aberrant gene expression in precancerous and cancerous lesions by comparing the gene expression of stem-like cells in diseased tissues with normal stem cells |
| Entrez ID | Symbol | Replicates | Species | Organ | Tissue | Adj P-value | Log2FC | Malignancy |
| 11148 | HHLA2 | HTA11_3410_2000001011 | Human | Colorectum | AD | 3.54e-02 | -2.59e-01 | 0.0155 |
| 11148 | HHLA2 | HTA11_2487_2000001011 | Human | Colorectum | SER | 4.21e-06 | 7.41e-01 | -0.1808 |
| 11148 | HHLA2 | HTA11_347_2000001011 | Human | Colorectum | AD | 2.82e-24 | 1.12e+00 | -0.1954 |
| 11148 | HHLA2 | HTA11_411_2000001011 | Human | Colorectum | SER | 6.48e-04 | 9.42e-01 | -0.2602 |
| 11148 | HHLA2 | HTA11_2992_2000001011 | Human | Colorectum | SER | 4.13e-03 | 7.97e-01 | -0.1706 |
| 11148 | HHLA2 | HTA11_5212_2000001011 | Human | Colorectum | AD | 1.70e-12 | 1.38e+00 | -0.2061 |
| 11148 | HHLA2 | HTA11_7696_3000711011 | Human | Colorectum | AD | 2.15e-02 | -2.03e-01 | 0.0674 |
| 11148 | HHLA2 | HTA11_99999971662_82457 | Human | Colorectum | MSS | 5.36e-06 | -2.77e-01 | 0.3859 |
| 11148 | HHLA2 | HTA11_99999974143_84620 | Human | Colorectum | MSS | 1.48e-08 | -3.00e-01 | 0.3005 |
| 11148 | HHLA2 | A015-C-203 | Human | Colorectum | FAP | 1.06e-02 | -7.07e-02 | -0.1294 |
| 11148 | HHLA2 | A002-C-203 | Human | Colorectum | FAP | 3.30e-02 | -1.89e-01 | 0.2786 |
| 11148 | HHLA2 | A001-C-108 | Human | Colorectum | FAP | 1.71e-04 | -1.92e-01 | -0.0272 |
| 11148 | HHLA2 | A002-C-205 | Human | Colorectum | FAP | 2.38e-02 | -1.83e-01 | -0.1236 |
| 11148 | HHLA2 | A015-C-006 | Human | Colorectum | FAP | 3.16e-02 | -2.50e-01 | -0.0994 |
| 11148 | HHLA2 | A015-C-104 | Human | Colorectum | FAP | 3.85e-05 | -1.86e-01 | -0.1899 |
| 11148 | HHLA2 | A001-C-014 | Human | Colorectum | FAP | 4.01e-02 | -1.74e-01 | 0.0135 |
| 11148 | HHLA2 | A002-C-016 | Human | Colorectum | FAP | 3.41e-04 | -1.13e-01 | 0.0521 |
| 11148 | HHLA2 | A002-C-116 | Human | Colorectum | FAP | 3.84e-05 | -1.50e-01 | -0.0452 |
| 11148 | HHLA2 | CRC-1-8810 | Human | Colorectum | CRC | 1.23e-09 | -3.05e-01 | 0.6257 |
| 11148 | HHLA2 | CRC-3-11773 | Human | Colorectum | CRC | 5.71e-09 | -2.91e-01 | 0.2564 |
| Page: 1 2 3 |
| Tissue | Expression Dynamics | Abbreviation |
| Colorectum (GSE201348) |  | FAP: Familial adenomatous polyposis |
| CRC: Colorectal cancer | ||
| Colorectum (HTA11) |  | AD: Adenomas |
| SER: Sessile serrated lesions | ||
| MSI-H: Microsatellite-high colorectal cancer | ||
| MSS: Microsatellite stable colorectal cancer | ||
| GC |  | CAG: Chronic atrophic gastritis |
| CAG with IM: Chronic atrophic gastritis with intestinal metaplasia | ||
| CSG: Chronic superficial gastritis | ||
| GC: Gastric cancer | ||
| SIM: Severe intestinal metaplasia | ||
| WIM: Wild intestinal metaplasia | ||
| Liver | 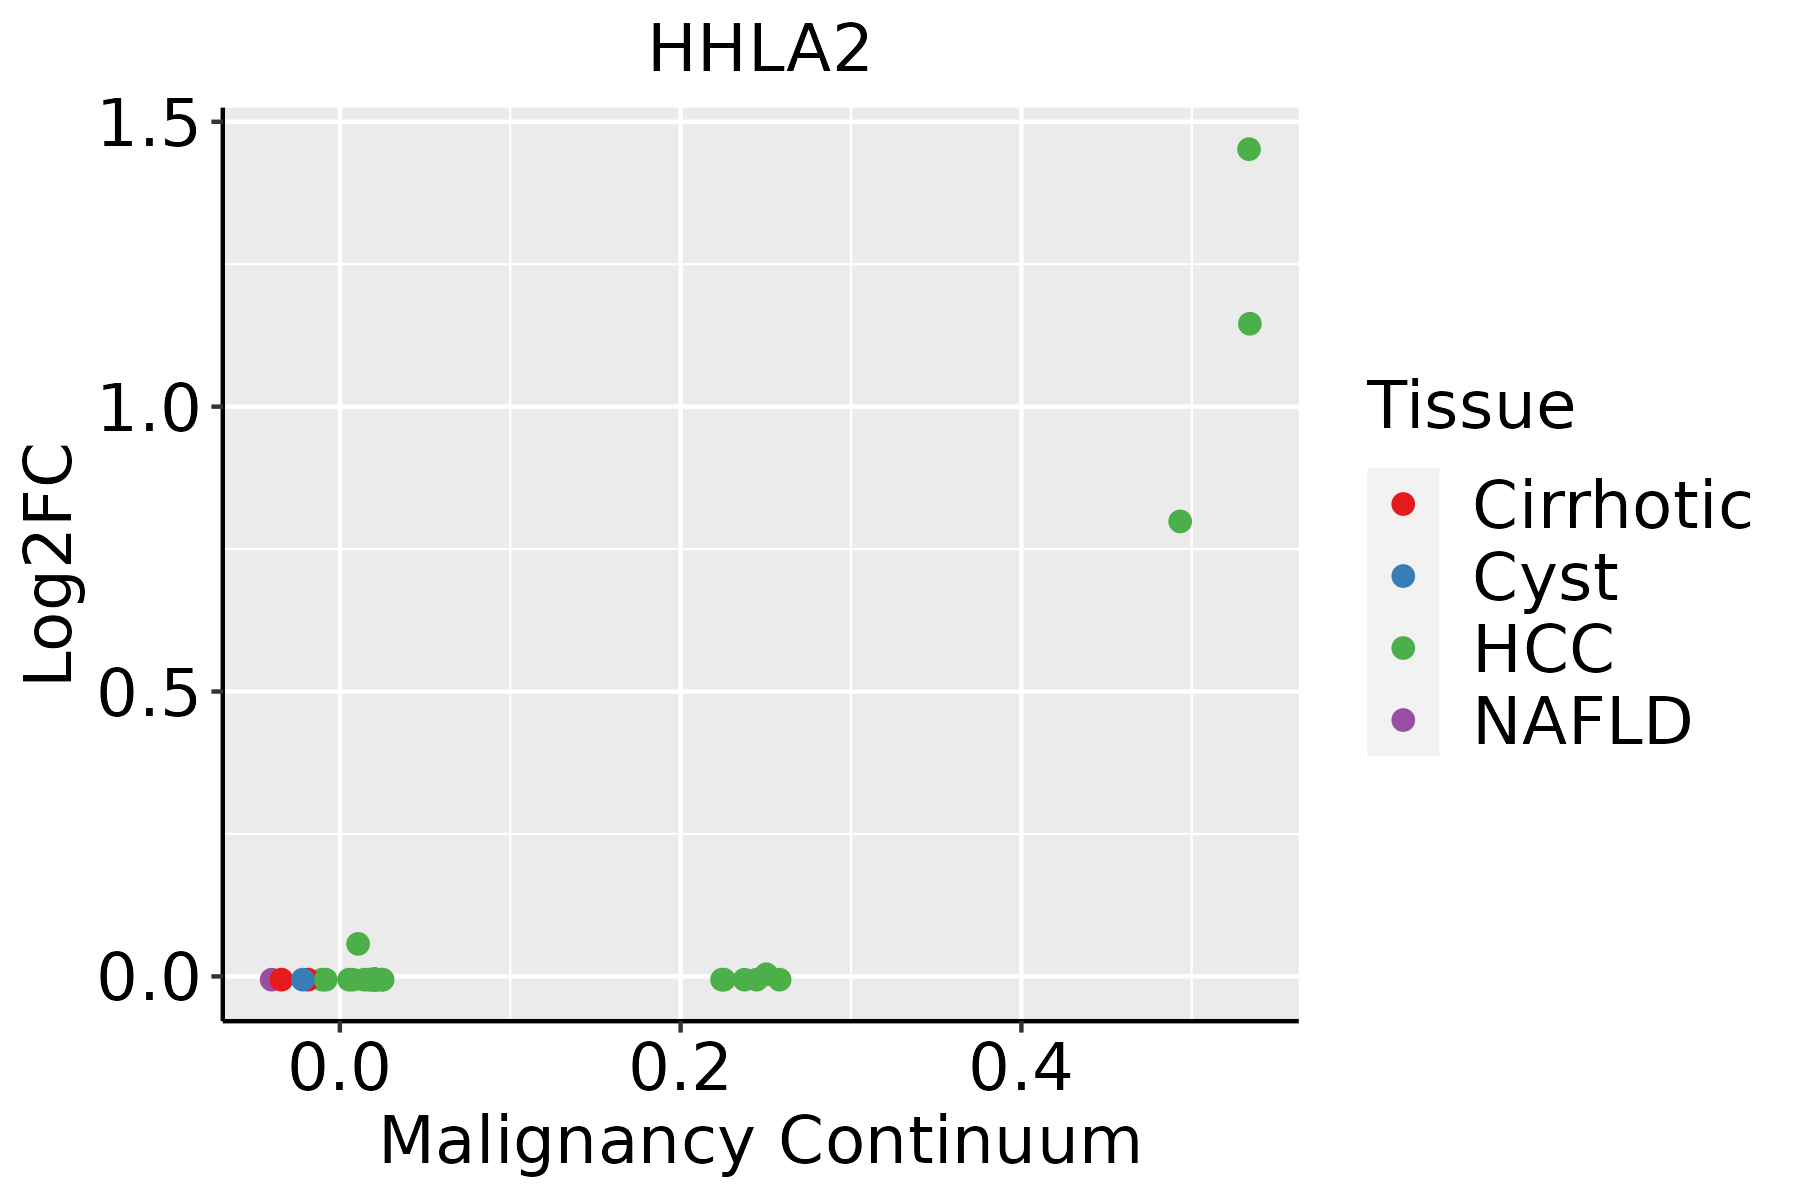 | HCC: Hepatocellular carcinoma |
| NAFLD: Non-alcoholic fatty liver disease | ||
| Lung | 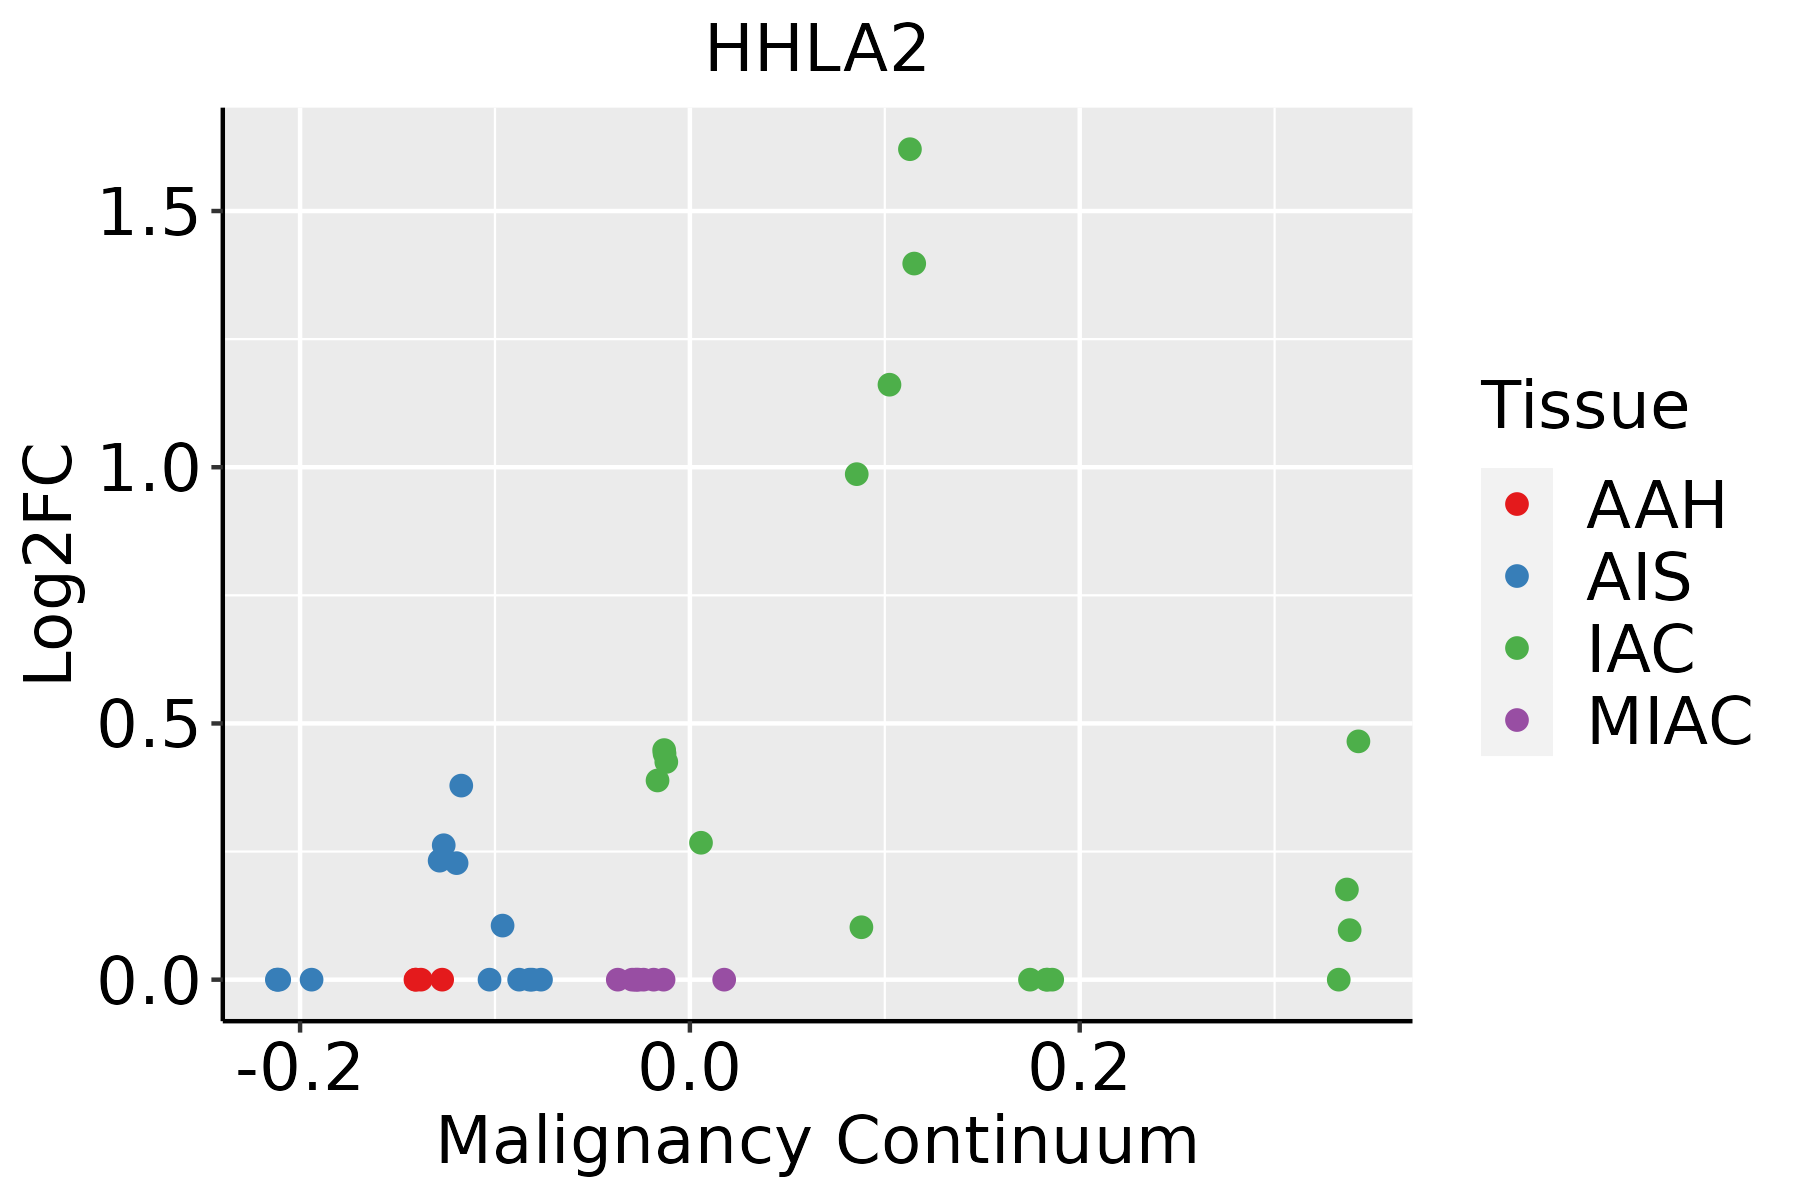 | AAH: Atypical adenomatous hyperplasia |
| AIS: Adenocarcinoma in situ | ||
| IAC: Invasive lung adenocarcinoma | ||
| MIA: Minimally invasive adenocarcinoma |
| ∗log2FC in expression of this searched gene in stem-like cells from each diseased tissue sample relative to stem-like cells in normal samples in each tissue plotted against the malignancy continuum. Samples are colored based on if they are from different disease stage. |
Top |
Malignant transformation related pathway analysis |
| Find out the enriched GO biological processes and KEGG pathways involved in transition from healthy to precancer to cancer |
| Tissue | Disease Stage | Enriched GO biological Processes |
| Colorectum | AD |  |
| Colorectum | SER |  |
| Colorectum | MSS |  |
| Colorectum | MSI-H |  |
| Colorectum | FAP |  |
| ∗Top 15 enriched GO BP terms are showed in the bar plot of each disease state in each tissue. Each row represents a significant GO biological process which is colored according to the -log10(p.adjust). |
| Page: 1 2 3 4 5 6 7 8 9 |
| GO ID | Tissue | Disease Stage | Description | Gene Ratio | Bg Ratio | pvalue | p.adjust | Count |
| GO:0045785 | Colorectum | AD | positive regulation of cell adhesion | 122/3918 | 437/18723 | 2.65e-04 | 3.28e-03 | 122 |
| GO:00457851 | Colorectum | SER | positive regulation of cell adhesion | 93/2897 | 437/18723 | 6.78e-04 | 9.04e-03 | 93 |
| GO:00457852 | Colorectum | MSS | positive regulation of cell adhesion | 110/3467 | 437/18723 | 2.94e-04 | 3.87e-03 | 110 |
| GO:00457854 | Colorectum | FAP | positive regulation of cell adhesion | 92/2622 | 437/18723 | 3.09e-05 | 7.04e-04 | 92 |
| GO:00457855 | Colorectum | CRC | positive regulation of cell adhesion | 81/2078 | 437/18723 | 2.28e-06 | 1.10e-04 | 81 |
| GO:0022407 | Colorectum | CRC | regulation of cell-cell adhesion | 67/2078 | 448/18723 | 6.86e-03 | 4.81e-02 | 67 |
| GO:004578512 | Liver | HCC | positive regulation of cell adhesion | 215/7958 | 437/18723 | 2.53e-03 | 1.22e-02 | 215 |
| GO:00457858 | Lung | IAC | positive regulation of cell adhesion | 87/2061 | 437/18723 | 2.59e-08 | 3.13e-06 | 87 |
| GO:00224078 | Lung | IAC | regulation of cell-cell adhesion | 76/2061 | 448/18723 | 8.16e-05 | 1.68e-03 | 76 |
| GO:00421106 | Lung | IAC | T cell activation | 77/2061 | 487/18723 | 6.82e-04 | 9.20e-03 | 77 |
| GO:00224097 | Lung | IAC | positive regulation of cell-cell adhesion | 49/2061 | 284/18723 | 9.60e-04 | 1.16e-02 | 49 |
| GO:00071596 | Lung | IAC | leukocyte cell-cell adhesion | 60/2061 | 371/18723 | 1.47e-03 | 1.57e-02 | 60 |
| GO:0050852 | Lung | IAC | T cell receptor signaling pathway | 25/2061 | 123/18723 | 1.75e-03 | 1.80e-02 | 25 |
| GO:00508636 | Lung | IAC | regulation of T cell activation | 54/2061 | 329/18723 | 1.77e-03 | 1.82e-02 | 54 |
| GO:19030376 | Lung | IAC | regulation of leukocyte cell-cell adhesion | 54/2061 | 336/18723 | 2.82e-03 | 2.55e-02 | 54 |
| GO:00027643 | Lung | IAC | immune response-regulating signaling pathway | 70/2061 | 468/18723 | 4.79e-03 | 3.72e-02 | 70 |
| GO:00420986 | Lung | IAC | T cell proliferation | 34/2061 | 199/18723 | 6.20e-03 | 4.47e-02 | 34 |
| GO:00457856 | Stomach | GC | positive regulation of cell adhesion | 56/1159 | 437/18723 | 1.79e-07 | 1.02e-05 | 56 |
| GO:00224076 | Stomach | GC | regulation of cell-cell adhesion | 55/1159 | 448/18723 | 9.21e-07 | 4.39e-05 | 55 |
| GO:0007159 | Stomach | GC | leukocyte cell-cell adhesion | 45/1159 | 371/18723 | 1.21e-05 | 3.99e-04 | 45 |
| Page: 1 2 3 4 |
| Pathway ID | Tissue | Disease Stage | Description | Gene Ratio | Bg Ratio | pvalue | p.adjust | qvalue | Count |
| Page: 1 |
Top |
Cell-cell communication analysis |
| Identification of potential cell-cell interactions between two cell types and their ligand-receptor pairs for different disease states |
| Ligand | Receptor | LRpair | Pathway | Tissue | Disease Stage |
| Page: 1 |
Top |
Single-cell gene regulatory network inference analysis |
| Find out the significant the regulons (TFs) and the target genes of each regulon across cell types for different disease states |
| TF | Cell Type | Tissue | Disease Stage | Target Gene | RSS | Regulon Activity |
| ∗The dot plots of a searched regulon are shown for all cell subpopulations in each disease state of each tissue based on the regulon specific score inferred using pySCENIC and by calculating the average expression. |
| Page: 1 |
Top |
Somatic mutation of malignant transformation related genes |
| Annotation of somatic variants for genes involved in malignant transformation |
| Hugo Symbol | Variant Class | Variant Classification | dbSNP RS | HGVSc | HGVSp | HGVSp Short | SWISSPROT | BIOTYPE | SIFT | PolyPhen | Tumor Sample Barcode | Tissue | Histology | Sex | Age | Stage | Therapy Types | Drugs | Outcome |
| HHLA2 | SNV | Missense_Mutation | rs369237811 | c.823N>G | p.Leu275Val | p.L275V | Q9UM44 | protein_coding | tolerated(0.16) | benign(0.395) | TCGA-A1-A0SI-01 | Breast | breast invasive carcinoma | Female | <65 | I/II | Unknown | Unknown | SD |
| HHLA2 | SNV | Missense_Mutation | c.644N>T | p.Ser215Leu | p.S215L | Q9UM44 | protein_coding | tolerated(0.08) | benign(0.103) | TCGA-AC-A23H-01 | Breast | breast invasive carcinoma | Female | >=65 | I/II | Unknown | Unknown | PD | |
| HHLA2 | SNV | Missense_Mutation | c.1144N>T | p.Asp382Tyr | p.D382Y | Q9UM44 | protein_coding | tolerated_low_confidence(0.08) | benign(0.006) | TCGA-E9-A1ND-01 | Breast | breast invasive carcinoma | Female | >=65 | I/II | Hormone Therapy | aromasin | SD | |
| HHLA2 | insertion | Frame_Shift_Ins | novel | c.385_386insTATCTTCA | p.Ile130SerfsTer3 | p.I130Sfs*3 | Q9UM44 | protein_coding | TCGA-A8-A06P-01 | Breast | breast invasive carcinoma | Female | <65 | III/IV | Unspecific | SD | |||
| HHLA2 | insertion | Frame_Shift_Ins | novel | c.387_388insCTAAGGGTCGAAATATACAC | p.Ile130LeufsTer14 | p.I130Lfs*14 | Q9UM44 | protein_coding | TCGA-A8-A06P-01 | Breast | breast invasive carcinoma | Female | <65 | III/IV | Unspecific | SD | |||
| HHLA2 | deletion | Frame_Shift_Del | novel | c.256delN | p.Arg87AspfsTer25 | p.R87Dfs*25 | Q9UM44 | protein_coding | TCGA-D8-A27V-01 | Breast | breast invasive carcinoma | Female | <65 | I/II | Hormone Therapy | tamoxiphen | SD | ||
| HHLA2 | deletion | Frame_Shift_Del | novel | c.733delN | p.Pro245LeufsTer2 | p.P245Lfs*2 | Q9UM44 | protein_coding | TCGA-D8-A27V-01 | Breast | breast invasive carcinoma | Female | <65 | I/II | Hormone Therapy | tamoxiphen | SD | ||
| HHLA2 | SNV | Missense_Mutation | c.566N>G | p.Ser189Cys | p.S189C | Q9UM44 | protein_coding | deleterious(0.04) | probably_damaging(0.947) | TCGA-EK-A3GJ-01 | Cervix | cervical & endocervical cancer | Female | <65 | I/II | Unknown | Unknown | SD | |
| HHLA2 | SNV | Missense_Mutation | rs771206254 | c.311N>T | p.Ala104Val | p.A104V | Q9UM44 | protein_coding | deleterious(0) | probably_damaging(0.923) | TCGA-A6-3809-01 | Colorectum | colon adenocarcinoma | Female | >=65 | I/II | Unknown | Unknown | SD |
| HHLA2 | SNV | Missense_Mutation | c.711N>C | p.Glu237Asp | p.E237D | Q9UM44 | protein_coding | tolerated(0.18) | benign(0.394) | TCGA-AA-3510-01 | Colorectum | colon adenocarcinoma | Male | >=65 | I/II | Unknown | Unknown | SD |
| Page: 1 2 3 4 5 6 |
Top |
Related drugs of malignant transformation related genes |
| Identification of chemicals and drugs interact with genes involved in malignant transfromation |
| (DGIdb 4.0) |
| Entrez ID | Symbol | Category | Interaction Types | Drug Claim Name | Drug Name | PMIDs |
| Page: 1 |

Copyright 2023-Present -The University of Texas Health Science Center at Houston |