
|
|||||
|
 | |
| |
| |
| |
| |
| |
|
Gene: HHIP |
Gene summary for HHIP |
| Gene information | Species | Human | Gene symbol | HHIP | Gene ID | 64399 |
| Gene name | hedgehog interacting protein | |
| Gene Alias | HIP | |
| Cytomap | 4q31.21 | |
| Gene Type | protein-coding | GO ID | GO:0001501 | UniProtAcc | Q96QV1 |
Top |
Malignant transformation analysis |
| Identification of the aberrant gene expression in precancerous and cancerous lesions by comparing the gene expression of stem-like cells in diseased tissues with normal stem cells |
| Entrez ID | Symbol | Replicates | Species | Organ | Tissue | Adj P-value | Log2FC | Malignancy |
| 64399 | HHIP | P10T-E | Human | Esophagus | ESCC | 1.33e-65 | 1.24e+00 | 0.116 |
| 64399 | HHIP | P12T-E | Human | Esophagus | ESCC | 2.93e-15 | 6.33e-01 | 0.1122 |
| 64399 | HHIP | P31T-E | Human | Esophagus | ESCC | 4.17e-05 | 2.69e-01 | 0.1251 |
| 64399 | HHIP | ATC11 | Human | Thyroid | ATC | 1.70e-11 | 1.53e+00 | 0.3386 |
| 64399 | HHIP | ATC13 | Human | Thyroid | ATC | 8.48e-15 | 4.86e-01 | 0.34 |
| 64399 | HHIP | ATC2 | Human | Thyroid | ATC | 1.70e-05 | 1.77e+00 | 0.34 |
| 64399 | HHIP | ATC3 | Human | Thyroid | ATC | 1.30e-23 | 1.71e+00 | 0.338 |
| 64399 | HHIP | ATC5 | Human | Thyroid | ATC | 5.11e-12 | 5.12e-01 | 0.34 |
| Page: 1 |
| Tissue | Expression Dynamics | Abbreviation |
| Esophagus |  | ESCC: Esophageal squamous cell carcinoma |
| HGIN: High-grade intraepithelial neoplasias | ||
| LGIN: Low-grade intraepithelial neoplasias | ||
| Thyroid | 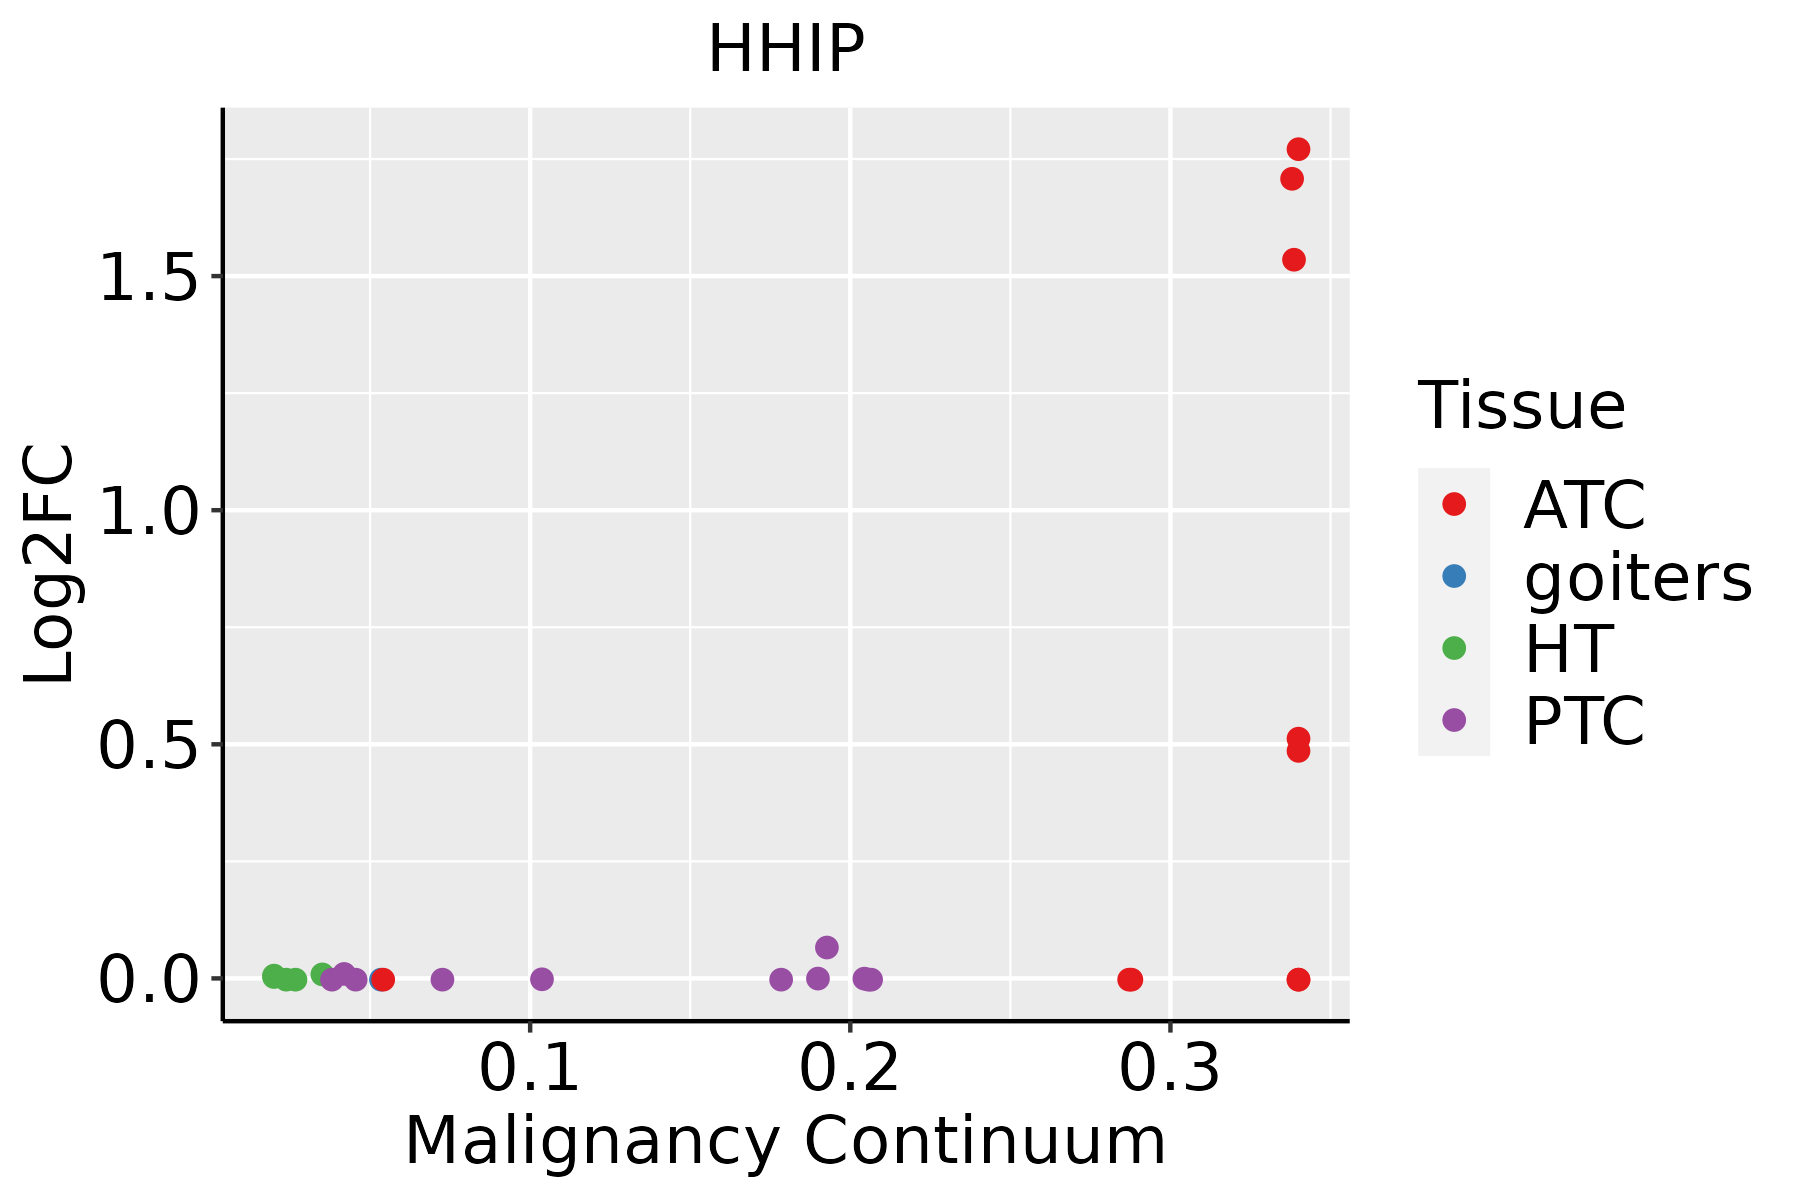 | ATC: Anaplastic thyroid cancer |
| HT: Hashimoto's thyroiditis | ||
| PTC: Papillary thyroid cancer |
| ∗log2FC in expression of this searched gene in stem-like cells from each diseased tissue sample relative to stem-like cells in normal samples in each tissue plotted against the malignancy continuum. Samples are colored based on if they are from different disease stage. |
Top |
Malignant transformation related pathway analysis |
| Find out the enriched GO biological processes and KEGG pathways involved in transition from healthy to precancer to cancer |
| Tissue | Disease Stage | Enriched GO biological Processes |
| Colorectum | AD |  |
| Colorectum | SER |  |
| Colorectum | MSS |  |
| Colorectum | MSI-H |  |
| Colorectum | FAP |  |
| ∗Top 15 enriched GO BP terms are showed in the bar plot of each disease state in each tissue. Each row represents a significant GO biological process which is colored according to the -log10(p.adjust). |
| Page: 1 2 3 4 5 6 7 8 9 |
| GO ID | Tissue | Disease Stage | Description | Gene Ratio | Bg Ratio | pvalue | p.adjust | Count |
| GO:00303239 | Esophagus | ESCC | respiratory tube development | 112/8552 | 181/18723 | 7.82e-06 | 7.69e-05 | 112 |
| GO:006056210 | Esophagus | ESCC | epithelial tube morphogenesis | 187/8552 | 325/18723 | 9.95e-06 | 9.44e-05 | 187 |
| GO:00605417 | Esophagus | ESCC | respiratory system development | 123/8552 | 203/18723 | 1.26e-05 | 1.15e-04 | 123 |
| GO:00303249 | Esophagus | ESCC | lung development | 109/8552 | 177/18723 | 1.40e-05 | 1.27e-04 | 109 |
| GO:00604257 | Esophagus | ESCC | lung morphogenesis | 37/8552 | 50/18723 | 4.42e-05 | 3.51e-04 | 37 |
| GO:00604414 | Esophagus | ESCC | epithelial tube branching involved in lung morphogenesis | 22/8552 | 29/18723 | 9.30e-04 | 4.73e-03 | 22 |
| GO:00487052 | Esophagus | ESCC | skeletal system morphogenesis | 120/8552 | 220/18723 | 4.90e-03 | 1.89e-02 | 120 |
| GO:00017639 | Esophagus | ESCC | morphogenesis of a branching structure | 106/8552 | 196/18723 | 1.08e-02 | 3.66e-02 | 106 |
| GO:006056222 | Thyroid | ATC | epithelial tube morphogenesis | 156/6293 | 325/18723 | 4.48e-08 | 8.14e-07 | 156 |
| GO:003032321 | Thyroid | ATC | respiratory tube development | 93/6293 | 181/18723 | 5.67e-07 | 8.02e-06 | 93 |
| GO:003032421 | Thyroid | ATC | lung development | 90/6293 | 177/18723 | 1.53e-06 | 1.88e-05 | 90 |
| GO:006054121 | Thyroid | ATC | respiratory system development | 100/6293 | 203/18723 | 2.66e-06 | 3.08e-05 | 100 |
| GO:009028721 | Thyroid | ATC | regulation of cellular response to growth factor stimulus | 140/6293 | 304/18723 | 3.91e-06 | 4.33e-05 | 140 |
| GO:000176317 | Thyroid | ATC | morphogenesis of a branching structure | 96/6293 | 196/18723 | 5.68e-06 | 6.04e-05 | 96 |
| GO:006113815 | Thyroid | ATC | morphogenesis of a branching epithelium | 88/6293 | 182/18723 | 2.55e-05 | 2.20e-04 | 88 |
| GO:00487053 | Thyroid | ATC | skeletal system morphogenesis | 101/6293 | 220/18723 | 9.48e-05 | 6.93e-04 | 101 |
| GO:00487545 | Thyroid | ATC | branching morphogenesis of an epithelial tube | 71/6293 | 151/18723 | 4.18e-04 | 2.50e-03 | 71 |
| GO:00458791 | Thyroid | ATC | negative regulation of smoothened signaling pathway | 20/6293 | 32/18723 | 7.67e-04 | 4.24e-03 | 20 |
| GO:0008589 | Thyroid | ATC | regulation of smoothened signaling pathway | 40/6293 | 81/18723 | 2.36e-03 | 1.10e-02 | 40 |
| GO:0007224 | Thyroid | ATC | smoothened signaling pathway | 60/6293 | 138/18723 | 9.75e-03 | 3.57e-02 | 60 |
| Page: 1 |
| Pathway ID | Tissue | Disease Stage | Description | Gene Ratio | Bg Ratio | pvalue | p.adjust | qvalue | Count |
| Page: 1 |
Top |
Cell-cell communication analysis |
| Identification of potential cell-cell interactions between two cell types and their ligand-receptor pairs for different disease states |
| Ligand | Receptor | LRpair | Pathway | Tissue | Disease Stage |
| Page: 1 |
Top |
Single-cell gene regulatory network inference analysis |
| Find out the significant the regulons (TFs) and the target genes of each regulon across cell types for different disease states |
| TF | Cell Type | Tissue | Disease Stage | Target Gene | RSS | Regulon Activity |
| ∗The dot plots of a searched regulon are shown for all cell subpopulations in each disease state of each tissue based on the regulon specific score inferred using pySCENIC and by calculating the average expression. |
| Page: 1 |
Top |
Somatic mutation of malignant transformation related genes |
| Annotation of somatic variants for genes involved in malignant transformation |
| Hugo Symbol | Variant Class | Variant Classification | dbSNP RS | HGVSc | HGVSp | HGVSp Short | SWISSPROT | BIOTYPE | SIFT | PolyPhen | Tumor Sample Barcode | Tissue | Histology | Sex | Age | Stage | Therapy Types | Drugs | Outcome |
| HHIP | SNV | Missense_Mutation | novel | c.1789A>G | p.Thr597Ala | p.T597A | Q96QV1 | protein_coding | tolerated(0.71) | benign(0) | TCGA-EW-A3U0-01 | Breast | breast invasive carcinoma | Female | <65 | III/IV | Chemotherapy | cisplatin | CR |
| HHIP | deletion | Frame_Shift_Del | novel | c.1332delN | p.Asn445ThrfsTer4 | p.N445Tfs*4 | Q96QV1 | protein_coding | TCGA-D8-A27V-01 | Breast | breast invasive carcinoma | Female | <65 | I/II | Hormone Therapy | tamoxiphen | SD | ||
| HHIP | SNV | Missense_Mutation | c.322G>C | p.Glu108Gln | p.E108Q | Q96QV1 | protein_coding | tolerated(0.28) | benign(0.018) | TCGA-VS-A958-01 | Cervix | cervical & endocervical cancer | Female | <65 | I/II | Chemotherapy | cisplatin | CR | |
| HHIP | deletion | Frame_Shift_Del | novel | c.764delN | p.Pro256LeufsTer21 | p.P256Lfs*21 | Q96QV1 | protein_coding | TCGA-VS-A9V0-01 | Cervix | cervical & endocervical cancer | Female | <65 | I/II | Chemotherapy | cisplatin | PD | ||
| HHIP | SNV | Missense_Mutation | c.40N>A | p.Val14Met | p.V14M | Q96QV1 | protein_coding | tolerated_low_confidence(0.27) | benign(0.003) | TCGA-A6-3809-01 | Colorectum | colon adenocarcinoma | Female | >=65 | I/II | Unknown | Unknown | SD | |
| HHIP | SNV | Missense_Mutation | rs146905204 | c.862G>A | p.Ala288Thr | p.A288T | Q96QV1 | protein_coding | tolerated(0.06) | probably_damaging(0.997) | TCGA-A6-6781-01 | Colorectum | colon adenocarcinoma | Male | <65 | III/IV | Chemotherapy | oxaliplatin | SD |
| HHIP | SNV | Missense_Mutation | c.139C>T | p.Arg47Cys | p.R47C | Q96QV1 | protein_coding | deleterious(0) | possibly_damaging(0.823) | TCGA-AA-3811-01 | Colorectum | colon adenocarcinoma | Female | >=65 | III/IV | Unknown | Unknown | PD | |
| HHIP | SNV | Missense_Mutation | novel | c.1777N>A | p.Glu593Lys | p.E593K | Q96QV1 | protein_coding | tolerated(1) | benign(0.059) | TCGA-AA-3984-01 | Colorectum | colon adenocarcinoma | Female | <65 | I/II | Unknown | Unknown | SD |
| HHIP | SNV | Missense_Mutation | c.1526N>G | p.Tyr509Cys | p.Y509C | Q96QV1 | protein_coding | deleterious(0) | probably_damaging(0.998) | TCGA-AA-A010-01 | Colorectum | colon adenocarcinoma | Female | <65 | I/II | Chemotherapy | folinic | CR | |
| HHIP | SNV | Missense_Mutation | c.1745N>G | p.Ile582Ser | p.I582S | Q96QV1 | protein_coding | deleterious(0.03) | benign(0.005) | TCGA-AA-A010-01 | Colorectum | colon adenocarcinoma | Female | <65 | I/II | Chemotherapy | folinic | CR |
| Page: 1 2 3 4 5 6 7 8 9 10 11 |
Top |
Related drugs of malignant transformation related genes |
| Identification of chemicals and drugs interact with genes involved in malignant transfromation |
| (DGIdb 4.0) |
| Entrez ID | Symbol | Category | Interaction Types | Drug Claim Name | Drug Name | PMIDs |
| Page: 1 |

Copyright 2023-Present -The University of Texas Health Science Center at Houston |