
|
|||||
|
 | |
| |
| |
| |
| |
| |
|
Gene: HGSNAT |
Gene summary for HGSNAT |
| Gene information | Species | Human | Gene symbol | HGSNAT | Gene ID | 138050 |
| Gene name | heparan-alpha-glucosaminide N-acetyltransferase | |
| Gene Alias | HGNAT | |
| Cytomap | 8p11.21-p11.1 | |
| Gene Type | protein-coding | GO ID | GO:0006810 | UniProtAcc | Q68CP4 |
Top |
Malignant transformation analysis |
| Identification of the aberrant gene expression in precancerous and cancerous lesions by comparing the gene expression of stem-like cells in diseased tissues with normal stem cells |
| Entrez ID | Symbol | Replicates | Species | Organ | Tissue | Adj P-value | Log2FC | Malignancy |
| 138050 | HGSNAT | LZE2T | Human | Esophagus | ESCC | 5.36e-03 | 4.34e-01 | 0.082 |
| 138050 | HGSNAT | LZE8T | Human | Esophagus | ESCC | 1.72e-07 | 1.42e-01 | 0.067 |
| 138050 | HGSNAT | LZE20T | Human | Esophagus | ESCC | 2.21e-14 | 6.54e-01 | 0.0662 |
| 138050 | HGSNAT | LZE24T | Human | Esophagus | ESCC | 1.42e-14 | 3.64e-01 | 0.0596 |
| 138050 | HGSNAT | LZE21T | Human | Esophagus | ESCC | 2.07e-03 | 2.19e-01 | 0.0655 |
| 138050 | HGSNAT | P1T-E | Human | Esophagus | ESCC | 6.47e-11 | 3.67e-01 | 0.0875 |
| 138050 | HGSNAT | P2T-E | Human | Esophagus | ESCC | 1.77e-38 | 6.28e-01 | 0.1177 |
| 138050 | HGSNAT | P4T-E | Human | Esophagus | ESCC | 6.51e-21 | 4.54e-01 | 0.1323 |
| 138050 | HGSNAT | P5T-E | Human | Esophagus | ESCC | 2.66e-07 | 5.95e-02 | 0.1327 |
| 138050 | HGSNAT | P8T-E | Human | Esophagus | ESCC | 4.64e-23 | 3.89e-01 | 0.0889 |
| 138050 | HGSNAT | P9T-E | Human | Esophagus | ESCC | 3.28e-06 | 1.54e-01 | 0.1131 |
| 138050 | HGSNAT | P10T-E | Human | Esophagus | ESCC | 8.13e-19 | 3.01e-01 | 0.116 |
| 138050 | HGSNAT | P11T-E | Human | Esophagus | ESCC | 4.39e-13 | 6.46e-01 | 0.1426 |
| 138050 | HGSNAT | P12T-E | Human | Esophagus | ESCC | 5.92e-25 | 4.13e-01 | 0.1122 |
| 138050 | HGSNAT | P15T-E | Human | Esophagus | ESCC | 4.43e-29 | 6.95e-01 | 0.1149 |
| 138050 | HGSNAT | P16T-E | Human | Esophagus | ESCC | 9.92e-66 | 1.26e+00 | 0.1153 |
| 138050 | HGSNAT | P17T-E | Human | Esophagus | ESCC | 2.80e-03 | 3.07e-01 | 0.1278 |
| 138050 | HGSNAT | P20T-E | Human | Esophagus | ESCC | 8.01e-22 | 3.68e-01 | 0.1124 |
| 138050 | HGSNAT | P21T-E | Human | Esophagus | ESCC | 2.39e-17 | 2.41e-01 | 0.1617 |
| 138050 | HGSNAT | P22T-E | Human | Esophagus | ESCC | 1.26e-32 | 5.28e-01 | 0.1236 |
| Page: 1 2 3 4 5 6 |
| Tissue | Expression Dynamics | Abbreviation |
| Esophagus | 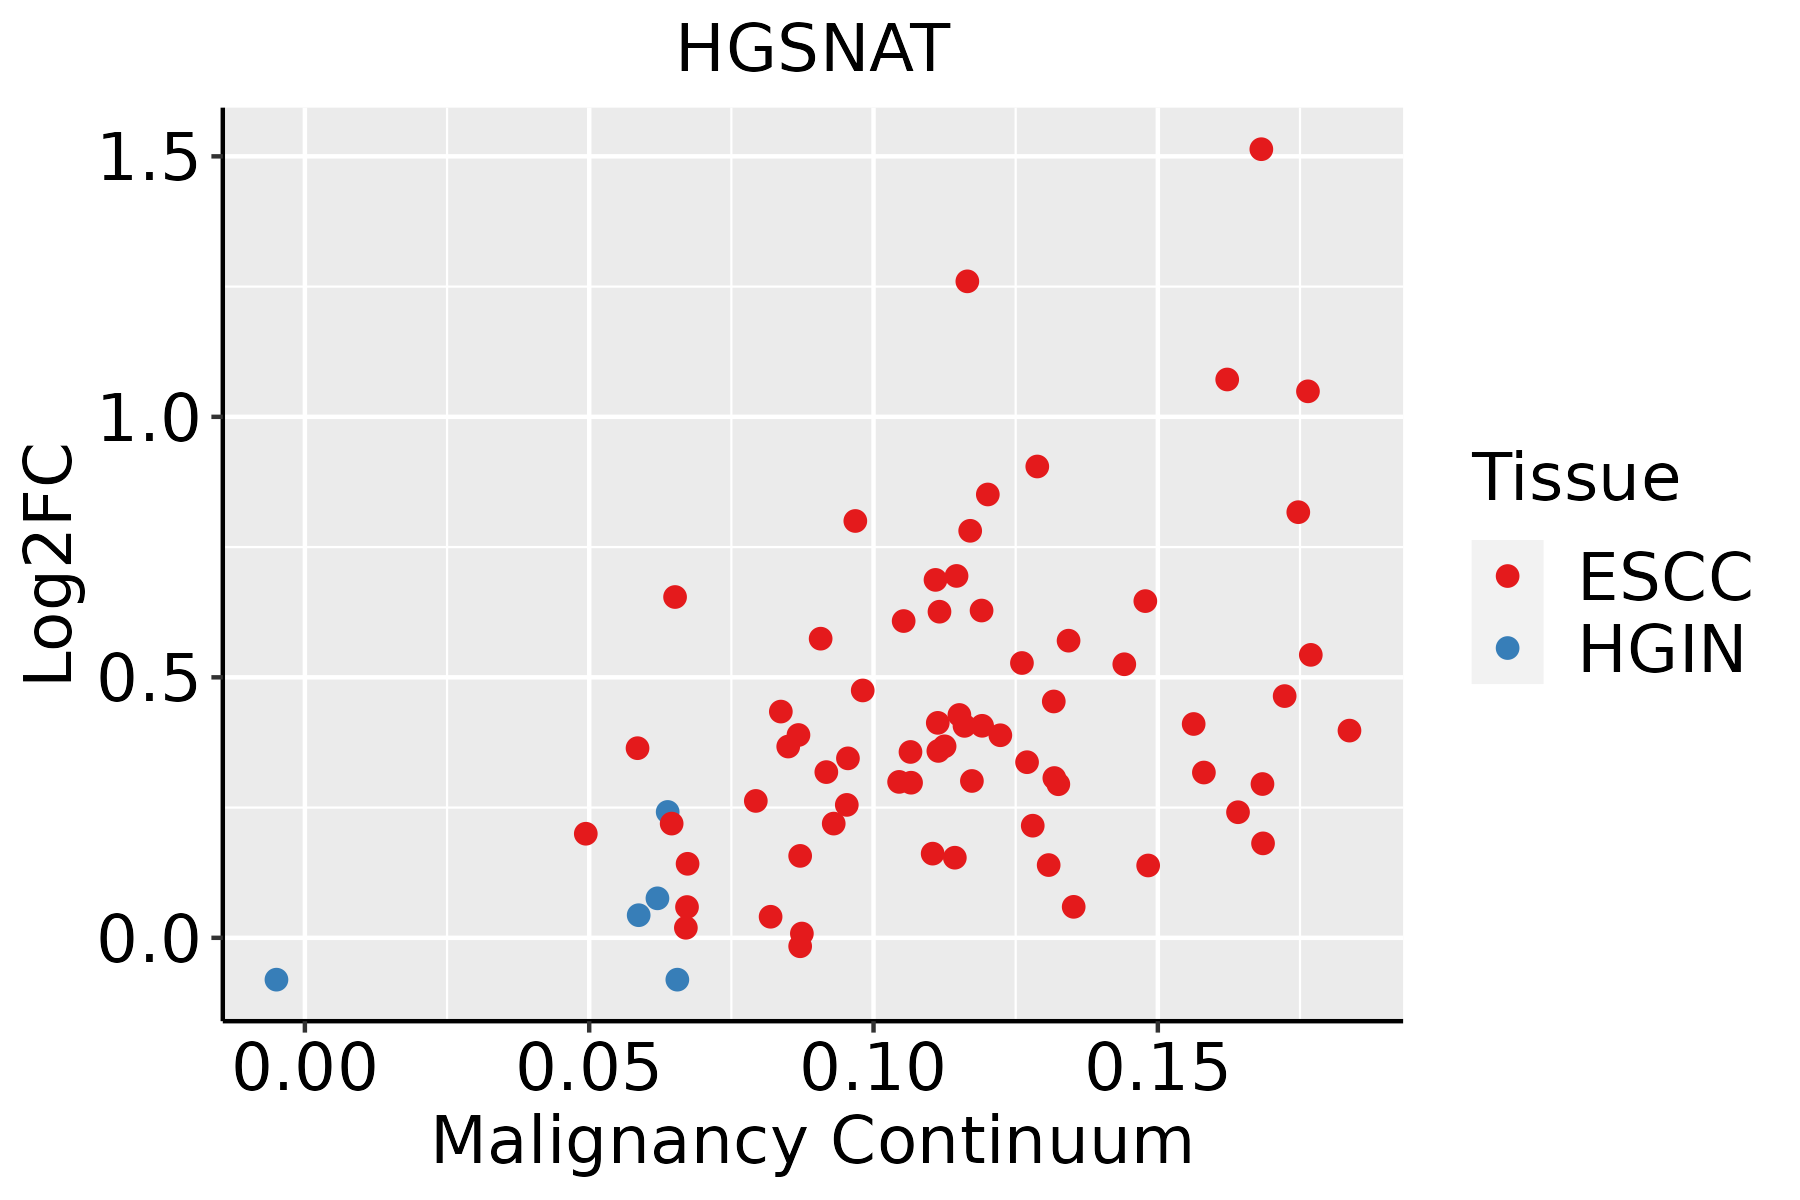 | ESCC: Esophageal squamous cell carcinoma |
| HGIN: High-grade intraepithelial neoplasias | ||
| LGIN: Low-grade intraepithelial neoplasias | ||
| Liver | 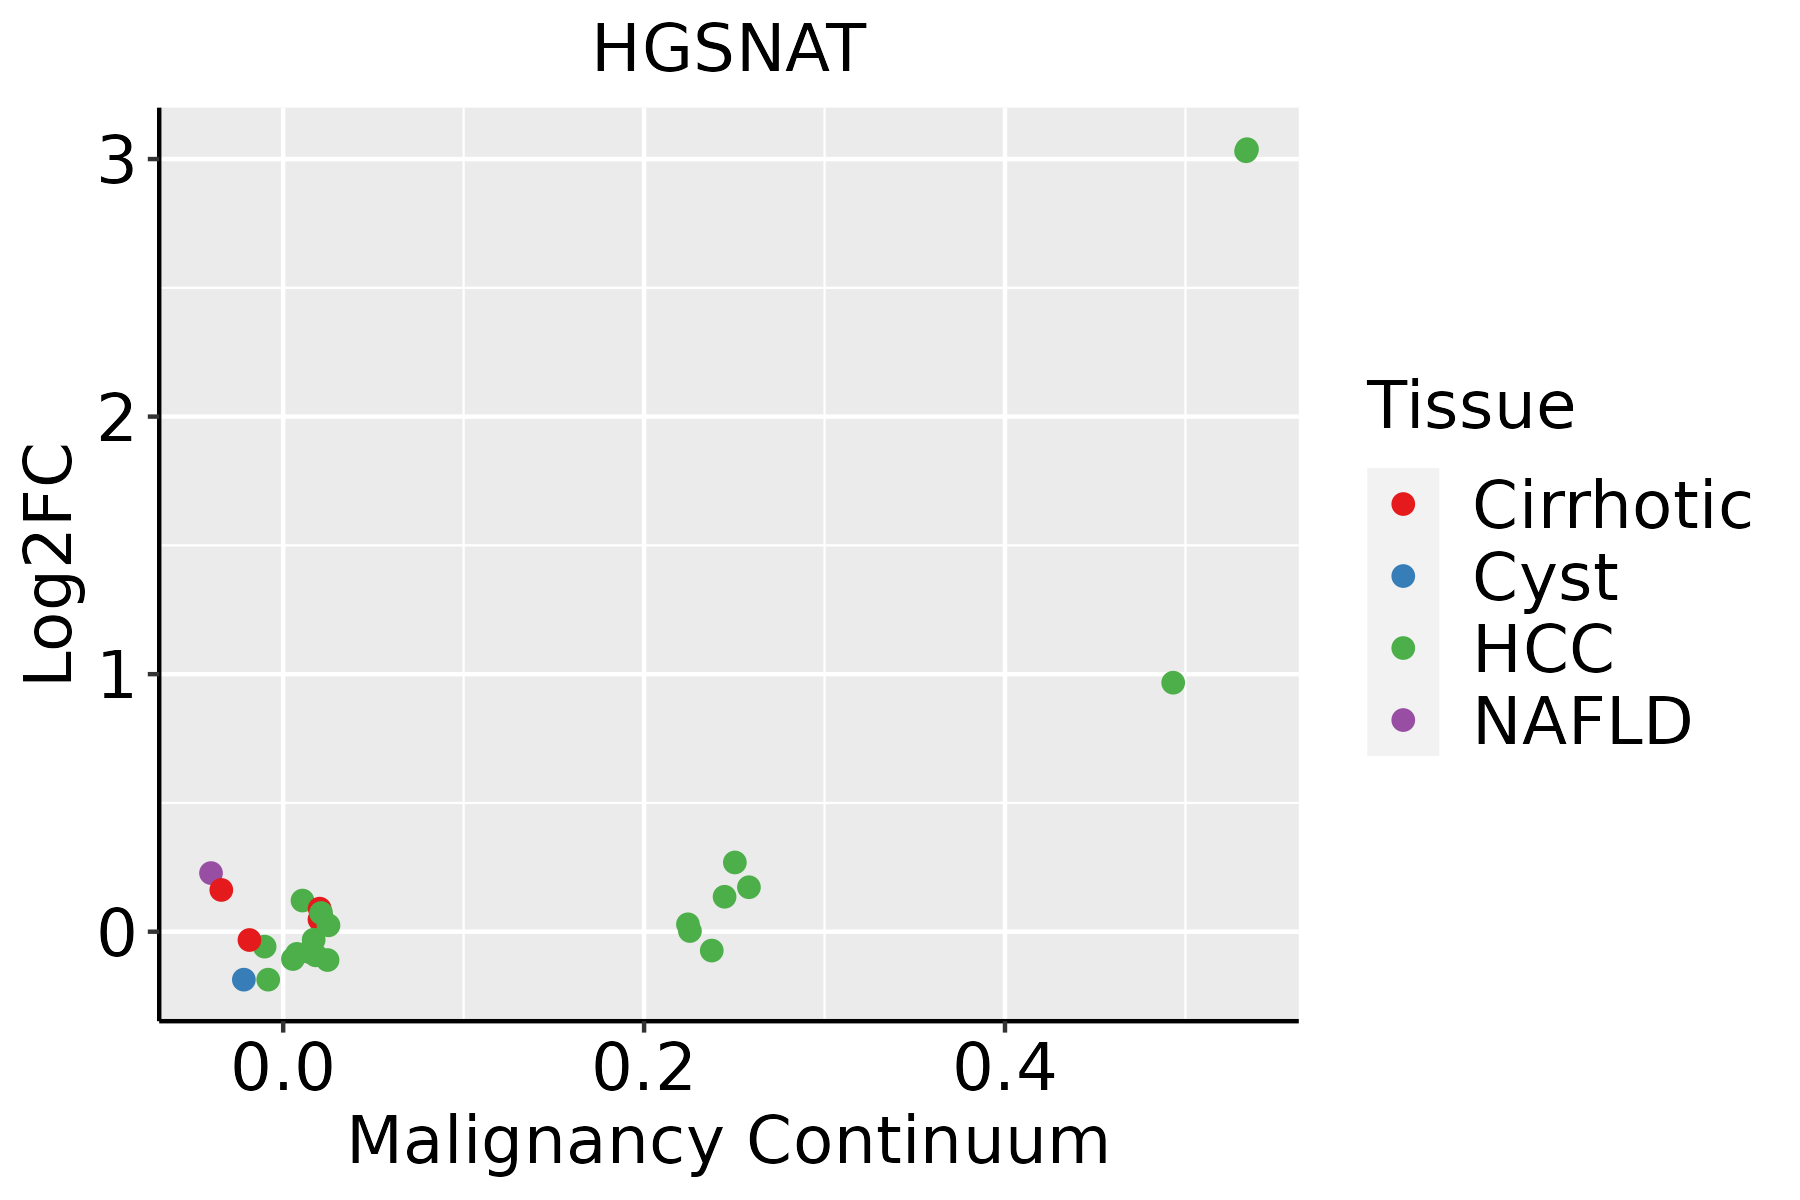 | HCC: Hepatocellular carcinoma |
| NAFLD: Non-alcoholic fatty liver disease | ||
| Oral Cavity | 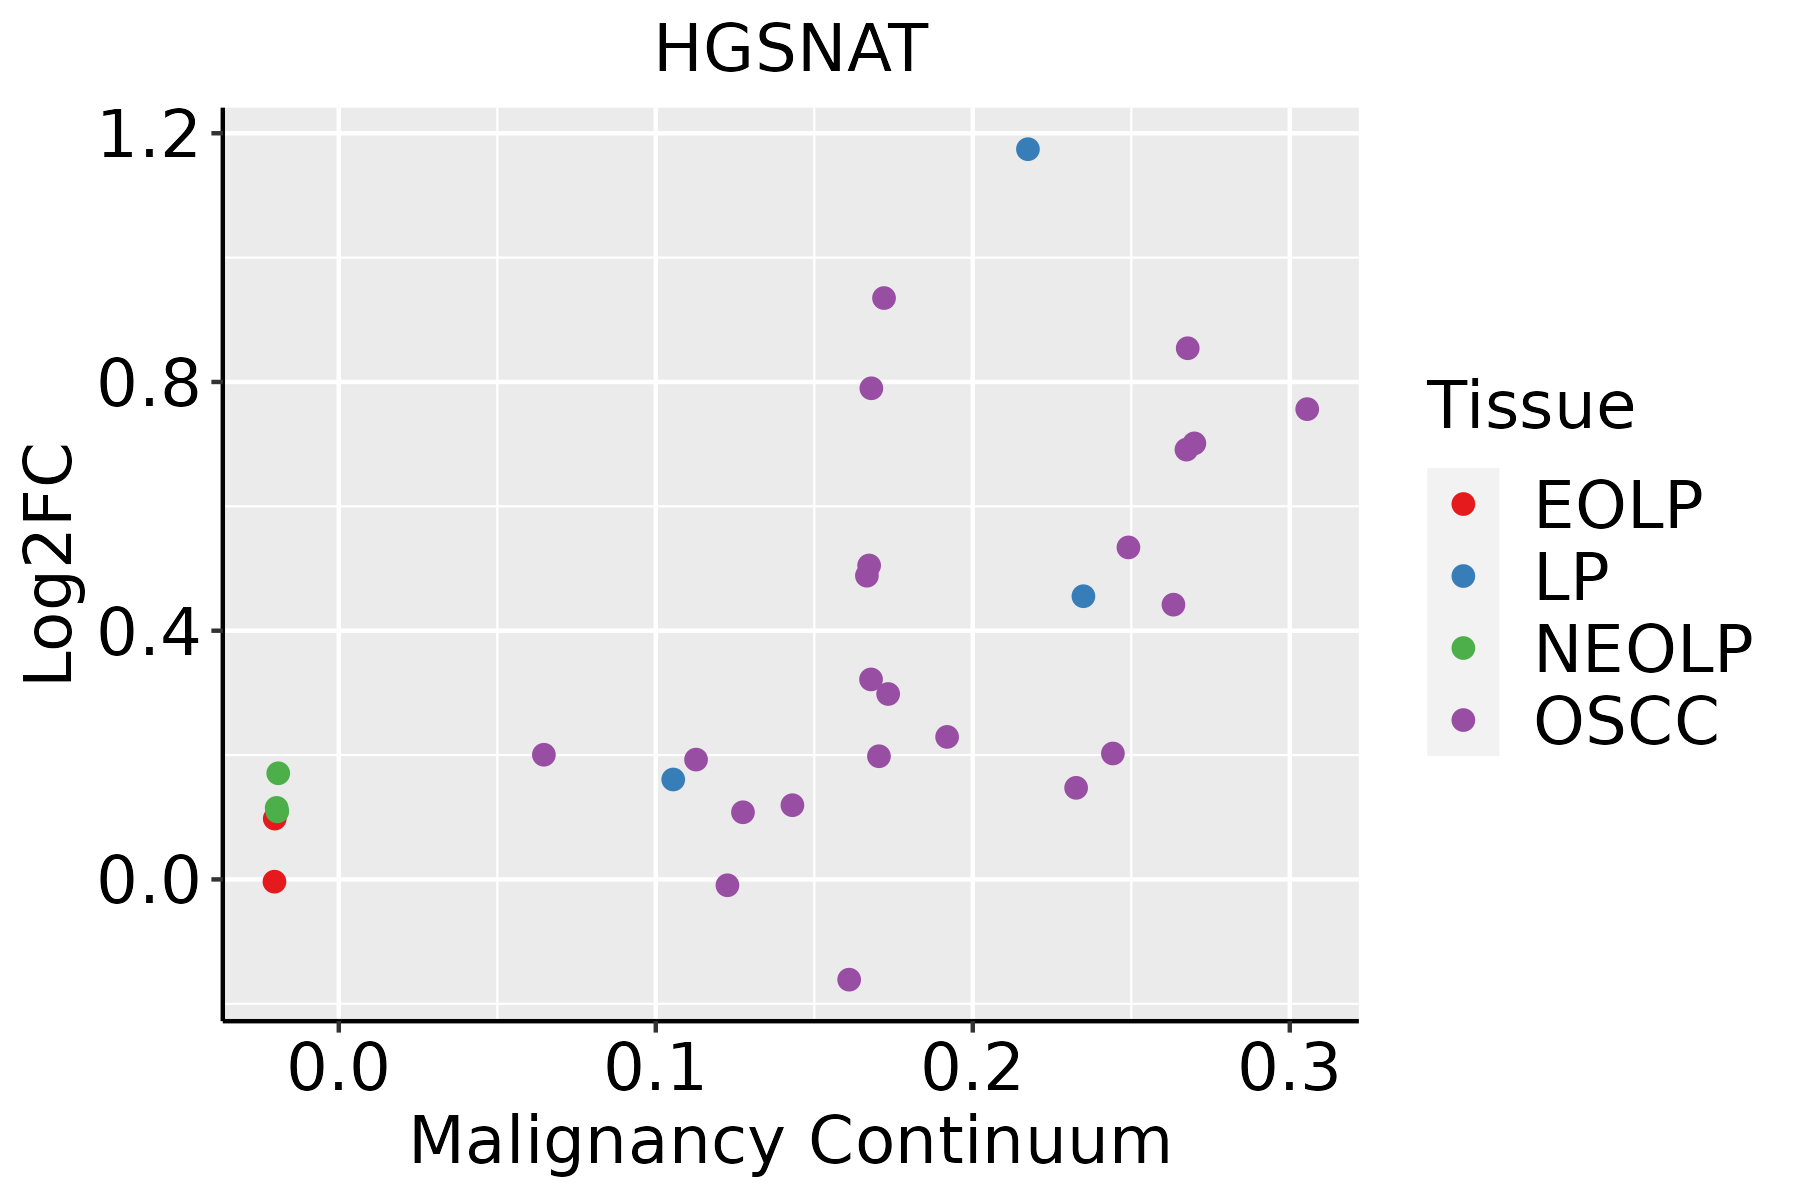 | EOLP: Erosive Oral lichen planus |
| LP: leukoplakia | ||
| NEOLP: Non-erosive oral lichen planus | ||
| OSCC: Oral squamous cell carcinoma | ||
| Skin |  | AK: Actinic keratosis |
| cSCC: Cutaneous squamous cell carcinoma | ||
| SCCIS:squamous cell carcinoma in situ | ||
| Thyroid | 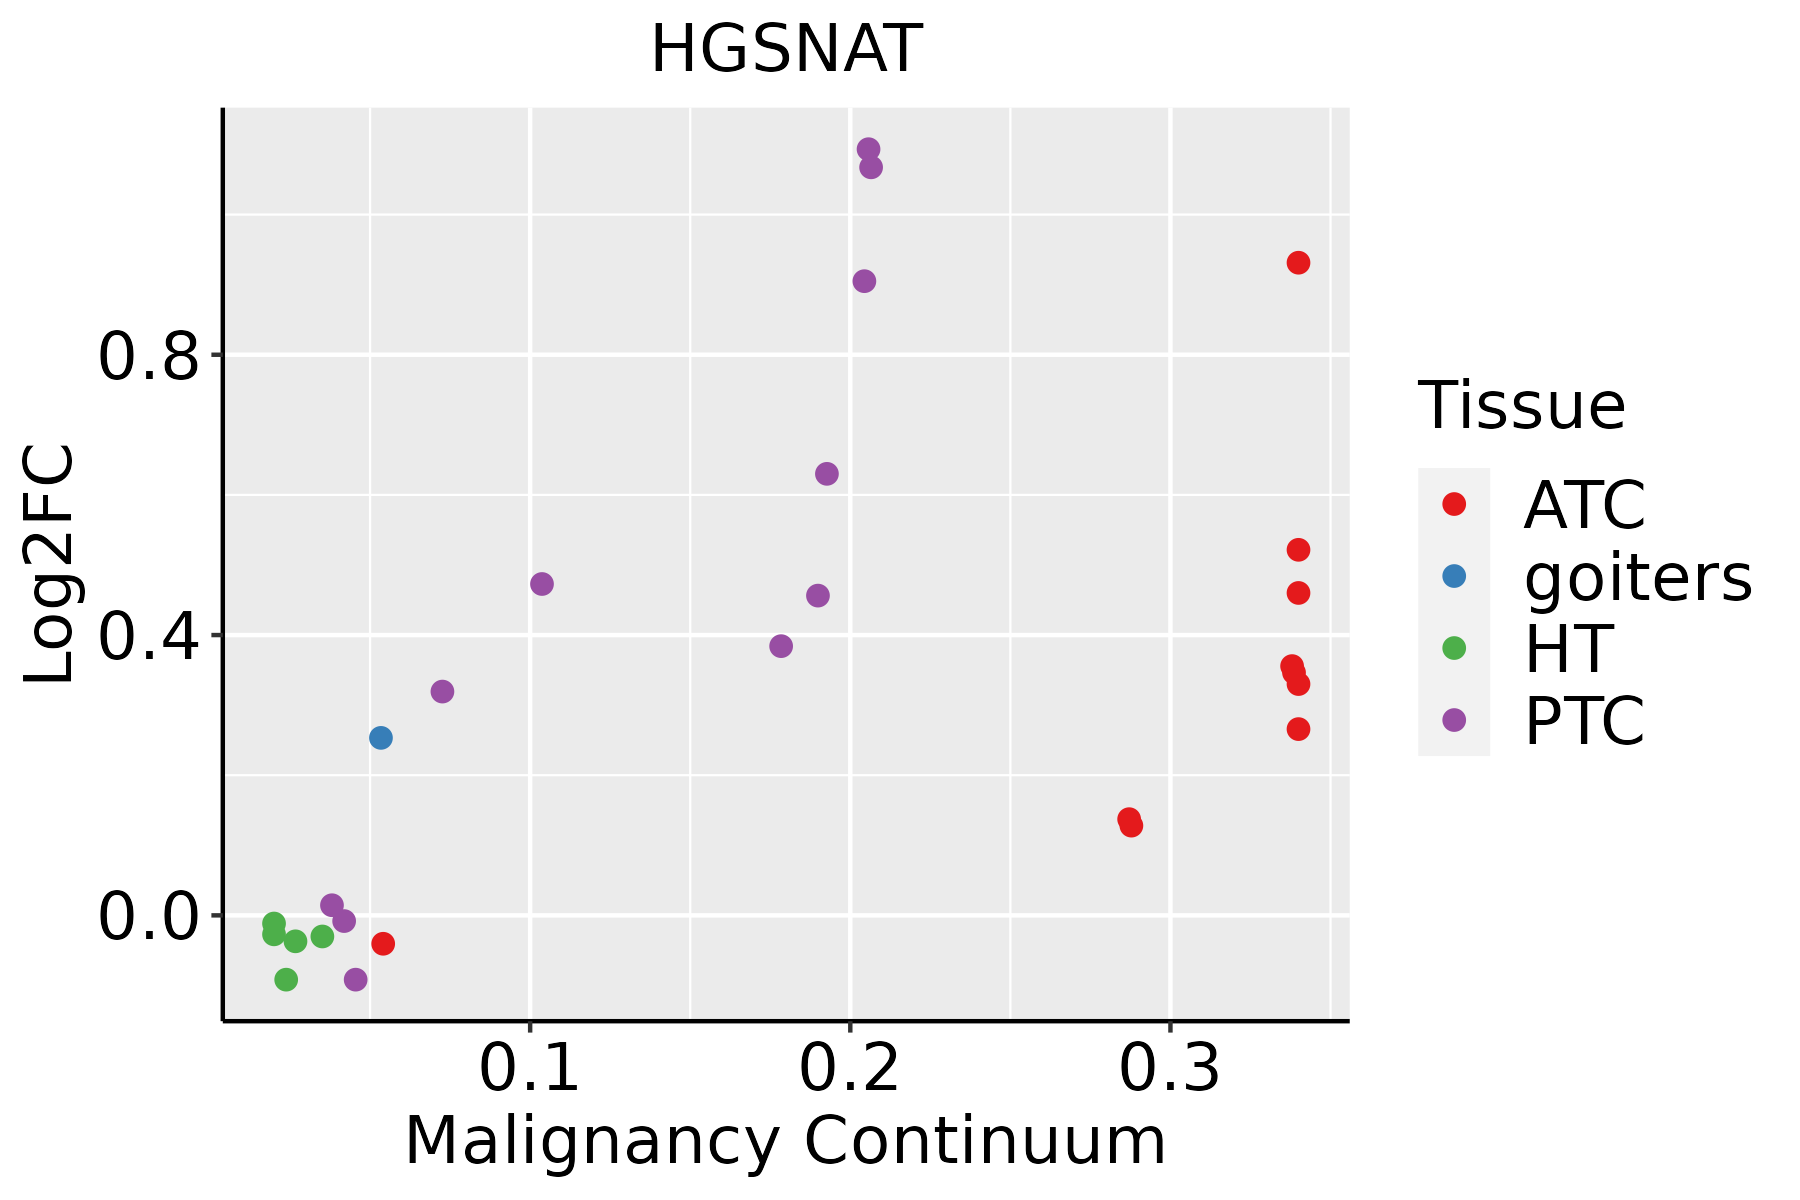 | ATC: Anaplastic thyroid cancer |
| HT: Hashimoto's thyroiditis | ||
| PTC: Papillary thyroid cancer |
| ∗log2FC in expression of this searched gene in stem-like cells from each diseased tissue sample relative to stem-like cells in normal samples in each tissue plotted against the malignancy continuum. Samples are colored based on if they are from different disease stage. |
Top |
Malignant transformation related pathway analysis |
| Find out the enriched GO biological processes and KEGG pathways involved in transition from healthy to precancer to cancer |
| Tissue | Disease Stage | Enriched GO biological Processes |
| Colorectum | AD |  |
| Colorectum | SER |  |
| Colorectum | MSS |  |
| Colorectum | MSI-H |  |
| Colorectum | FAP |  |
| ∗Top 15 enriched GO BP terms are showed in the bar plot of each disease state in each tissue. Each row represents a significant GO biological process which is colored according to the -log10(p.adjust). |
| Page: 1 2 3 4 5 6 7 8 9 |
| GO ID | Tissue | Disease Stage | Description | Gene Ratio | Bg Ratio | pvalue | p.adjust | Count |
| GO:000703417 | Esophagus | ESCC | vacuolar transport | 119/8552 | 157/18723 | 1.16e-14 | 6.30e-13 | 119 |
| GO:00070419 | Esophagus | ESCC | lysosomal transport | 83/8552 | 114/18723 | 3.52e-09 | 7.41e-08 | 83 |
| GO:00512592 | Esophagus | ESCC | protein complex oligomerization | 130/8552 | 238/18723 | 3.29e-03 | 1.36e-02 | 130 |
| GO:000703411 | Liver | Cirrhotic | vacuolar transport | 75/4634 | 157/18723 | 3.13e-10 | 1.53e-08 | 75 |
| GO:000704111 | Liver | Cirrhotic | lysosomal transport | 50/4634 | 114/18723 | 6.15e-06 | 9.82e-05 | 50 |
| GO:000703421 | Liver | HCC | vacuolar transport | 108/7958 | 157/18723 | 2.22e-11 | 8.69e-10 | 108 |
| GO:000704121 | Liver | HCC | lysosomal transport | 76/7958 | 114/18723 | 1.56e-07 | 2.88e-06 | 76 |
| GO:000703410 | Oral cavity | OSCC | vacuolar transport | 103/7305 | 157/18723 | 1.25e-11 | 4.44e-10 | 103 |
| GO:00070418 | Oral cavity | OSCC | lysosomal transport | 69/7305 | 114/18723 | 2.62e-06 | 3.26e-05 | 69 |
| GO:0051259 | Oral cavity | OSCC | protein complex oligomerization | 121/7305 | 238/18723 | 1.29e-04 | 9.21e-04 | 121 |
| GO:000703415 | Oral cavity | LP | vacuolar transport | 74/4623 | 157/18723 | 7.85e-10 | 3.70e-08 | 74 |
| GO:000704114 | Oral cavity | LP | lysosomal transport | 49/4623 | 114/18723 | 1.38e-05 | 2.45e-04 | 49 |
| GO:00512591 | Oral cavity | LP | protein complex oligomerization | 85/4623 | 238/18723 | 8.81e-05 | 1.11e-03 | 85 |
| GO:000703422 | Oral cavity | EOLP | vacuolar transport | 36/2218 | 157/18723 | 6.66e-05 | 8.27e-04 | 36 |
| GO:000704122 | Oral cavity | EOLP | lysosomal transport | 27/2218 | 114/18723 | 2.97e-04 | 2.79e-03 | 27 |
| GO:000703431 | Oral cavity | NEOLP | vacuolar transport | 30/2005 | 157/18723 | 1.18e-03 | 8.72e-03 | 30 |
| GO:000704131 | Oral cavity | NEOLP | lysosomal transport | 22/2005 | 114/18723 | 4.42e-03 | 2.49e-02 | 22 |
| GO:000703419 | Skin | cSCC | vacuolar transport | 74/4864 | 157/18723 | 8.60e-09 | 2.72e-07 | 74 |
| GO:000704110 | Skin | cSCC | lysosomal transport | 49/4864 | 114/18723 | 5.78e-05 | 5.74e-04 | 49 |
| GO:0007034110 | Thyroid | PTC | vacuolar transport | 90/5968 | 157/18723 | 3.74e-11 | 1.35e-09 | 90 |
| Page: 1 2 |
| Pathway ID | Tissue | Disease Stage | Description | Gene Ratio | Bg Ratio | pvalue | p.adjust | qvalue | Count |
| hsa0414222 | Esophagus | ESCC | Lysosome | 102/4205 | 132/8465 | 5.11e-11 | 7.13e-10 | 3.65e-10 | 102 |
| hsa0414232 | Esophagus | ESCC | Lysosome | 102/4205 | 132/8465 | 5.11e-11 | 7.13e-10 | 3.65e-10 | 102 |
| hsa041424 | Liver | Cirrhotic | Lysosome | 68/2530 | 132/8465 | 1.34e-07 | 1.97e-06 | 1.21e-06 | 68 |
| hsa0414211 | Liver | Cirrhotic | Lysosome | 68/2530 | 132/8465 | 1.34e-07 | 1.97e-06 | 1.21e-06 | 68 |
| hsa041422 | Liver | HCC | Lysosome | 100/4020 | 132/8465 | 2.32e-11 | 4.31e-10 | 2.40e-10 | 100 |
| hsa041423 | Liver | HCC | Lysosome | 100/4020 | 132/8465 | 2.32e-11 | 4.31e-10 | 2.40e-10 | 100 |
| hsa041425 | Oral cavity | OSCC | Lysosome | 87/3704 | 132/8465 | 1.97e-07 | 1.35e-06 | 6.86e-07 | 87 |
| hsa0414212 | Oral cavity | OSCC | Lysosome | 87/3704 | 132/8465 | 1.97e-07 | 1.35e-06 | 6.86e-07 | 87 |
| hsa0414221 | Oral cavity | LP | Lysosome | 67/2418 | 132/8465 | 5.13e-08 | 7.77e-07 | 5.01e-07 | 67 |
| hsa0414231 | Oral cavity | LP | Lysosome | 67/2418 | 132/8465 | 5.13e-08 | 7.77e-07 | 5.01e-07 | 67 |
| Page: 1 |
Top |
Cell-cell communication analysis |
| Identification of potential cell-cell interactions between two cell types and their ligand-receptor pairs for different disease states |
| Ligand | Receptor | LRpair | Pathway | Tissue | Disease Stage |
| Page: 1 |
Top |
Single-cell gene regulatory network inference analysis |
| Find out the significant the regulons (TFs) and the target genes of each regulon across cell types for different disease states |
| TF | Cell Type | Tissue | Disease Stage | Target Gene | RSS | Regulon Activity |
| ∗The dot plots of a searched regulon are shown for all cell subpopulations in each disease state of each tissue based on the regulon specific score inferred using pySCENIC and by calculating the average expression. |
| Page: 1 |
Top |
Somatic mutation of malignant transformation related genes |
| Annotation of somatic variants for genes involved in malignant transformation |
| Hugo Symbol | Variant Class | Variant Classification | dbSNP RS | HGVSc | HGVSp | HGVSp Short | SWISSPROT | BIOTYPE | SIFT | PolyPhen | Tumor Sample Barcode | Tissue | Histology | Sex | Age | Stage | Therapy Types | Drugs | Outcome |
| HGSNAT | SNV | Missense_Mutation | c.1521N>G | p.Phe507Leu | p.F507L | Q68CP4 | protein_coding | deleterious(0) | benign(0.05) | TCGA-A2-A04P-01 | Breast | breast invasive carcinoma | Female | <65 | III/IV | Chemotherapy | taxol | PD | |
| HGSNAT | SNV | Missense_Mutation | c.1831C>A | p.Gln611Lys | p.Q611K | Q68CP4 | protein_coding | deleterious(0) | benign(0.269) | TCGA-A8-A07L-01 | Breast | breast invasive carcinoma | Female | <65 | III/IV | Chemotherapy | CR | ||
| HGSNAT | SNV | Missense_Mutation | c.1009N>A | p.Pro337Thr | p.P337T | Q68CP4 | protein_coding | deleterious(0.01) | possibly_damaging(0.593) | TCGA-AC-A23H-01 | Breast | breast invasive carcinoma | Female | >=65 | I/II | Unknown | Unknown | PD | |
| HGSNAT | SNV | Missense_Mutation | c.1348N>A | p.Asp450Asn | p.D450N | Q68CP4 | protein_coding | tolerated(1) | benign(0) | TCGA-BH-A0AW-01 | Breast | breast invasive carcinoma | Female | <65 | I/II | Chemotherapy | carboplatin | SD | |
| HGSNAT | SNV | Missense_Mutation | c.1141N>G | p.Leu381Val | p.L381V | Q68CP4 | protein_coding | tolerated(0.5) | benign(0.011) | TCGA-D8-A1JD-01 | Breast | breast invasive carcinoma | Female | <65 | I/II | Chemotherapy | adriamycin | SD | |
| HGSNAT | insertion | Frame_Shift_Ins | novel | c.1347_1348insTTCCTCTCTTACTATAAATTGCTAGGTGGAGTTCACTCAG | p.Asp450PhefsTer33 | p.D450Ffs*33 | Q68CP4 | protein_coding | TCGA-A2-A04Y-01 | Breast | breast invasive carcinoma | Female | <65 | I/II | Chemotherapy | cytoxan | SD | ||
| HGSNAT | insertion | Frame_Shift_Ins | novel | c.1201_1202insTCTCA | p.Gly401ValfsTer8 | p.G401Vfs*8 | Q68CP4 | protein_coding | TCGA-A8-A093-01 | Breast | breast invasive carcinoma | Female | <65 | I/II | Hormone Therapy | tamoxiphen | SD | ||
| HGSNAT | insertion | In_Frame_Ins | novel | c.1202_1203insAGGGGCACCCAGCTGTATGGGGTGTCAGTCGGT | p.Gly401_Leu402insGlyAlaProSerCysMetGlyCysGlnSerVal | p.G401_L402insGAPSCMGCQSV | Q68CP4 | protein_coding | TCGA-A8-A093-01 | Breast | breast invasive carcinoma | Female | <65 | I/II | Hormone Therapy | tamoxiphen | SD | ||
| HGSNAT | insertion | Frame_Shift_Ins | novel | c.1716_1717insATTGGTGTTGAAACCAAGTG | p.Phe573IlefsTer12 | p.F573Ifs*12 | Q68CP4 | protein_coding | TCGA-BH-A0EB-01 | Breast | breast invasive carcinoma | Female | >=65 | I/II | Hormone Therapy | arimidex | SD | ||
| HGSNAT | deletion | Frame_Shift_Del | novel | c.1717delN | p.Tyr574IlefsTer4 | p.Y574Ifs*4 | Q68CP4 | protein_coding | TCGA-D8-A27V-01 | Breast | breast invasive carcinoma | Female | <65 | I/II | Hormone Therapy | tamoxiphen | SD |
| Page: 1 2 3 4 5 6 7 |
Top |
Related drugs of malignant transformation related genes |
| Identification of chemicals and drugs interact with genes involved in malignant transfromation |
| (DGIdb 4.0) |
| Entrez ID | Symbol | Category | Interaction Types | Drug Claim Name | Drug Name | PMIDs |
| Page: 1 |

Copyright 2023-Present -The University of Texas Health Science Center at Houston |