
|
|||||
|
 | |
| |
| |
| |
| |
| |
|
Gene: HGS |
Gene summary for HGS |
| Gene information | Species | Human | Gene symbol | HGS | Gene ID | 9146 |
| Gene name | hepatocyte growth factor-regulated tyrosine kinase substrate | |
| Gene Alias | HRS | |
| Cytomap | 17q25.3 | |
| Gene Type | protein-coding | GO ID | GO:0001525 | UniProtAcc | A0A0S2Z4R4 |
Top |
Malignant transformation analysis |
| Identification of the aberrant gene expression in precancerous and cancerous lesions by comparing the gene expression of stem-like cells in diseased tissues with normal stem cells |
| Entrez ID | Symbol | Replicates | Species | Organ | Tissue | Adj P-value | Log2FC | Malignancy |
| 9146 | HGS | LZE2T | Human | Esophagus | ESCC | 1.83e-03 | 6.56e-01 | 0.082 |
| 9146 | HGS | LZE4T | Human | Esophagus | ESCC | 7.01e-06 | 1.68e-01 | 0.0811 |
| 9146 | HGS | LZE7T | Human | Esophagus | ESCC | 5.89e-16 | 7.92e-01 | 0.0667 |
| 9146 | HGS | LZE8T | Human | Esophagus | ESCC | 3.09e-10 | 2.74e-01 | 0.067 |
| 9146 | HGS | LZE20T | Human | Esophagus | ESCC | 2.23e-08 | 2.20e-01 | 0.0662 |
| 9146 | HGS | LZE22D1 | Human | Esophagus | HGIN | 3.24e-05 | 2.55e-01 | 0.0595 |
| 9146 | HGS | LZE22T | Human | Esophagus | ESCC | 4.11e-04 | 5.52e-01 | 0.068 |
| 9146 | HGS | LZE24T | Human | Esophagus | ESCC | 1.37e-34 | 9.96e-01 | 0.0596 |
| 9146 | HGS | LZE21T | Human | Esophagus | ESCC | 1.39e-04 | 3.87e-01 | 0.0655 |
| 9146 | HGS | P1T-E | Human | Esophagus | ESCC | 4.85e-13 | 4.92e-01 | 0.0875 |
| 9146 | HGS | P2T-E | Human | Esophagus | ESCC | 1.17e-32 | 5.23e-01 | 0.1177 |
| 9146 | HGS | P4T-E | Human | Esophagus | ESCC | 6.72e-21 | 2.76e-01 | 0.1323 |
| 9146 | HGS | P5T-E | Human | Esophagus | ESCC | 9.49e-22 | 3.94e-01 | 0.1327 |
| 9146 | HGS | P8T-E | Human | Esophagus | ESCC | 3.35e-38 | 6.15e-01 | 0.0889 |
| 9146 | HGS | P9T-E | Human | Esophagus | ESCC | 2.18e-18 | 5.29e-01 | 0.1131 |
| 9146 | HGS | P10T-E | Human | Esophagus | ESCC | 1.71e-30 | 5.12e-01 | 0.116 |
| 9146 | HGS | P11T-E | Human | Esophagus | ESCC | 3.61e-24 | 1.33e+00 | 0.1426 |
| 9146 | HGS | P12T-E | Human | Esophagus | ESCC | 4.74e-42 | 7.31e-01 | 0.1122 |
| 9146 | HGS | P15T-E | Human | Esophagus | ESCC | 5.70e-32 | 7.26e-01 | 0.1149 |
| 9146 | HGS | P16T-E | Human | Esophagus | ESCC | 3.01e-33 | 5.75e-01 | 0.1153 |
| Page: 1 2 3 4 5 6 7 |
| Tissue | Expression Dynamics | Abbreviation |
| Esophagus | 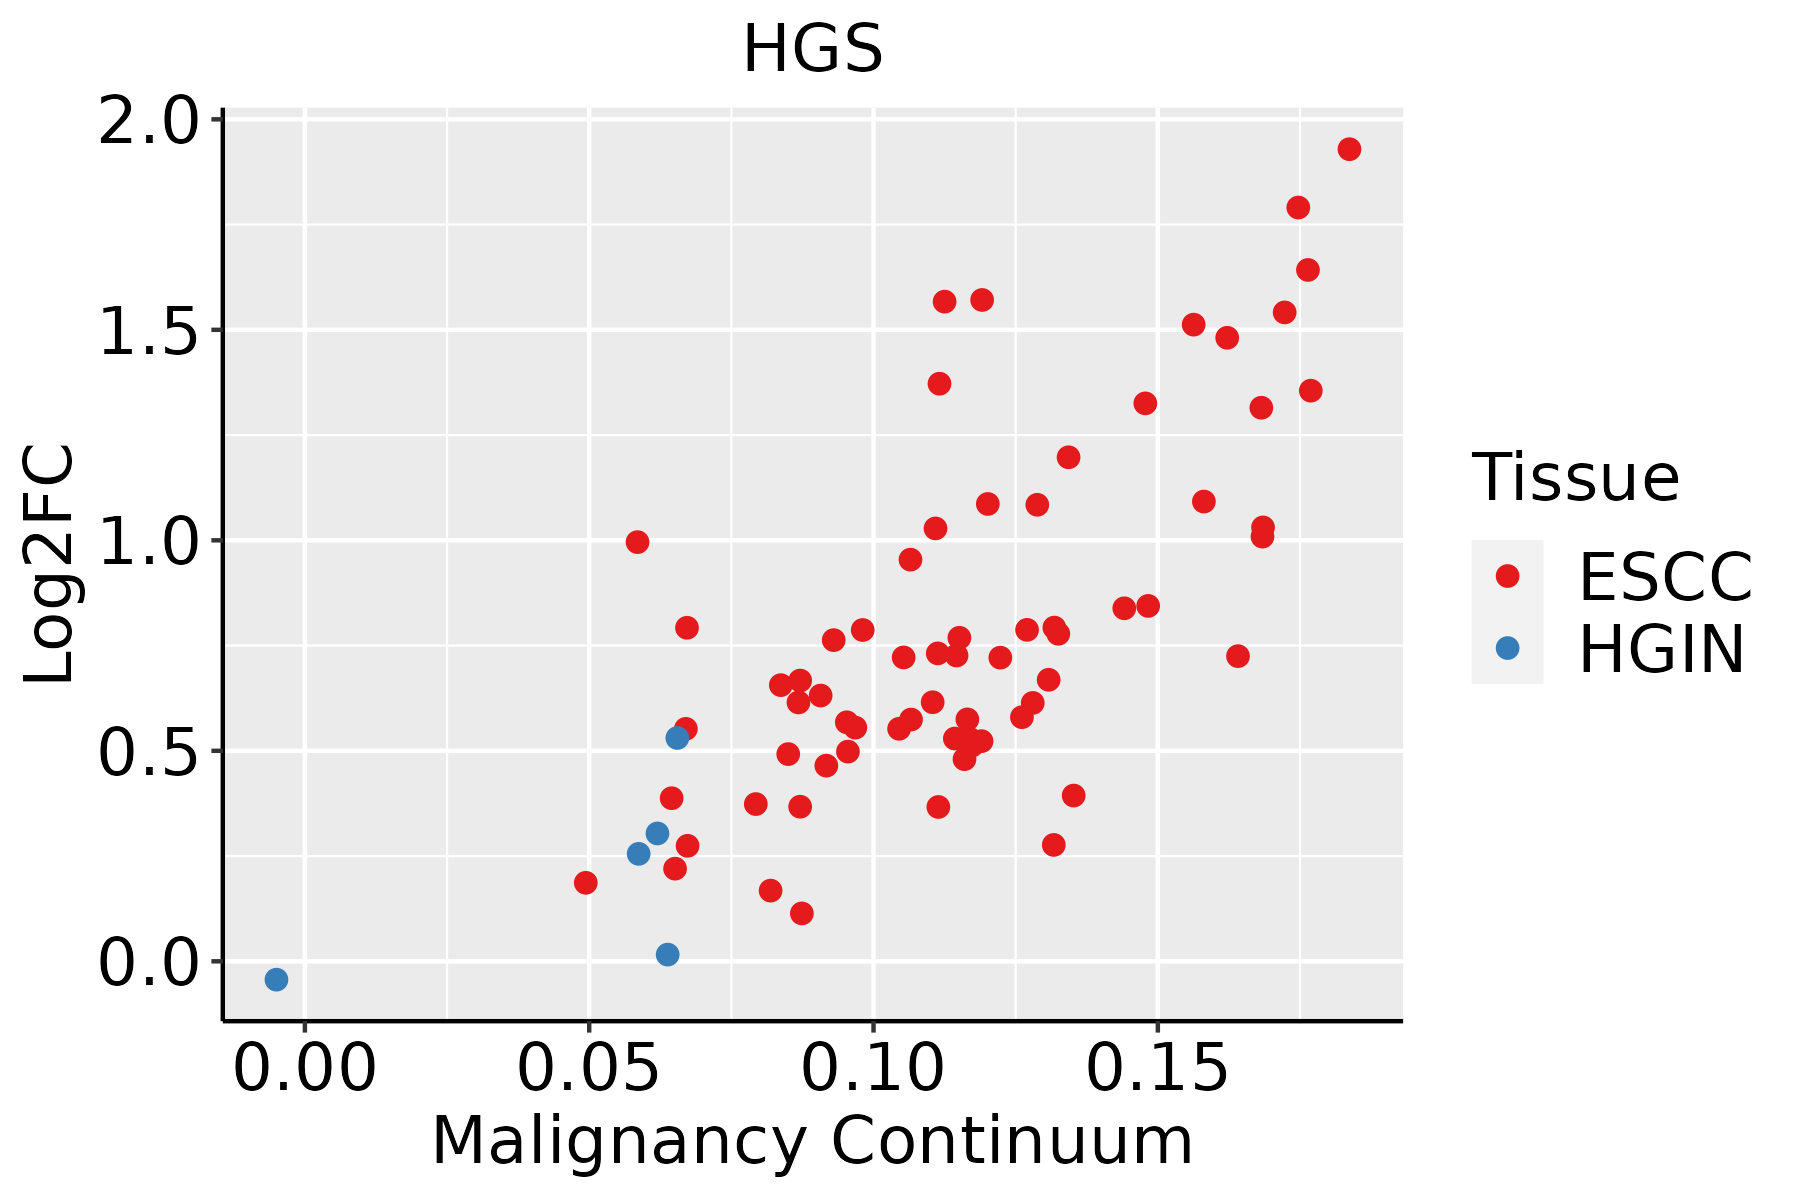 | ESCC: Esophageal squamous cell carcinoma |
| HGIN: High-grade intraepithelial neoplasias | ||
| LGIN: Low-grade intraepithelial neoplasias | ||
| Liver |  | HCC: Hepatocellular carcinoma |
| NAFLD: Non-alcoholic fatty liver disease | ||
| Oral Cavity | 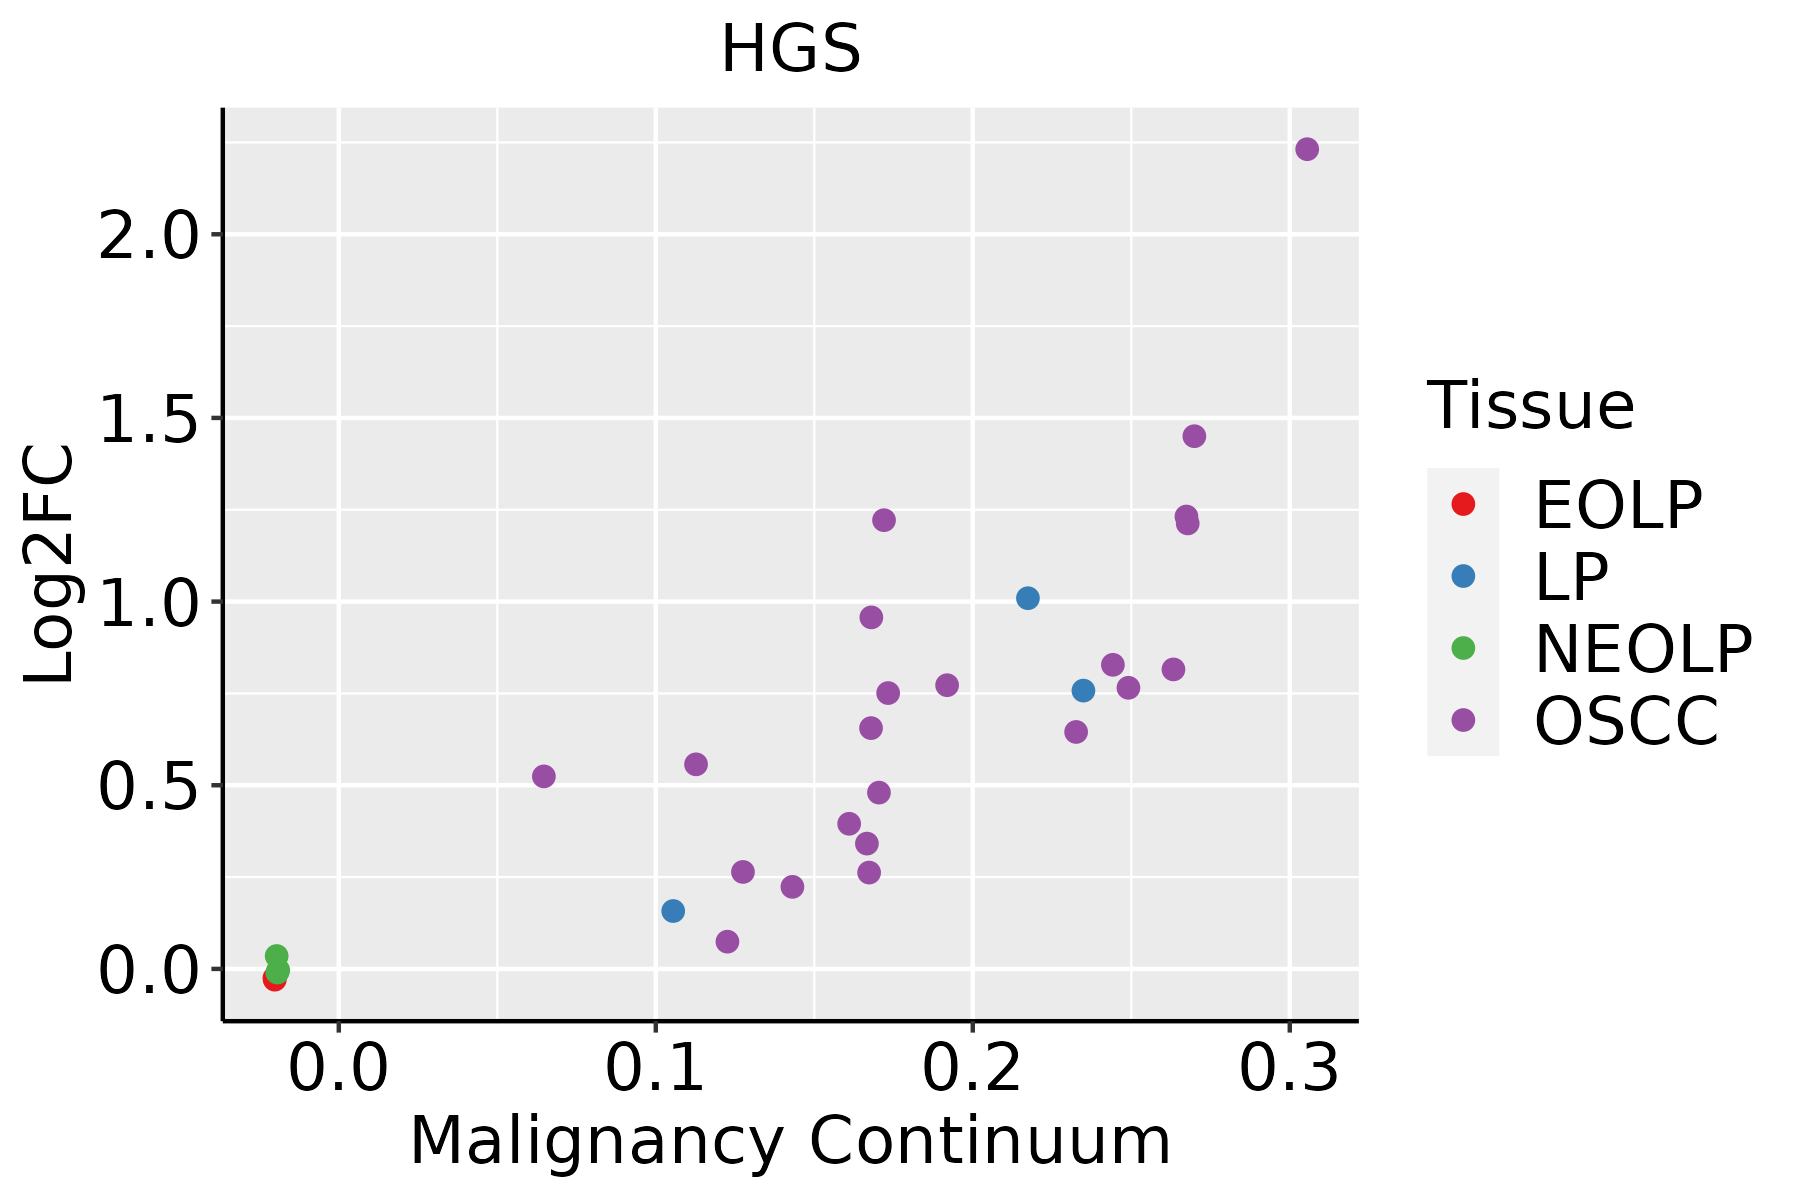 | EOLP: Erosive Oral lichen planus |
| LP: leukoplakia | ||
| NEOLP: Non-erosive oral lichen planus | ||
| OSCC: Oral squamous cell carcinoma | ||
| Skin | 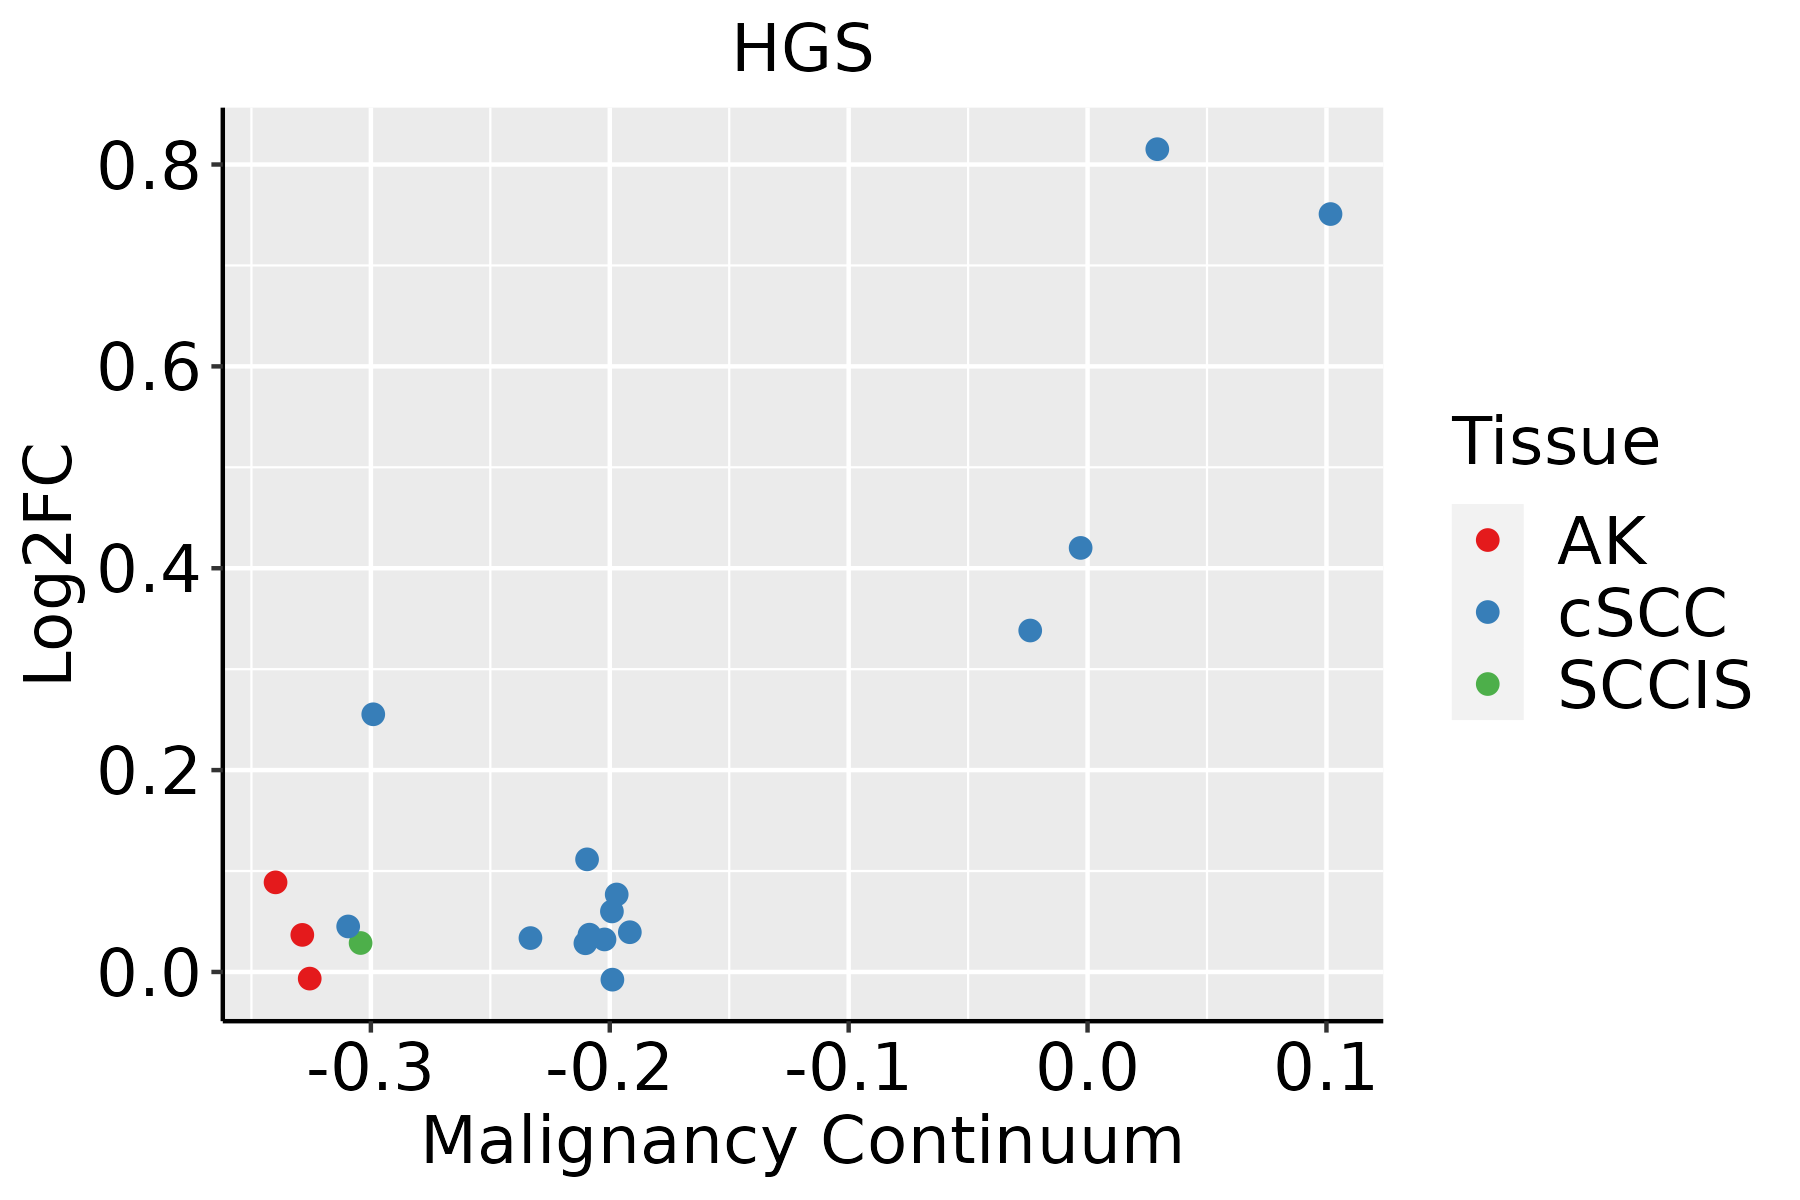 | AK: Actinic keratosis |
| cSCC: Cutaneous squamous cell carcinoma | ||
| SCCIS:squamous cell carcinoma in situ | ||
| Thyroid | 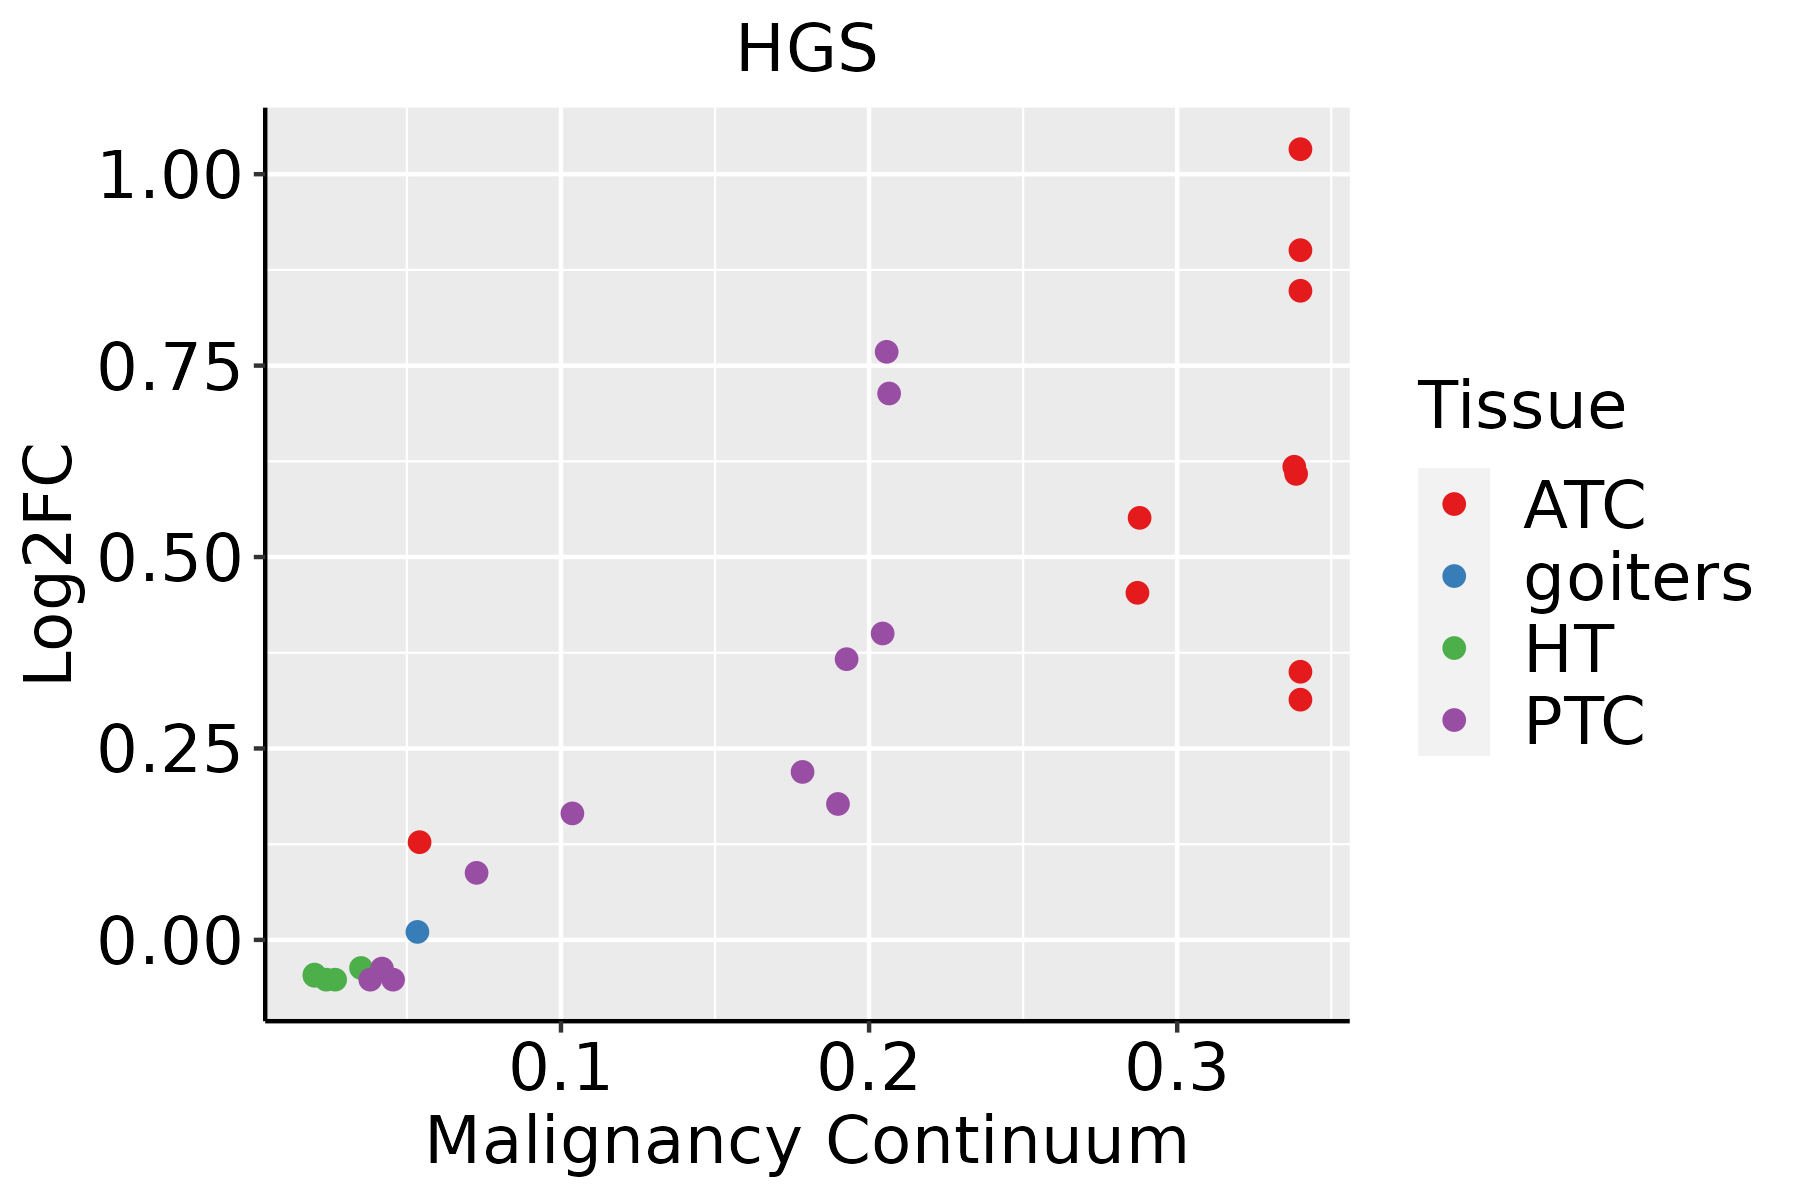 | ATC: Anaplastic thyroid cancer |
| HT: Hashimoto's thyroiditis | ||
| PTC: Papillary thyroid cancer |
| ∗log2FC in expression of this searched gene in stem-like cells from each diseased tissue sample relative to stem-like cells in normal samples in each tissue plotted against the malignancy continuum. Samples are colored based on if they are from different disease stage. |
Top |
Malignant transformation related pathway analysis |
| Find out the enriched GO biological processes and KEGG pathways involved in transition from healthy to precancer to cancer |
| Tissue | Disease Stage | Enriched GO biological Processes |
| Colorectum | AD |  |
| Colorectum | SER |  |
| Colorectum | MSS |  |
| Colorectum | MSI-H |  |
| Colorectum | FAP |  |
| ∗Top 15 enriched GO BP terms are showed in the bar plot of each disease state in each tissue. Each row represents a significant GO biological process which is colored according to the -log10(p.adjust). |
| Page: 1 2 3 4 5 6 7 8 9 |
| GO ID | Tissue | Disease Stage | Description | Gene Ratio | Bg Ratio | pvalue | p.adjust | Count |
| GO:004217627 | Esophagus | HGIN | regulation of protein catabolic process | 119/2587 | 391/18723 | 8.09e-18 | 2.43e-15 | 119 |
| GO:007259420 | Esophagus | HGIN | establishment of protein localization to organelle | 120/2587 | 422/18723 | 1.73e-15 | 4.00e-13 | 120 |
| GO:001623616 | Esophagus | HGIN | macroautophagy | 77/2587 | 291/18723 | 7.15e-09 | 4.61e-07 | 77 |
| GO:000660525 | Esophagus | HGIN | protein targeting | 78/2587 | 314/18723 | 1.08e-07 | 5.47e-06 | 78 |
| GO:001619710 | Esophagus | HGIN | endosomal transport | 57/2587 | 230/18723 | 5.74e-06 | 1.81e-04 | 57 |
| GO:00070328 | Esophagus | HGIN | endosome organization | 25/2587 | 82/18723 | 7.45e-05 | 1.69e-03 | 25 |
| GO:00362586 | Esophagus | HGIN | multivesicular body assembly | 13/2587 | 30/18723 | 7.76e-05 | 1.74e-03 | 13 |
| GO:00362577 | Esophagus | HGIN | multivesicular body organization | 13/2587 | 31/18723 | 1.17e-04 | 2.43e-03 | 13 |
| GO:00160509 | Esophagus | HGIN | vesicle organization | 65/2587 | 300/18723 | 1.24e-04 | 2.54e-03 | 65 |
| GO:000703416 | Esophagus | HGIN | vacuolar transport | 35/2587 | 157/18723 | 2.52e-03 | 2.51e-02 | 35 |
| GO:0072594110 | Esophagus | ESCC | establishment of protein localization to organelle | 311/8552 | 422/18723 | 3.02e-32 | 2.13e-29 | 311 |
| GO:0042176111 | Esophagus | ESCC | regulation of protein catabolic process | 280/8552 | 391/18723 | 8.65e-26 | 2.39e-23 | 280 |
| GO:001623617 | Esophagus | ESCC | macroautophagy | 216/8552 | 291/18723 | 1.94e-23 | 4.57e-21 | 216 |
| GO:0006605111 | Esophagus | ESCC | protein targeting | 229/8552 | 314/18723 | 4.93e-23 | 1.01e-20 | 229 |
| GO:001605014 | Esophagus | ESCC | vesicle organization | 211/8552 | 300/18723 | 2.85e-18 | 2.87e-16 | 211 |
| GO:001619715 | Esophagus | ESCC | endosomal transport | 168/8552 | 230/18723 | 2.28e-17 | 1.93e-15 | 168 |
| GO:000703417 | Esophagus | ESCC | vacuolar transport | 119/8552 | 157/18723 | 1.16e-14 | 6.30e-13 | 119 |
| GO:007190016 | Esophagus | ESCC | regulation of protein serine/threonine kinase activity | 227/8552 | 359/18723 | 1.12e-11 | 4.10e-10 | 227 |
| GO:003625714 | Esophagus | ESCC | multivesicular body organization | 30/8552 | 31/18723 | 1.04e-09 | 2.50e-08 | 30 |
| GO:003625814 | Esophagus | ESCC | multivesicular body assembly | 29/8552 | 30/18723 | 2.21e-09 | 4.99e-08 | 29 |
| Page: 1 2 3 4 5 6 7 8 9 10 |
| Pathway ID | Tissue | Disease Stage | Description | Gene Ratio | Bg Ratio | pvalue | p.adjust | qvalue | Count |
| hsa0414429 | Esophagus | HGIN | Endocytosis | 76/1383 | 251/8465 | 1.74e-08 | 3.34e-07 | 2.65e-07 | 76 |
| hsa04144113 | Esophagus | HGIN | Endocytosis | 76/1383 | 251/8465 | 1.74e-08 | 3.34e-07 | 2.65e-07 | 76 |
| hsa04144210 | Esophagus | ESCC | Endocytosis | 186/4205 | 251/8465 | 9.74e-16 | 4.66e-14 | 2.39e-14 | 186 |
| hsa032509 | Esophagus | ESCC | Viral life cycle - HIV-1 | 54/4205 | 63/8465 | 2.01e-09 | 2.17e-08 | 1.11e-08 | 54 |
| hsa0414530 | Esophagus | ESCC | Phagosome | 100/4205 | 152/8465 | 3.81e-05 | 1.72e-04 | 8.82e-05 | 100 |
| hsa0414437 | Esophagus | ESCC | Endocytosis | 186/4205 | 251/8465 | 9.74e-16 | 4.66e-14 | 2.39e-14 | 186 |
| hsa0325014 | Esophagus | ESCC | Viral life cycle - HIV-1 | 54/4205 | 63/8465 | 2.01e-09 | 2.17e-08 | 1.11e-08 | 54 |
| hsa04145114 | Esophagus | ESCC | Phagosome | 100/4205 | 152/8465 | 3.81e-05 | 1.72e-04 | 8.82e-05 | 100 |
| hsa0414422 | Liver | HCC | Endocytosis | 178/4020 | 251/8465 | 2.03e-14 | 5.22e-13 | 2.91e-13 | 178 |
| hsa032502 | Liver | HCC | Viral life cycle - HIV-1 | 46/4020 | 63/8465 | 3.25e-05 | 1.88e-04 | 1.04e-04 | 46 |
| hsa0414521 | Liver | HCC | Phagosome | 93/4020 | 152/8465 | 4.27e-04 | 1.88e-03 | 1.05e-03 | 93 |
| hsa0414432 | Liver | HCC | Endocytosis | 178/4020 | 251/8465 | 2.03e-14 | 5.22e-13 | 2.91e-13 | 178 |
| hsa0325011 | Liver | HCC | Viral life cycle - HIV-1 | 46/4020 | 63/8465 | 3.25e-05 | 1.88e-04 | 1.04e-04 | 46 |
| hsa0414531 | Liver | HCC | Phagosome | 93/4020 | 152/8465 | 4.27e-04 | 1.88e-03 | 1.05e-03 | 93 |
| hsa0414427 | Oral cavity | OSCC | Endocytosis | 174/3704 | 251/8465 | 9.42e-17 | 4.51e-15 | 2.29e-15 | 174 |
| hsa032508 | Oral cavity | OSCC | Viral life cycle - HIV-1 | 45/3704 | 63/8465 | 7.62e-06 | 3.59e-05 | 1.83e-05 | 45 |
| hsa0414528 | Oral cavity | OSCC | Phagosome | 88/3704 | 152/8465 | 2.83e-04 | 9.13e-04 | 4.65e-04 | 88 |
| hsa04144112 | Oral cavity | OSCC | Endocytosis | 174/3704 | 251/8465 | 9.42e-17 | 4.51e-15 | 2.29e-15 | 174 |
| hsa0325013 | Oral cavity | OSCC | Viral life cycle - HIV-1 | 45/3704 | 63/8465 | 7.62e-06 | 3.59e-05 | 1.83e-05 | 45 |
| hsa04145113 | Oral cavity | OSCC | Phagosome | 88/3704 | 152/8465 | 2.83e-04 | 9.13e-04 | 4.65e-04 | 88 |
| Page: 1 2 |
Top |
Cell-cell communication analysis |
| Identification of potential cell-cell interactions between two cell types and their ligand-receptor pairs for different disease states |
| Ligand | Receptor | LRpair | Pathway | Tissue | Disease Stage |
| Page: 1 |
Top |
Single-cell gene regulatory network inference analysis |
| Find out the significant the regulons (TFs) and the target genes of each regulon across cell types for different disease states |
| TF | Cell Type | Tissue | Disease Stage | Target Gene | RSS | Regulon Activity |
| ∗The dot plots of a searched regulon are shown for all cell subpopulations in each disease state of each tissue based on the regulon specific score inferred using pySCENIC and by calculating the average expression. |
| Page: 1 |
Top |
Somatic mutation of malignant transformation related genes |
| Annotation of somatic variants for genes involved in malignant transformation |
| Hugo Symbol | Variant Class | Variant Classification | dbSNP RS | HGVSc | HGVSp | HGVSp Short | SWISSPROT | BIOTYPE | SIFT | PolyPhen | Tumor Sample Barcode | Tissue | Histology | Sex | Age | Stage | Therapy Types | Drugs | Outcome |
| HGS | SNV | Missense_Mutation | novel | c.1531N>T | p.Ala511Ser | p.A511S | O14964 | protein_coding | deleterious(0.03) | probably_damaging(0.968) | TCGA-A2-A0YE-01 | Breast | breast invasive carcinoma | Female | <65 | I/II | Unspecific | Taxotere | SD |
| HGS | SNV | Missense_Mutation | rs761223362 | c.890N>T | p.Ser297Leu | p.S297L | O14964 | protein_coding | tolerated(0.31) | benign(0) | TCGA-AC-A23H-01 | Breast | breast invasive carcinoma | Female | >=65 | I/II | Unknown | Unknown | PD |
| HGS | SNV | Missense_Mutation | c.1604N>A | p.Arg535His | p.R535H | O14964 | protein_coding | deleterious(0) | probably_damaging(0.985) | TCGA-B6-A0RL-01 | Breast | breast invasive carcinoma | Female | <65 | I/II | Unknown | Unknown | SD | |
| HGS | SNV | Missense_Mutation | c.181N>T | p.Ala61Ser | p.A61S | O14964 | protein_coding | tolerated(0.06) | possibly_damaging(0.844) | TCGA-C8-A137-01 | Breast | breast invasive carcinoma | Female | <65 | I/II | Unknown | Unknown | PD | |
| HGS | SNV | Missense_Mutation | c.958N>A | p.Glu320Lys | p.E320K | O14964 | protein_coding | tolerated(0.09) | possibly_damaging(0.459) | TCGA-C8-A1HM-01 | Breast | breast invasive carcinoma | Female | >=65 | I/II | Chemotherapy | doxorubicin | CR | |
| HGS | SNV | Missense_Mutation | rs570671002 | c.1034N>A | p.Ser345Asn | p.S345N | O14964 | protein_coding | tolerated(0.08) | possibly_damaging(0.706) | TCGA-D8-A27K-01 | Breast | breast invasive carcinoma | Female | <65 | I/II | Chemotherapy | adriamycin+cyclophosphamid | SD |
| HGS | insertion | Frame_Shift_Ins | novel | c.1441_1442insG | p.Ala483GlyfsTer146 | p.A483Gfs*146 | O14964 | protein_coding | TCGA-BH-A18G-01 | Breast | breast invasive carcinoma | Female | >=65 | I/II | Unknown | Unknown | SD | ||
| HGS | SNV | Missense_Mutation | novel | c.310N>A | p.Val104Ile | p.V104I | O14964 | protein_coding | deleterious(0.03) | probably_damaging(0.997) | TCGA-2W-A8YY-01 | Cervix | cervical & endocervical cancer | Female | <65 | I/II | Chemotherapy | cisplatin | CR |
| HGS | SNV | Missense_Mutation | novel | c.1628N>A | p.Arg543Gln | p.R543Q | O14964 | protein_coding | tolerated(0.21) | possibly_damaging(0.791) | TCGA-2W-A8YY-01 | Cervix | cervical & endocervical cancer | Female | <65 | I/II | Chemotherapy | cisplatin | CR |
| HGS | SNV | Missense_Mutation | novel | c.1576N>A | p.Glu526Lys | p.E526K | O14964 | protein_coding | deleterious(0.03) | benign(0.343) | TCGA-DS-A1OB-01 | Cervix | cervical & endocervical cancer | Female | <65 | I/II | Chemotherapy | carboplatin | PD |
| Page: 1 2 3 4 5 6 7 8 |
Top |
Related drugs of malignant transformation related genes |
| Identification of chemicals and drugs interact with genes involved in malignant transfromation |
| (DGIdb 4.0) |
| Entrez ID | Symbol | Category | Interaction Types | Drug Claim Name | Drug Name | PMIDs |
| Page: 1 |

Copyright 2023-Present -The University of Texas Health Science Center at Houston |