
|
|||||
|
 | |
| |
| |
| |
| |
| |
|
Gene: HEYL |
Gene summary for HEYL |
| Gene information | Species | Human | Gene symbol | HEYL | Gene ID | 26508 |
| Gene name | hes related family bHLH transcription factor with YRPW motif like | |
| Gene Alias | HESR3 | |
| Cytomap | 1p34.2 | |
| Gene Type | protein-coding | GO ID | GO:0000122 | UniProtAcc | Q9NQ87 |
Top |
Malignant transformation analysis |
| Identification of the aberrant gene expression in precancerous and cancerous lesions by comparing the gene expression of stem-like cells in diseased tissues with normal stem cells |
| Entrez ID | Symbol | Replicates | Species | Organ | Tissue | Adj P-value | Log2FC | Malignancy |
| 26508 | HEYL | ATC12 | Human | Thyroid | ATC | 4.82e-02 | 1.44e-01 | 0.34 |
| 26508 | HEYL | ATC13 | Human | Thyroid | ATC | 4.66e-32 | 7.95e-01 | 0.34 |
| 26508 | HEYL | ATC4 | Human | Thyroid | ATC | 2.34e-04 | 1.87e-01 | 0.34 |
| 26508 | HEYL | ATC5 | Human | Thyroid | ATC | 6.03e-40 | 8.55e-01 | 0.34 |
| Page: 1 |
| Tissue | Expression Dynamics | Abbreviation |
| Thyroid | 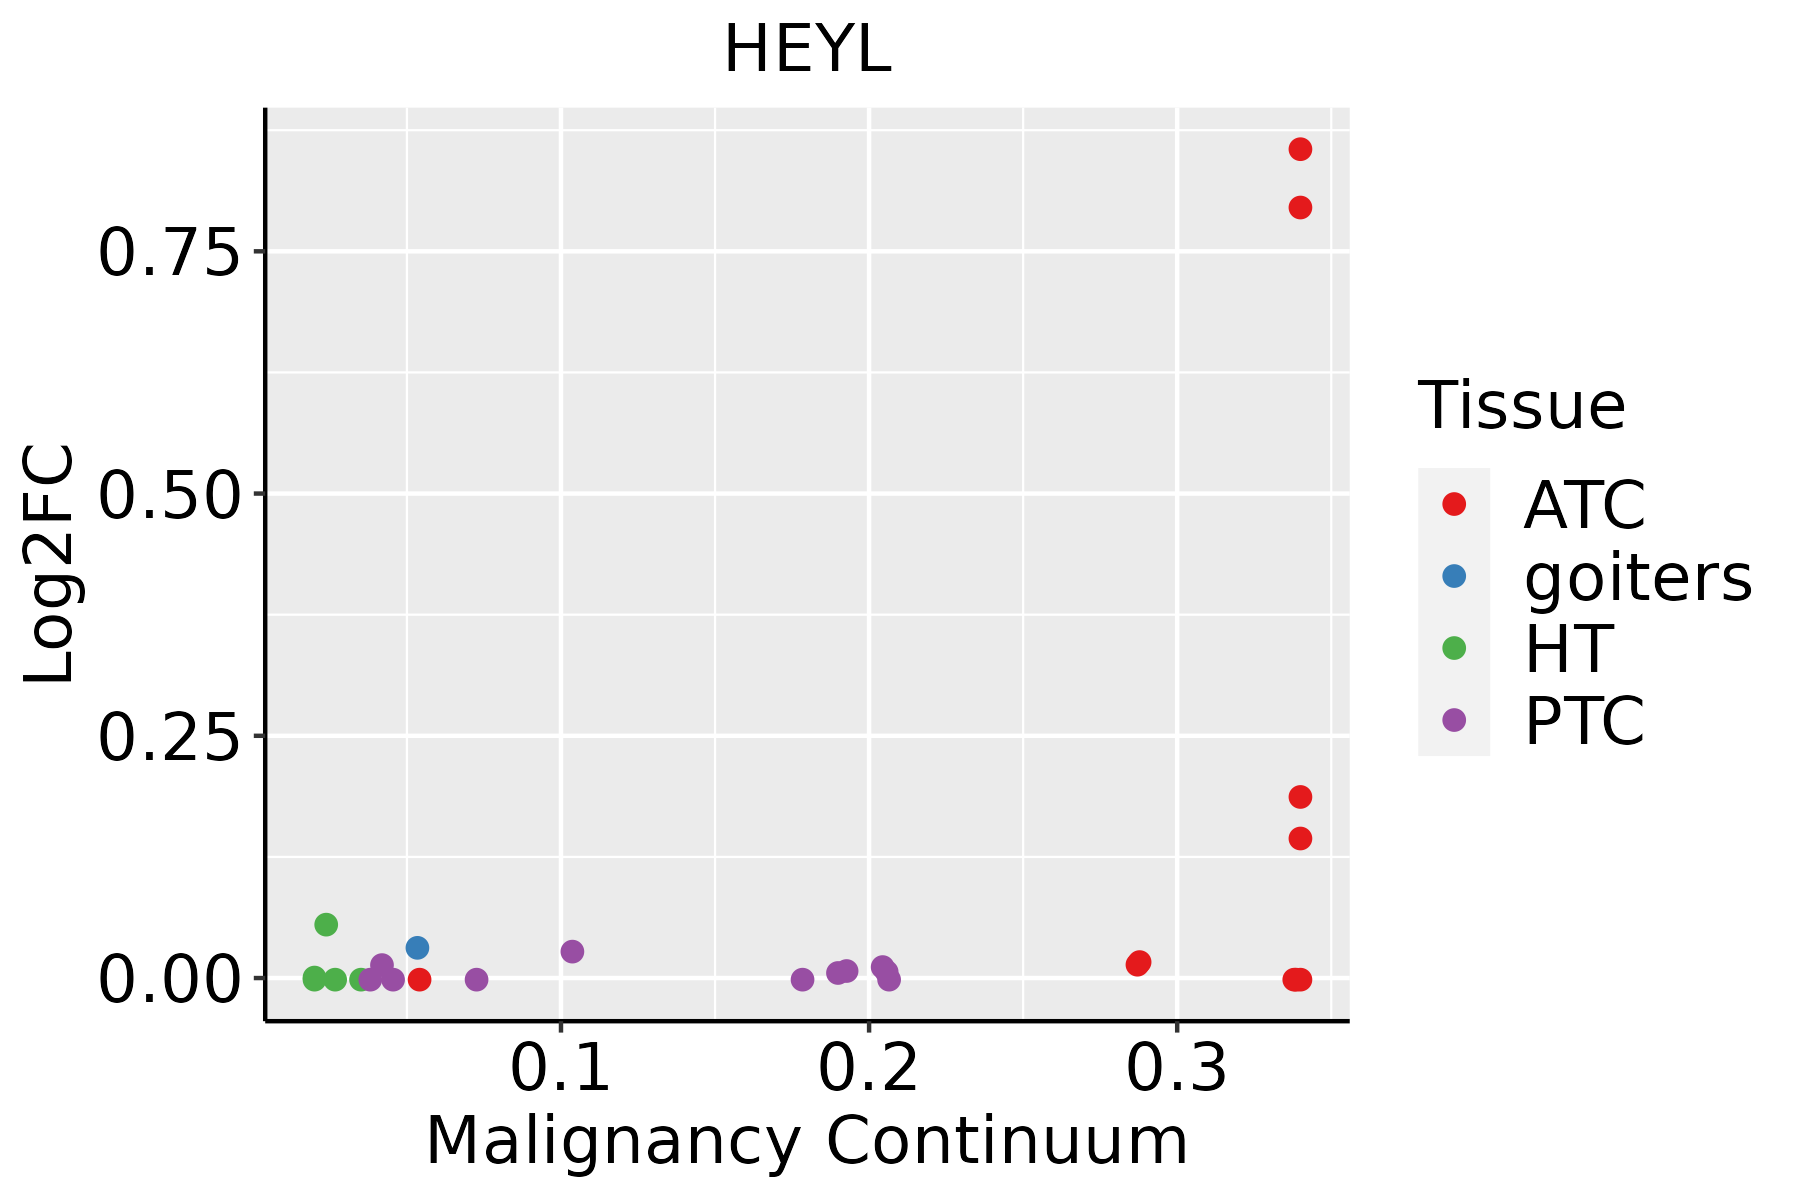 | ATC: Anaplastic thyroid cancer |
| HT: Hashimoto's thyroiditis | ||
| PTC: Papillary thyroid cancer |
| ∗log2FC in expression of this searched gene in stem-like cells from each diseased tissue sample relative to stem-like cells in normal samples in each tissue plotted against the malignancy continuum. Samples are colored based on if they are from different disease stage. |
Top |
Malignant transformation related pathway analysis |
| Find out the enriched GO biological processes and KEGG pathways involved in transition from healthy to precancer to cancer |
| Tissue | Disease Stage | Enriched GO biological Processes |
| Colorectum | AD |  |
| Colorectum | SER |  |
| Colorectum | MSS |  |
| Colorectum | MSI-H |  |
| Colorectum | FAP |  |
| ∗Top 15 enriched GO BP terms are showed in the bar plot of each disease state in each tissue. Each row represents a significant GO biological process which is colored according to the -log10(p.adjust). |
| Page: 1 2 3 4 5 6 7 8 9 |
| GO ID | Tissue | Disease Stage | Description | Gene Ratio | Bg Ratio | pvalue | p.adjust | Count |
| GO:0048545210 | Thyroid | ATC | response to steroid hormone | 168/6293 | 339/18723 | 7.21e-10 | 1.88e-08 | 168 |
| GO:000182222 | Thyroid | ATC | kidney development | 146/6293 | 293/18723 | 5.81e-09 | 1.28e-07 | 146 |
| GO:0030522112 | Thyroid | ATC | intracellular receptor signaling pathway | 134/6293 | 265/18723 | 7.58e-09 | 1.63e-07 | 134 |
| GO:000165522 | Thyroid | ATC | urogenital system development | 164/6293 | 338/18723 | 7.92e-09 | 1.70e-07 | 164 |
| GO:007200122 | Thyroid | ATC | renal system development | 149/6293 | 302/18723 | 9.48e-09 | 1.99e-07 | 149 |
| GO:000183722 | Thyroid | ATC | epithelial to mesenchymal transition | 87/6293 | 157/18723 | 1.50e-08 | 3.06e-07 | 87 |
| GO:005076723 | Thyroid | ATC | regulation of neurogenesis | 168/6293 | 364/18723 | 3.73e-07 | 5.48e-06 | 168 |
| GO:007138328 | Thyroid | ATC | cellular response to steroid hormone stimulus | 103/6293 | 204/18723 | 4.32e-07 | 6.30e-06 | 103 |
| GO:004876221 | Thyroid | ATC | mesenchymal cell differentiation | 116/6293 | 236/18723 | 5.08e-07 | 7.30e-06 | 116 |
| GO:003051826 | Thyroid | ATC | intracellular steroid hormone receptor signaling pathway | 65/6293 | 116/18723 | 5.58e-07 | 7.93e-06 | 65 |
| GO:006053724 | Thyroid | ATC | muscle tissue development | 181/6293 | 403/18723 | 1.27e-06 | 1.62e-05 | 181 |
| GO:006048521 | Thyroid | ATC | mesenchyme development | 136/6293 | 291/18723 | 2.04e-06 | 2.43e-05 | 136 |
| GO:005196014 | Thyroid | ATC | regulation of nervous system development | 195/6293 | 443/18723 | 2.62e-06 | 3.06e-05 | 195 |
| GO:0043401111 | Thyroid | ATC | steroid hormone mediated signaling pathway | 71/6293 | 136/18723 | 5.72e-06 | 6.07e-05 | 71 |
| GO:000327912 | Thyroid | ATC | cardiac septum development | 56/6293 | 103/18723 | 1.14e-05 | 1.11e-04 | 56 |
| GO:003314316 | Thyroid | ATC | regulation of intracellular steroid hormone receptor signaling pathway | 43/6293 | 74/18723 | 1.30e-05 | 1.25e-04 | 43 |
| GO:005109022 | Thyroid | ATC | regulation of DNA-binding transcription factor activity | 190/6293 | 440/18723 | 1.49e-05 | 1.39e-04 | 190 |
| GO:001470622 | Thyroid | ATC | striated muscle tissue development | 168/6293 | 384/18723 | 1.91e-05 | 1.73e-04 | 168 |
| GO:000320512 | Thyroid | ATC | cardiac chamber development | 79/6293 | 161/18723 | 3.39e-05 | 2.80e-04 | 79 |
| GO:00603171 | Thyroid | ATC | cardiac epithelial to mesenchymal transition | 22/6293 | 32/18723 | 5.14e-05 | 3.99e-04 | 22 |
| Page: 1 2 3 |
| Pathway ID | Tissue | Disease Stage | Description | Gene Ratio | Bg Ratio | pvalue | p.adjust | qvalue | Count |
| Page: 1 |
Top |
Cell-cell communication analysis |
| Identification of potential cell-cell interactions between two cell types and their ligand-receptor pairs for different disease states |
| Ligand | Receptor | LRpair | Pathway | Tissue | Disease Stage |
| Page: 1 |
Top |
Single-cell gene regulatory network inference analysis |
| Find out the significant the regulons (TFs) and the target genes of each regulon across cell types for different disease states |
| TF | Cell Type | Tissue | Disease Stage | Target Gene | RSS | Regulon Activity |
| HEYL | TREG | Esophagus | ADJ | YWHAH,ARIH2,VWCE, etc. | 1.21e-02 |  |
| HEYL | PERI | Prostate | ADJ | COL18A1,RGS5,PLXDC1, etc. | 7.69e-02 |  |
| HEYL | PERI | Prostate | BPH | COL18A1,RGS5,PLXDC1, etc. | 3.51e-01 |  |
| HEYL | PERI | Prostate | Tumor | COL18A1,RGS5,PLXDC1, etc. | 3.02e-01 |  |
| HEYL | MYOFIB | Stomach | ADJ | PDGFRB,FOXS1,COL18A1, etc. | 2.35e-01 |  |
| HEYL | MYOFIB | Stomach | CAG | PDGFRB,FOXS1,COL18A1, etc. | 2.76e-01 |  |
| HEYL | SMC | Stomach | CAG with IM | PDGFRB,FOXS1,COL18A1, etc. | 3.61e-01 |  |
| HEYL | MYOFIB | Stomach | CSG | PDGFRB,FOXS1,COL18A1, etc. | 1.01e-01 |  |
| HEYL | SMC | Stomach | CSG | PDGFRB,FOXS1,COL18A1, etc. | 2.85e-01 | |
| HEYL | MYOFIB | Stomach | GC | PDGFRB,FOXS1,COL18A1, etc. | 4.25e-01 |  |
| ∗The dot plots of a searched regulon are shown for all cell subpopulations in each disease state of each tissue based on the regulon specific score inferred using pySCENIC and by calculating the average expression. |
| Page: 1 2 |
Top |
Somatic mutation of malignant transformation related genes |
| Annotation of somatic variants for genes involved in malignant transformation |
| Hugo Symbol | Variant Class | Variant Classification | dbSNP RS | HGVSc | HGVSp | HGVSp Short | SWISSPROT | BIOTYPE | SIFT | PolyPhen | Tumor Sample Barcode | Tissue | Histology | Sex | Age | Stage | Therapy Types | Drugs | Outcome |
| HEYL | SNV | Missense_Mutation | novel | c.806G>C | p.Ser269Thr | p.S269T | Q9NQ87 | protein_coding | tolerated_low_confidence(0.09) | benign(0.015) | TCGA-BH-A0HO-01 | Breast | breast invasive carcinoma | Female | <65 | I/II | Chemotherapy | cyclophosphamide | SD |
| HEYL | SNV | Missense_Mutation | c.537N>G | p.Phe179Leu | p.F179L | Q9NQ87 | protein_coding | deleterious(0.03) | benign(0.119) | TCGA-GM-A2D9-01 | Breast | breast invasive carcinoma | Female | >=65 | I/II | Hormone Therapy | arimidex | SD | |
| HEYL | SNV | Missense_Mutation | novel | c.164N>A | p.Arg55His | p.R55H | Q9NQ87 | protein_coding | deleterious(0.02) | probably_damaging(0.999) | TCGA-OL-A66J-01 | Breast | breast invasive carcinoma | Female | >=65 | I/II | Unknown | Unknown | SD |
| HEYL | SNV | Missense_Mutation | novel | c.949T>C | p.Ser317Pro | p.S317P | Q9NQ87 | protein_coding | tolerated_low_confidence(0.06) | benign(0.001) | TCGA-C5-A902-01 | Cervix | cervical & endocervical cancer | Female | <65 | I/II | Chemotherapy | cisplatin | SD |
| HEYL | SNV | Missense_Mutation | novel | c.196T>G | p.Leu66Val | p.L66V | Q9NQ87 | protein_coding | deleterious(0.03) | probably_damaging(0.996) | TCGA-FU-A3HZ-01 | Cervix | cervical & endocervical cancer | Female | <65 | I/II | Chemotherapy | cisplatin | CR |
| HEYL | SNV | Missense_Mutation | c.422N>A | p.Arg141His | p.R141H | Q9NQ87 | protein_coding | tolerated(0.25) | benign(0.012) | TCGA-LP-A7HU-01 | Cervix | cervical & endocervical cancer | Female | <65 | I/II | Unknown | Unknown | SD | |
| HEYL | SNV | Missense_Mutation | c.443G>A | p.Arg148His | p.R148H | Q9NQ87 | protein_coding | deleterious(0) | probably_damaging(0.998) | TCGA-A6-5661-01 | Colorectum | colon adenocarcinoma | Female | >=65 | I/II | Unknown | Unknown | SD | |
| HEYL | SNV | Missense_Mutation | c.764N>T | p.Ala255Val | p.A255V | Q9NQ87 | protein_coding | tolerated(0.06) | benign(0.005) | TCGA-A6-6653-01 | Colorectum | colon adenocarcinoma | Male | >=65 | I/II | Unknown | Unknown | SD | |
| HEYL | SNV | Missense_Mutation | rs747977443 | c.442C>T | p.Arg148Cys | p.R148C | Q9NQ87 | protein_coding | deleterious(0.02) | possibly_damaging(0.852) | TCGA-A6-6781-01 | Colorectum | colon adenocarcinoma | Male | <65 | III/IV | Chemotherapy | oxaliplatin | SD |
| HEYL | SNV | Missense_Mutation | rs766168978 | c.202N>T | p.Arg68Cys | p.R68C | Q9NQ87 | protein_coding | deleterious(0.01) | benign(0.334) | TCGA-AA-3947-01 | Colorectum | colon adenocarcinoma | Female | <65 | I/II | Unknown | Unknown | SD |
| Page: 1 2 3 4 |
Top |
Related drugs of malignant transformation related genes |
| Identification of chemicals and drugs interact with genes involved in malignant transfromation |
| (DGIdb 4.0) |
| Entrez ID | Symbol | Category | Interaction Types | Drug Claim Name | Drug Name | PMIDs |
| Page: 1 |

Copyright 2023-Present -The University of Texas Health Science Center at Houston |