
|
|||||
|
 | |
| |
| |
| |
| |
| |
|
Gene: HEY2 |
Gene summary for HEY2 |
| Gene information | Species | Human | Gene symbol | HEY2 | Gene ID | 23493 |
| Gene name | hes related family bHLH transcription factor with YRPW motif 2 | |
| Gene Alias | CHF1 | |
| Cytomap | 6q22.31 | |
| Gene Type | protein-coding | GO ID | GO:0000003 | UniProtAcc | Q9UBP5 |
Top |
Malignant transformation analysis |
| Identification of the aberrant gene expression in precancerous and cancerous lesions by comparing the gene expression of stem-like cells in diseased tissues with normal stem cells |
| Entrez ID | Symbol | Replicates | Species | Organ | Tissue | Adj P-value | Log2FC | Malignancy |
| 23493 | HEY2 | P2T-E | Human | Esophagus | ESCC | 4.80e-09 | 1.82e-01 | 0.1177 |
| 23493 | HEY2 | P4T-E | Human | Esophagus | ESCC | 2.39e-03 | 1.89e-01 | 0.1323 |
| 23493 | HEY2 | P10T-E | Human | Esophagus | ESCC | 8.40e-04 | 7.52e-02 | 0.116 |
| 23493 | HEY2 | P24T-E | Human | Esophagus | ESCC | 4.01e-04 | 8.24e-02 | 0.1287 |
| 23493 | HEY2 | P26T-E | Human | Esophagus | ESCC | 2.57e-12 | 3.06e-01 | 0.1276 |
| 23493 | HEY2 | P27T-E | Human | Esophagus | ESCC | 4.30e-10 | 1.92e-01 | 0.1055 |
| 23493 | HEY2 | P39T-E | Human | Esophagus | ESCC | 1.66e-02 | 8.85e-02 | 0.0894 |
| 23493 | HEY2 | P42T-E | Human | Esophagus | ESCC | 1.16e-02 | 1.32e-01 | 0.1175 |
| 23493 | HEY2 | P44T-E | Human | Esophagus | ESCC | 1.45e-03 | 1.36e-01 | 0.1096 |
| 23493 | HEY2 | P48T-E | Human | Esophagus | ESCC | 1.97e-10 | 2.43e-01 | 0.0959 |
| 23493 | HEY2 | P52T-E | Human | Esophagus | ESCC | 1.59e-02 | 5.82e-02 | 0.1555 |
| 23493 | HEY2 | P54T-E | Human | Esophagus | ESCC | 1.76e-11 | 3.33e-01 | 0.0975 |
| 23493 | HEY2 | P57T-E | Human | Esophagus | ESCC | 2.54e-04 | 6.03e-02 | 0.0926 |
| 23493 | HEY2 | P62T-E | Human | Esophagus | ESCC | 6.36e-17 | 3.08e-01 | 0.1302 |
| 23493 | HEY2 | P74T-E | Human | Esophagus | ESCC | 1.86e-16 | 5.57e-01 | 0.1479 |
| 23493 | HEY2 | P76T-E | Human | Esophagus | ESCC | 4.78e-24 | 5.38e-01 | 0.1207 |
| 23493 | HEY2 | P80T-E | Human | Esophagus | ESCC | 7.71e-05 | 1.55e-01 | 0.155 |
| 23493 | HEY2 | P107T-E | Human | Esophagus | ESCC | 1.36e-08 | 2.08e-01 | 0.171 |
| 23493 | HEY2 | P130T-E | Human | Esophagus | ESCC | 4.44e-08 | 1.79e-01 | 0.1676 |
| 23493 | HEY2 | HCC1 | Human | Liver | HCC | 4.94e-07 | 1.69e+00 | 0.5336 |
| Page: 1 2 |
| Tissue | Expression Dynamics | Abbreviation |
| Esophagus | 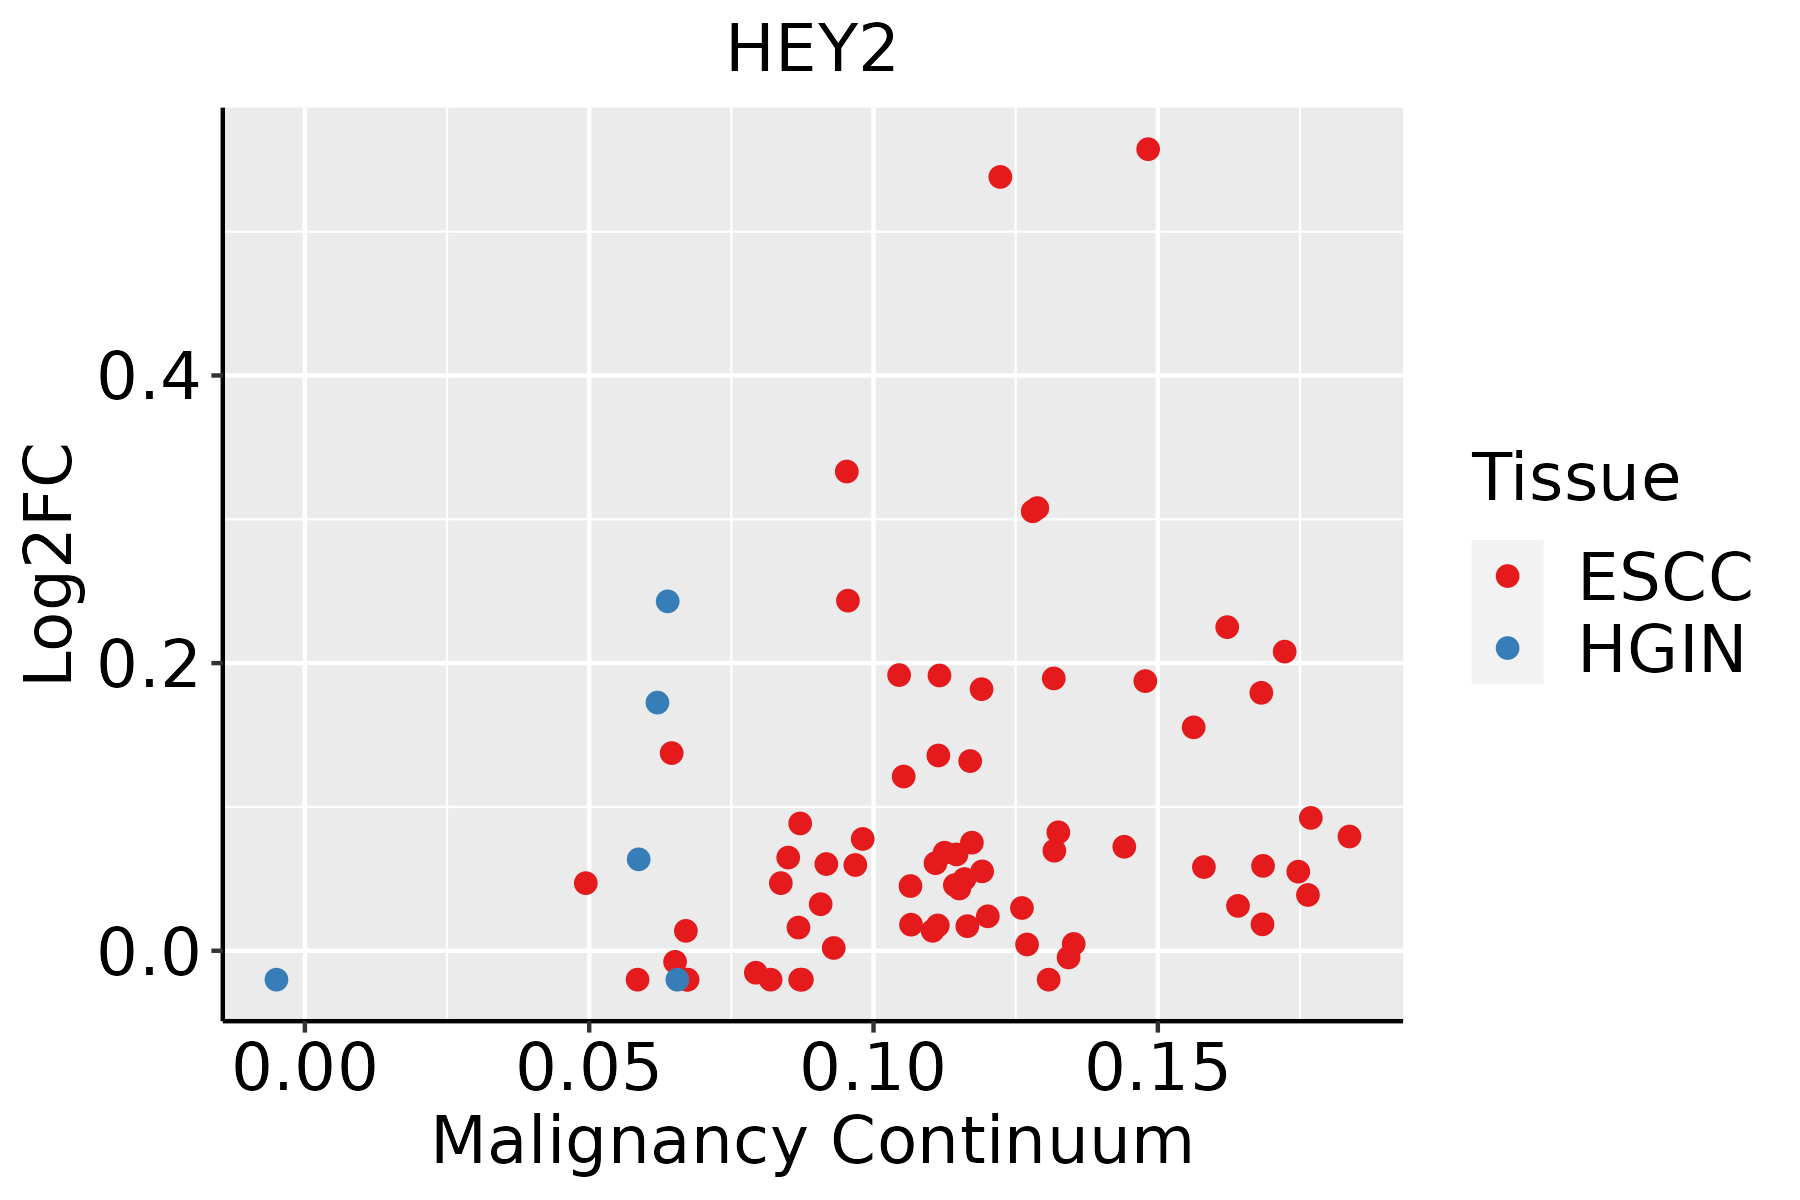 | ESCC: Esophageal squamous cell carcinoma |
| HGIN: High-grade intraepithelial neoplasias | ||
| LGIN: Low-grade intraepithelial neoplasias | ||
| Liver | 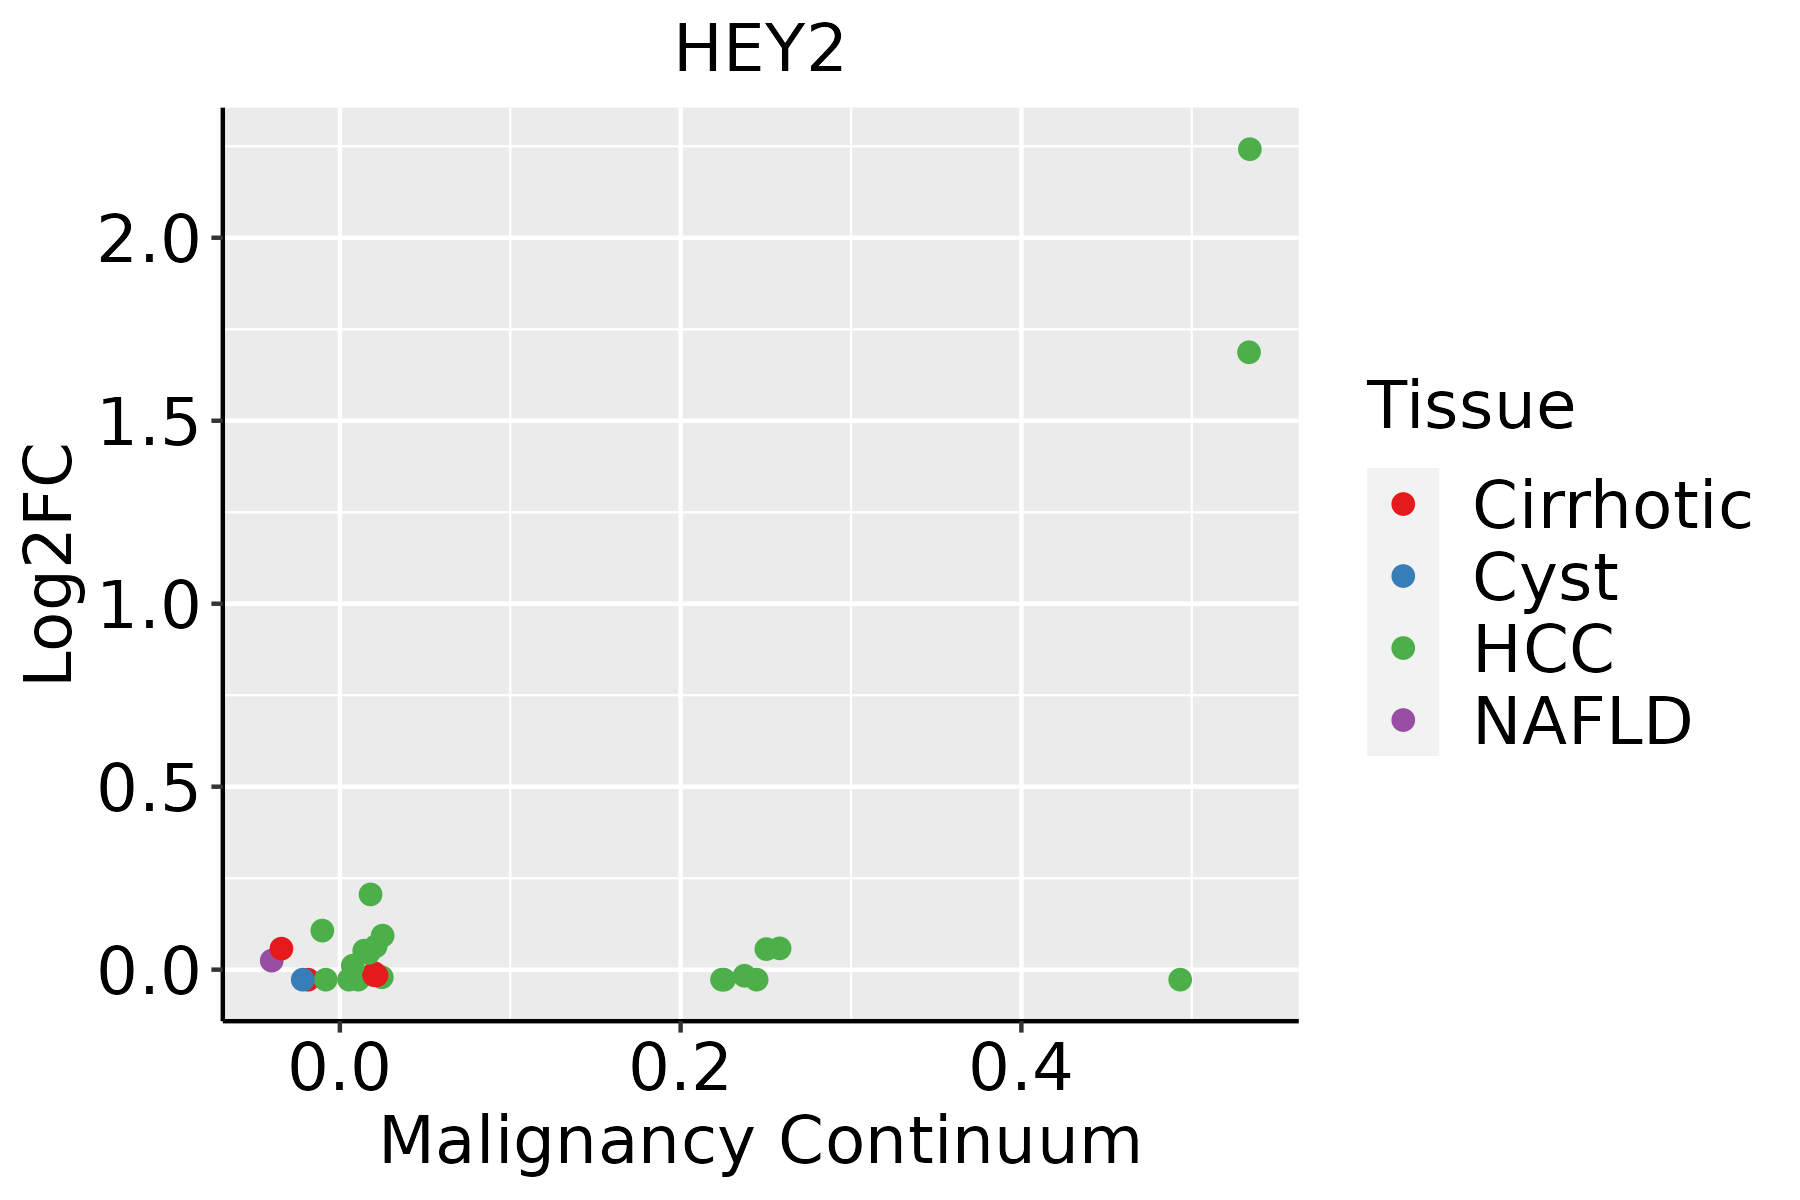 | HCC: Hepatocellular carcinoma |
| NAFLD: Non-alcoholic fatty liver disease | ||
| Thyroid |  | ATC: Anaplastic thyroid cancer |
| HT: Hashimoto's thyroiditis | ||
| PTC: Papillary thyroid cancer |
| ∗log2FC in expression of this searched gene in stem-like cells from each diseased tissue sample relative to stem-like cells in normal samples in each tissue plotted against the malignancy continuum. Samples are colored based on if they are from different disease stage. |
Top |
Malignant transformation related pathway analysis |
| Find out the enriched GO biological processes and KEGG pathways involved in transition from healthy to precancer to cancer |
| Tissue | Disease Stage | Enriched GO biological Processes |
| Colorectum | AD |  |
| Colorectum | SER |  |
| Colorectum | MSS |  |
| Colorectum | MSI-H |  |
| Colorectum | FAP |  |
| ∗Top 15 enriched GO BP terms are showed in the bar plot of each disease state in each tissue. Each row represents a significant GO biological process which is colored according to the -log10(p.adjust). |
| Page: 1 2 3 4 5 6 7 8 9 |
| GO ID | Tissue | Disease Stage | Description | Gene Ratio | Bg Ratio | pvalue | p.adjust | Count |
| GO:0051098111 | Esophagus | ESCC | regulation of binding | 251/8552 | 363/18723 | 6.73e-20 | 8.46e-18 | 251 |
| GO:000170119 | Esophagus | ESCC | in utero embryonic development | 243/8552 | 367/18723 | 1.00e-15 | 6.86e-14 | 243 |
| GO:0051101111 | Esophagus | ESCC | regulation of DNA binding | 84/8552 | 118/18723 | 1.64e-08 | 3.21e-07 | 84 |
| GO:0051100111 | Esophagus | ESCC | negative regulation of binding | 109/8552 | 162/18723 | 2.10e-08 | 4.03e-07 | 109 |
| GO:0001890110 | Esophagus | ESCC | placenta development | 98/8552 | 144/18723 | 4.46e-08 | 8.11e-07 | 98 |
| GO:0061458110 | Esophagus | ESCC | reproductive system development | 247/8552 | 427/18723 | 2.24e-07 | 3.42e-06 | 247 |
| GO:004860818 | Esophagus | ESCC | reproductive structure development | 245/8552 | 424/18723 | 2.82e-07 | 4.14e-06 | 245 |
| GO:000854410 | Esophagus | ESCC | epidermis development | 193/8552 | 324/18723 | 2.87e-07 | 4.19e-06 | 193 |
| GO:00063673 | Esophagus | ESCC | transcription initiation from RNA polymerase II promoter | 56/8552 | 77/18723 | 1.30e-06 | 1.59e-05 | 56 |
| GO:000635211 | Esophagus | ESCC | DNA-templated transcription, initiation | 86/8552 | 130/18723 | 1.88e-06 | 2.19e-05 | 86 |
| GO:000189219 | Esophagus | ESCC | embryonic placenta development | 57/8552 | 82/18723 | 1.06e-05 | 1.01e-04 | 57 |
| GO:000991310 | Esophagus | ESCC | epidermal cell differentiation | 122/8552 | 202/18723 | 1.69e-05 | 1.51e-04 | 122 |
| GO:00072197 | Esophagus | ESCC | Notch signaling pathway | 106/8552 | 172/18723 | 1.74e-05 | 1.55e-04 | 106 |
| GO:00456826 | Esophagus | ESCC | regulation of epidermis development | 46/8552 | 65/18723 | 3.65e-05 | 2.97e-04 | 46 |
| GO:005076710 | Esophagus | ESCC | regulation of neurogenesis | 203/8552 | 364/18723 | 6.10e-05 | 4.68e-04 | 203 |
| GO:0045746 | Esophagus | ESCC | negative regulation of Notch signaling pathway | 28/8552 | 36/18723 | 8.62e-05 | 6.22e-04 | 28 |
| GO:00456046 | Esophagus | ESCC | regulation of epidermal cell differentiation | 41/8552 | 58/18723 | 1.00e-04 | 7.10e-04 | 41 |
| GO:00018378 | Esophagus | ESCC | epithelial to mesenchymal transition | 95/8552 | 157/18723 | 1.25e-04 | 8.56e-04 | 95 |
| GO:00433924 | Esophagus | ESCC | negative regulation of DNA binding | 37/8552 | 52/18723 | 1.75e-04 | 1.14e-03 | 37 |
| GO:00602603 | Esophagus | ESCC | regulation of transcription initiation from RNA polymerase II promoter | 25/8552 | 33/18723 | 4.30e-04 | 2.43e-03 | 25 |
| Page: 1 2 3 4 5 6 7 8 9 |
| Pathway ID | Tissue | Disease Stage | Description | Gene Ratio | Bg Ratio | pvalue | p.adjust | qvalue | Count |
| hsa0516510 | Esophagus | ESCC | Human papillomavirus infection | 215/4205 | 331/8465 | 7.86e-09 | 7.12e-08 | 3.65e-08 | 215 |
| hsa0516515 | Esophagus | ESCC | Human papillomavirus infection | 215/4205 | 331/8465 | 7.86e-09 | 7.12e-08 | 3.65e-08 | 215 |
| hsa051652 | Liver | HCC | Human papillomavirus infection | 188/4020 | 331/8465 | 3.34e-04 | 1.49e-03 | 8.29e-04 | 188 |
| hsa051653 | Liver | HCC | Human papillomavirus infection | 188/4020 | 331/8465 | 3.34e-04 | 1.49e-03 | 8.29e-04 | 188 |
| Page: 1 |
Top |
Cell-cell communication analysis |
| Identification of potential cell-cell interactions between two cell types and their ligand-receptor pairs for different disease states |
| Ligand | Receptor | LRpair | Pathway | Tissue | Disease Stage |
| Page: 1 |
Top |
Single-cell gene regulatory network inference analysis |
| Find out the significant the regulons (TFs) and the target genes of each regulon across cell types for different disease states |
| TF | Cell Type | Tissue | Disease Stage | Target Gene | RSS | Regulon Activity |
| HEY2 | MSC.ADIPO | Breast | ADJ | CYSTM1,CLDN14,HEY1, etc. | 1.39e-01 |  |
| HEY2 | MSC.ADIPO | Breast | Healthy | CYSTM1,CLDN14,HEY1, etc. | 2.63e-01 |  |
| HEY2 | MVA | Breast | IDC | CYSTM1,CLDN14,HEY1, etc. | 1.07e-02 |  |
| HEY2 | MSC.ADIPO | Breast | Precancer | CYSTM1,CLDN14,HEY1, etc. | 1.46e-01 |  |
| HEY2 | PERI | Cervix | ADJ | MUSTN1,NOTCH3,AOC3, etc. | 3.53e-01 |  |
| HEY2 | MYOFIB | Cervix | HSIL_HPV | MUSTN1,NOTCH3,AOC3, etc. | 1.52e-01 |  |
| HEY2 | PERI | Cervix | HSIL_HPV | MUSTN1,NOTCH3,AOC3, etc. | 2.60e-02 | |
| HEY2 | PERI | Endometrium | ADJ | S100A4,GJA5,PPP1R14A, etc. | 3.29e-01 |  |
| HEY2 | PERI | Endometrium | AEH | S100A4,GJA5,PPP1R14A, etc. | 3.30e-01 |  |
| HEY2 | PERI | Endometrium | EEC | S100A4,GJA5,PPP1R14A, etc. | 4.06e-01 |  |
| ∗The dot plots of a searched regulon are shown for all cell subpopulations in each disease state of each tissue based on the regulon specific score inferred using pySCENIC and by calculating the average expression. |
| Page: 1 2 3 |
Top |
Somatic mutation of malignant transformation related genes |
| Annotation of somatic variants for genes involved in malignant transformation |
| Hugo Symbol | Variant Class | Variant Classification | dbSNP RS | HGVSc | HGVSp | HGVSp Short | SWISSPROT | BIOTYPE | SIFT | PolyPhen | Tumor Sample Barcode | Tissue | Histology | Sex | Age | Stage | Therapy Types | Drugs | Outcome |
| HEY2 | SNV | Missense_Mutation | novel | c.215G>A | p.Arg72Lys | p.R72K | Q9UBP5 | protein_coding | deleterious(0.03) | benign(0.287) | TCGA-AN-A046-01 | Breast | breast invasive carcinoma | Female | >=65 | I/II | Unknown | Unknown | SD |
| HEY2 | SNV | Missense_Mutation | c.638N>T | p.Ser213Phe | p.S213F | Q9UBP5 | protein_coding | deleterious(0.01) | benign(0.094) | TCGA-AN-A0FT-01 | Breast | breast invasive carcinoma | Female | <65 | I/II | Unknown | Unknown | SD | |
| HEY2 | SNV | Missense_Mutation | rs769963246 | c.401N>T | p.Ala134Val | p.A134V | Q9UBP5 | protein_coding | tolerated(0.28) | possibly_damaging(0.806) | TCGA-D8-A1J8-01 | Breast | breast invasive carcinoma | Female | >=65 | I/II | Hormone Therapy | nolvadex | SD |
| HEY2 | SNV | Missense_Mutation | c.404G>A | p.Arg135Gln | p.R135Q | Q9UBP5 | protein_coding | deleterious(0) | probably_damaging(0.919) | TCGA-E2-A1LA-01 | Breast | breast invasive carcinoma | Female | <65 | I/II | Hormone Therapy | arimidex | SD | |
| HEY2 | SNV | Missense_Mutation | c.6N>C | p.Lys2Asn | p.K2N | Q9UBP5 | protein_coding | deleterious(0) | probably_damaging(0.986) | TCGA-EK-A2R8-01 | Cervix | cervical & endocervical cancer | Female | <65 | I/II | Unknown | Unknown | SD | |
| HEY2 | SNV | Missense_Mutation | c.454N>T | p.Arg152Trp | p.R152W | Q9UBP5 | protein_coding | deleterious(0) | probably_damaging(0.995) | TCGA-AA-3663-01 | Colorectum | colon adenocarcinoma | Male | <65 | I/II | Unknown | Unknown | SD | |
| HEY2 | SNV | Missense_Mutation | c.490N>T | p.Arg164Trp | p.R164W | Q9UBP5 | protein_coding | deleterious(0) | probably_damaging(0.971) | TCGA-AA-3685-01 | Colorectum | colon adenocarcinoma | Male | >=65 | I/II | Unknown | Unknown | SD | |
| HEY2 | SNV | Missense_Mutation | c.340N>A | p.Ala114Thr | p.A114T | Q9UBP5 | protein_coding | deleterious(0) | benign(0.07) | TCGA-AA-3947-01 | Colorectum | colon adenocarcinoma | Female | <65 | I/II | Unknown | Unknown | SD | |
| HEY2 | SNV | Missense_Mutation | novel | c.469N>A | p.Leu157Ile | p.L157I | Q9UBP5 | protein_coding | deleterious(0) | probably_damaging(0.999) | TCGA-AG-A002-01 | Colorectum | rectum adenocarcinoma | Male | <65 | I/II | Unknown | Unknown | SD |
| HEY2 | SNV | Missense_Mutation | rs769963246 | c.401N>T | p.Ala134Val | p.A134V | Q9UBP5 | protein_coding | tolerated(0.28) | possibly_damaging(0.806) | TCGA-AG-A02N-01 | Colorectum | rectum adenocarcinoma | Male | >=65 | I/II | Chemotherapy | folinic | CR |
| Page: 1 2 3 4 5 |
Top |
Related drugs of malignant transformation related genes |
| Identification of chemicals and drugs interact with genes involved in malignant transfromation |
| (DGIdb 4.0) |
| Entrez ID | Symbol | Category | Interaction Types | Drug Claim Name | Drug Name | PMIDs |
| Page: 1 |

Copyright 2023-Present -The University of Texas Health Science Center at Houston |