
|
|||||
|
 | |
| |
| |
| |
| |
| |
|
Gene: HEY1 |
Gene summary for HEY1 |
| Gene information | Species | Human | Gene symbol | HEY1 | Gene ID | 23462 |
| Gene name | hes related family bHLH transcription factor with YRPW motif 1 | |
| Gene Alias | BHLHb31 | |
| Cytomap | 8q21.13 | |
| Gene Type | protein-coding | GO ID | GO:0000003 | UniProtAcc | Q9Y5J3 |
Top |
Malignant transformation analysis |
| Identification of the aberrant gene expression in precancerous and cancerous lesions by comparing the gene expression of stem-like cells in diseased tissues with normal stem cells |
| Entrez ID | Symbol | Replicates | Species | Organ | Tissue | Adj P-value | Log2FC | Malignancy |
| 23462 | HEY1 | LZE4T | Human | Esophagus | ESCC | 2.85e-25 | 9.19e-01 | 0.0811 |
| 23462 | HEY1 | LZE5T | Human | Esophagus | ESCC | 1.57e-03 | 4.24e-01 | 0.0514 |
| 23462 | HEY1 | LZE7T | Human | Esophagus | ESCC | 9.32e-08 | 3.67e-01 | 0.0667 |
| 23462 | HEY1 | LZE8T | Human | Esophagus | ESCC | 2.72e-03 | 1.39e-01 | 0.067 |
| 23462 | HEY1 | LZE20T | Human | Esophagus | ESCC | 2.95e-06 | 2.34e-01 | 0.0662 |
| 23462 | HEY1 | LZE22T | Human | Esophagus | ESCC | 1.40e-06 | 4.49e-01 | 0.068 |
| 23462 | HEY1 | LZE21T | Human | Esophagus | ESCC | 1.16e-05 | 4.53e-01 | 0.0655 |
| 23462 | HEY1 | P2T-E | Human | Esophagus | ESCC | 5.79e-54 | 1.24e+00 | 0.1177 |
| 23462 | HEY1 | P4T-E | Human | Esophagus | ESCC | 1.40e-18 | 8.29e-01 | 0.1323 |
| 23462 | HEY1 | P5T-E | Human | Esophagus | ESCC | 3.39e-10 | 3.57e-01 | 0.1327 |
| 23462 | HEY1 | P8T-E | Human | Esophagus | ESCC | 4.71e-15 | 3.97e-01 | 0.0889 |
| 23462 | HEY1 | P9T-E | Human | Esophagus | ESCC | 8.59e-07 | 2.30e-01 | 0.1131 |
| 23462 | HEY1 | P11T-E | Human | Esophagus | ESCC | 1.20e-09 | 4.61e-01 | 0.1426 |
| 23462 | HEY1 | P12T-E | Human | Esophagus | ESCC | 5.01e-41 | 1.26e+00 | 0.1122 |
| 23462 | HEY1 | P15T-E | Human | Esophagus | ESCC | 1.75e-37 | 1.12e+00 | 0.1149 |
| 23462 | HEY1 | P16T-E | Human | Esophagus | ESCC | 1.15e-88 | 1.78e+00 | 0.1153 |
| 23462 | HEY1 | P19T-E | Human | Esophagus | ESCC | 7.48e-03 | 2.66e-01 | 0.1662 |
| 23462 | HEY1 | P20T-E | Human | Esophagus | ESCC | 1.16e-15 | 5.50e-01 | 0.1124 |
| 23462 | HEY1 | P22T-E | Human | Esophagus | ESCC | 2.68e-15 | 4.62e-01 | 0.1236 |
| 23462 | HEY1 | P23T-E | Human | Esophagus | ESCC | 8.35e-43 | 1.14e+00 | 0.108 |
| Page: 1 2 3 4 |
| Tissue | Expression Dynamics | Abbreviation |
| Esophagus | 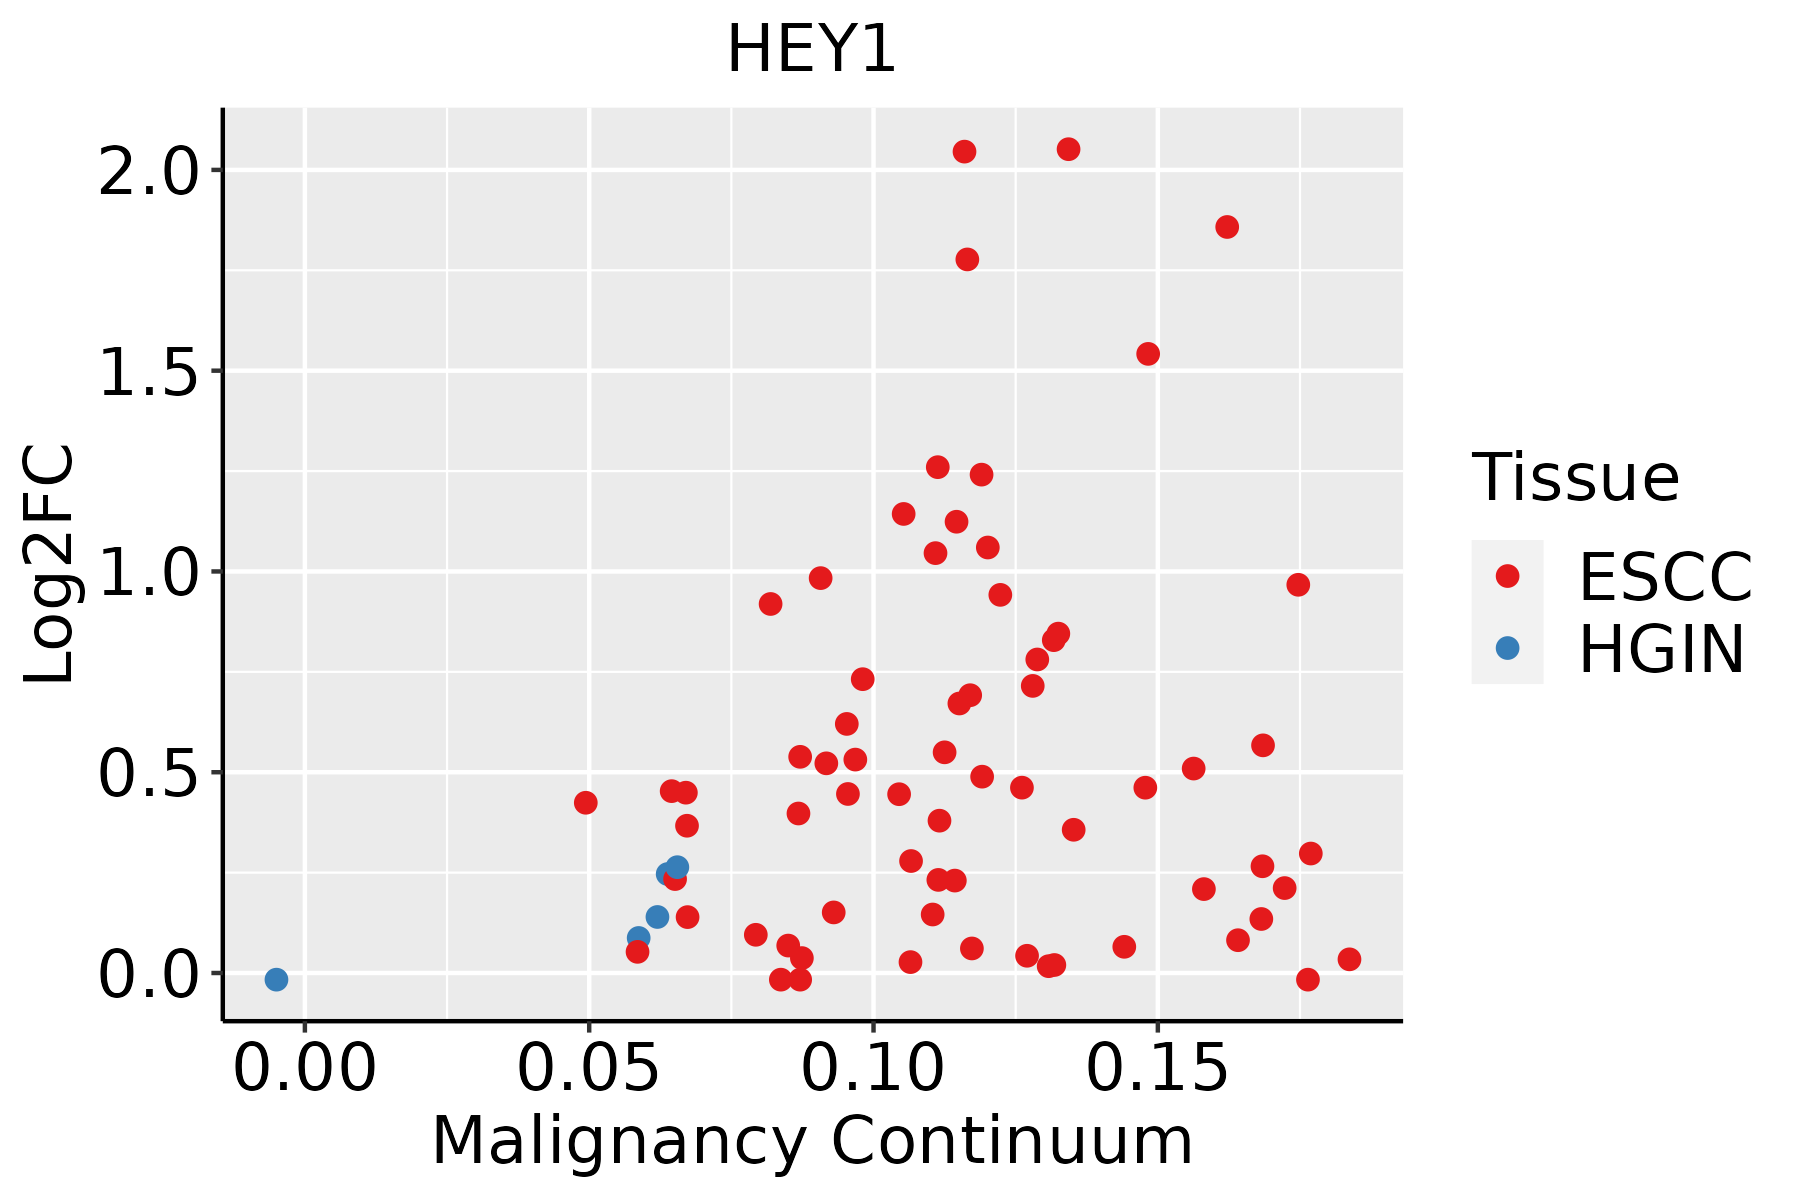 | ESCC: Esophageal squamous cell carcinoma |
| HGIN: High-grade intraepithelial neoplasias | ||
| LGIN: Low-grade intraepithelial neoplasias | ||
| Liver | 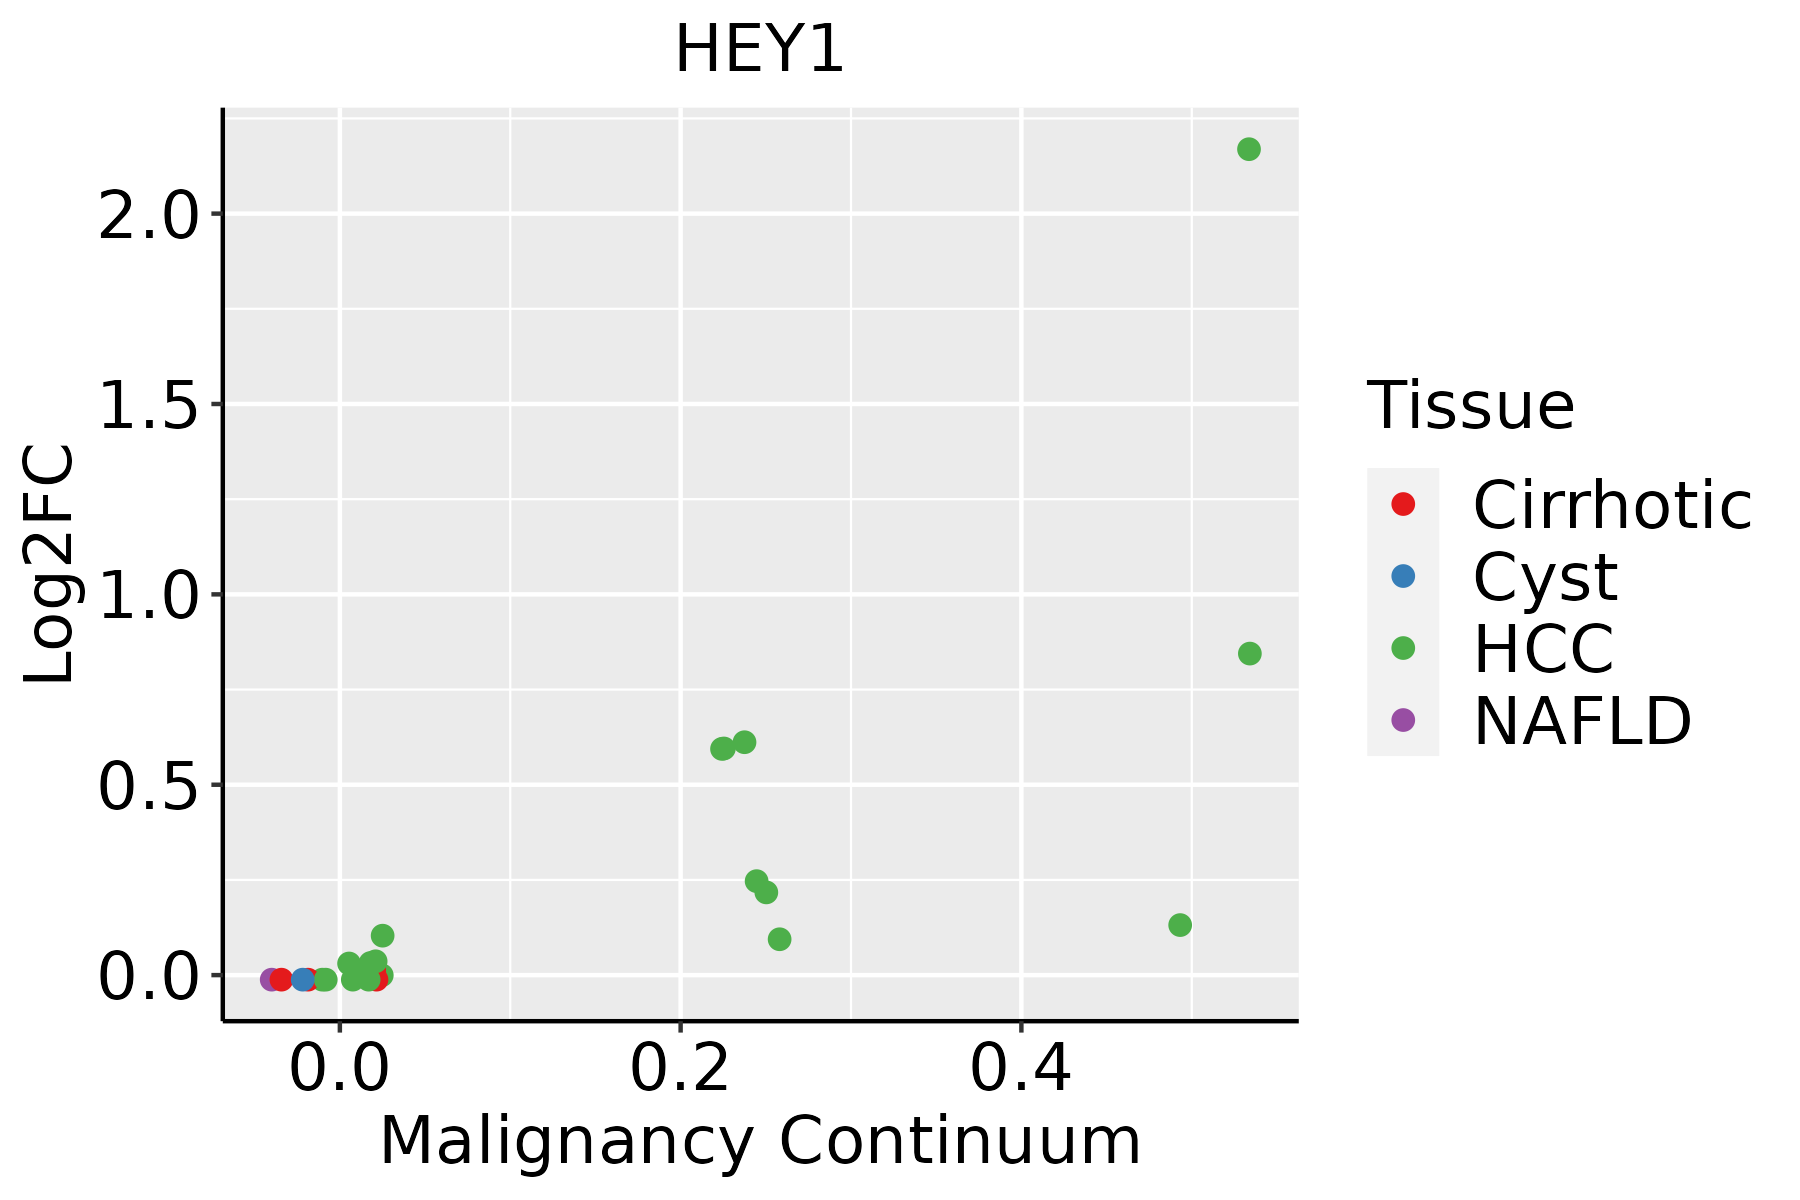 | HCC: Hepatocellular carcinoma |
| NAFLD: Non-alcoholic fatty liver disease | ||
| Oral Cavity |  | EOLP: Erosive Oral lichen planus |
| LP: leukoplakia | ||
| NEOLP: Non-erosive oral lichen planus | ||
| OSCC: Oral squamous cell carcinoma |
| ∗log2FC in expression of this searched gene in stem-like cells from each diseased tissue sample relative to stem-like cells in normal samples in each tissue plotted against the malignancy continuum. Samples are colored based on if they are from different disease stage. |
Top |
Malignant transformation related pathway analysis |
| Find out the enriched GO biological processes and KEGG pathways involved in transition from healthy to precancer to cancer |
| Tissue | Disease Stage | Enriched GO biological Processes |
| Colorectum | AD |  |
| Colorectum | SER |  |
| Colorectum | MSS |  |
| Colorectum | MSI-H |  |
| Colorectum | FAP |  |
| ∗Top 15 enriched GO BP terms are showed in the bar plot of each disease state in each tissue. Each row represents a significant GO biological process which is colored according to the -log10(p.adjust). |
| Page: 1 2 3 4 5 6 7 8 9 |
| GO ID | Tissue | Disease Stage | Description | Gene Ratio | Bg Ratio | pvalue | p.adjust | Count |
| GO:0051098111 | Esophagus | ESCC | regulation of binding | 251/8552 | 363/18723 | 6.73e-20 | 8.46e-18 | 251 |
| GO:000170119 | Esophagus | ESCC | in utero embryonic development | 243/8552 | 367/18723 | 1.00e-15 | 6.86e-14 | 243 |
| GO:0051101111 | Esophagus | ESCC | regulation of DNA binding | 84/8552 | 118/18723 | 1.64e-08 | 3.21e-07 | 84 |
| GO:0051100111 | Esophagus | ESCC | negative regulation of binding | 109/8552 | 162/18723 | 2.10e-08 | 4.03e-07 | 109 |
| GO:0001890110 | Esophagus | ESCC | placenta development | 98/8552 | 144/18723 | 4.46e-08 | 8.11e-07 | 98 |
| GO:0048545111 | Esophagus | ESCC | response to steroid hormone | 204/8552 | 339/18723 | 4.47e-08 | 8.11e-07 | 204 |
| GO:0061458110 | Esophagus | ESCC | reproductive system development | 247/8552 | 427/18723 | 2.24e-07 | 3.42e-06 | 247 |
| GO:004860818 | Esophagus | ESCC | reproductive structure development | 245/8552 | 424/18723 | 2.82e-07 | 4.14e-06 | 245 |
| GO:0071383110 | Esophagus | ESCC | cellular response to steroid hormone stimulus | 127/8552 | 204/18723 | 1.26e-06 | 1.55e-05 | 127 |
| GO:000189219 | Esophagus | ESCC | embryonic placenta development | 57/8552 | 82/18723 | 1.06e-05 | 1.01e-04 | 57 |
| GO:00072197 | Esophagus | ESCC | Notch signaling pathway | 106/8552 | 172/18723 | 1.74e-05 | 1.55e-04 | 106 |
| GO:005076710 | Esophagus | ESCC | regulation of neurogenesis | 203/8552 | 364/18723 | 6.10e-05 | 4.68e-04 | 203 |
| GO:0045746 | Esophagus | ESCC | negative regulation of Notch signaling pathway | 28/8552 | 36/18723 | 8.62e-05 | 6.22e-04 | 28 |
| GO:00018378 | Esophagus | ESCC | epithelial to mesenchymal transition | 95/8552 | 157/18723 | 1.25e-04 | 8.56e-04 | 95 |
| GO:00433924 | Esophagus | ESCC | negative regulation of DNA binding | 37/8552 | 52/18723 | 1.75e-04 | 1.14e-03 | 37 |
| GO:00519606 | Esophagus | ESCC | regulation of nervous system development | 237/8552 | 443/18723 | 5.02e-04 | 2.78e-03 | 237 |
| GO:00487628 | Esophagus | ESCC | mesenchymal cell differentiation | 133/8552 | 236/18723 | 5.94e-04 | 3.22e-03 | 133 |
| GO:00485687 | Esophagus | ESCC | embryonic organ development | 228/8552 | 427/18723 | 7.28e-04 | 3.79e-03 | 228 |
| GO:00085935 | Esophagus | ESCC | regulation of Notch signaling pathway | 59/8552 | 95/18723 | 9.12e-04 | 4.65e-03 | 59 |
| GO:00607119 | Esophagus | ESCC | labyrinthine layer development | 30/8552 | 44/18723 | 2.14e-03 | 9.54e-03 | 30 |
| Page: 1 2 3 4 |
| Pathway ID | Tissue | Disease Stage | Description | Gene Ratio | Bg Ratio | pvalue | p.adjust | qvalue | Count |
| hsa0516510 | Esophagus | ESCC | Human papillomavirus infection | 215/4205 | 331/8465 | 7.86e-09 | 7.12e-08 | 3.65e-08 | 215 |
| hsa043306 | Esophagus | ESCC | Notch signaling pathway | 42/4205 | 62/8465 | 2.97e-03 | 7.97e-03 | 4.08e-03 | 42 |
| hsa0516515 | Esophagus | ESCC | Human papillomavirus infection | 215/4205 | 331/8465 | 7.86e-09 | 7.12e-08 | 3.65e-08 | 215 |
| hsa0433013 | Esophagus | ESCC | Notch signaling pathway | 42/4205 | 62/8465 | 2.97e-03 | 7.97e-03 | 4.08e-03 | 42 |
| hsa051652 | Liver | HCC | Human papillomavirus infection | 188/4020 | 331/8465 | 3.34e-04 | 1.49e-03 | 8.29e-04 | 188 |
| hsa051653 | Liver | HCC | Human papillomavirus infection | 188/4020 | 331/8465 | 3.34e-04 | 1.49e-03 | 8.29e-04 | 188 |
| hsa051659 | Oral cavity | OSCC | Human papillomavirus infection | 200/3704 | 331/8465 | 3.83e-10 | 4.93e-09 | 2.51e-09 | 200 |
| hsa043305 | Oral cavity | OSCC | Notch signaling pathway | 44/3704 | 62/8465 | 1.26e-05 | 5.55e-05 | 2.83e-05 | 44 |
| hsa0516514 | Oral cavity | OSCC | Human papillomavirus infection | 200/3704 | 331/8465 | 3.83e-10 | 4.93e-09 | 2.51e-09 | 200 |
| hsa0433012 | Oral cavity | OSCC | Notch signaling pathway | 44/3704 | 62/8465 | 1.26e-05 | 5.55e-05 | 2.83e-05 | 44 |
| Page: 1 |
Top |
Cell-cell communication analysis |
| Identification of potential cell-cell interactions between two cell types and their ligand-receptor pairs for different disease states |
| Ligand | Receptor | LRpair | Pathway | Tissue | Disease Stage |
| Page: 1 |
Top |
Single-cell gene regulatory network inference analysis |
| Find out the significant the regulons (TFs) and the target genes of each regulon across cell types for different disease states |
| TF | Cell Type | Tissue | Disease Stage | Target Gene | RSS | Regulon Activity |
| HEY1 | M2MAC | Oral cavity | ADJ | HPGDS,GATA2,TPSAB1, etc. | 1.17e-01 |  |
| HEY1 | MAST | Oral cavity | ADJ | HPGDS,GATA2,TPSAB1, etc. | 4.34e-01 | |
| HEY1 | CD8TEFF | Oral cavity | EOLP | HPGDS,GATA2,TPSAB1, etc. | 0.00e+00 |  |
| HEY1 | cDC | Oral cavity | EOLP | HPGDS,GATA2,TPSAB1, etc. | 9.37e-03 | |
| HEY1 | MDSCs | Oral cavity | EOLP | HPGDS,GATA2,TPSAB1, etc. | 0.00e+00 | |
| HEY1 | pDC | Oral cavity | EOLP | HPGDS,GATA2,TPSAB1, etc. | 1.94e-02 | |
| HEY1 | NK | Oral cavity | EOLP | HPGDS,GATA2,TPSAB1, etc. | 1.19e-02 | |
| HEY1 | MAST | Oral cavity | EOLP | HPGDS,GATA2,TPSAB1, etc. | 1.31e-01 | |
| HEY1 | CD8TEX | Oral cavity | Healthy | HPGDS,GATA2,TPSAB1, etc. | 5.03e-04 |  |
| HEY1 | MAST | Oral cavity | Healthy | HPGDS,GATA2,TPSAB1, etc. | 7.32e-01 | |
| ∗The dot plots of a searched regulon are shown for all cell subpopulations in each disease state of each tissue based on the regulon specific score inferred using pySCENIC and by calculating the average expression. |
| Page: 1 2 3 |
Top |
Somatic mutation of malignant transformation related genes |
| Annotation of somatic variants for genes involved in malignant transformation |
| Hugo Symbol | Variant Class | Variant Classification | dbSNP RS | HGVSc | HGVSp | HGVSp Short | SWISSPROT | BIOTYPE | SIFT | PolyPhen | Tumor Sample Barcode | Tissue | Histology | Sex | Age | Stage | Therapy Types | Drugs | Outcome |
| HEY1 | SNV | Missense_Mutation | c.796N>A | p.Ser266Thr | p.S266T | Q9Y5J3 | protein_coding | tolerated(0.05) | benign(0.02) | TCGA-AN-A049-01 | Breast | breast invasive carcinoma | Female | <65 | I/II | Unknown | Unknown | SD | |
| HEY1 | SNV | Missense_Mutation | rs138580863 | c.571N>T | p.His191Tyr | p.H191Y | Q9Y5J3 | protein_coding | tolerated(1) | benign(0.184) | TCGA-C5-A902-01 | Cervix | cervical & endocervical cancer | Female | <65 | I/II | Chemotherapy | cisplatin | SD |
| HEY1 | SNV | Missense_Mutation | novel | c.466N>T | p.Val156Phe | p.V156F | Q9Y5J3 | protein_coding | deleterious(0) | possibly_damaging(0.595) | TCGA-AA-3811-01 | Colorectum | colon adenocarcinoma | Female | >=65 | III/IV | Unknown | Unknown | PD |
| HEY1 | SNV | Missense_Mutation | c.740T>C | p.Val247Ala | p.V247A | Q9Y5J3 | protein_coding | tolerated(0.68) | benign(0.406) | TCGA-D5-6530-01 | Colorectum | colon adenocarcinoma | Male | <65 | I/II | Unknown | Unknown | SD | |
| HEY1 | SNV | Missense_Mutation | novel | c.243N>T | p.Glu81Asp | p.E81D | Q9Y5J3 | protein_coding | deleterious(0.01) | probably_damaging(0.993) | TCGA-F5-6814-01 | Colorectum | rectum adenocarcinoma | Male | <65 | I/II | Unknown | Unknown | SD |
| HEY1 | SNV | Missense_Mutation | novel | c.606N>T | p.Gln202His | p.Q202H | Q9Y5J3 | protein_coding | tolerated(0.08) | benign(0.006) | TCGA-A5-A0G1-01 | Endometrium | uterine corpus endometrioid carcinoma | Female | >=65 | I/II | Unknown | Unknown | SD |
| HEY1 | SNV | Missense_Mutation | novel | c.179N>A | p.Arg60His | p.R60H | Q9Y5J3 | protein_coding | deleterious(0) | probably_damaging(0.991) | TCGA-AJ-A3BH-01 | Endometrium | uterine corpus endometrioid carcinoma | Female | Unknown | I/II | Unknown | Unknown | SD |
| HEY1 | SNV | Missense_Mutation | novel | c.372G>A | p.Met124Ile | p.M124I | Q9Y5J3 | protein_coding | tolerated(0.06) | benign(0.041) | TCGA-AP-A1DK-01 | Endometrium | uterine corpus endometrioid carcinoma | Female | <65 | I/II | Unknown | Unknown | SD |
| HEY1 | SNV | Missense_Mutation | rs141577372 | c.470G>A | p.Arg157Gln | p.R157Q | Q9Y5J3 | protein_coding | deleterious(0) | probably_damaging(0.998) | TCGA-B5-A1MR-01 | Endometrium | uterine corpus endometrioid carcinoma | Female | >=65 | III/IV | Unknown | Unknown | SD |
| HEY1 | SNV | Missense_Mutation | novel | c.881N>C | p.Leu294Pro | p.L294P | Q9Y5J3 | protein_coding | tolerated(0.21) | possibly_damaging(0.884) | TCGA-B5-A1MX-01 | Endometrium | uterine corpus endometrioid carcinoma | Female | <65 | I/II | Hormone Therapy | megace | SD |
| Page: 1 2 |
Top |
Related drugs of malignant transformation related genes |
| Identification of chemicals and drugs interact with genes involved in malignant transfromation |
| (DGIdb 4.0) |
| Entrez ID | Symbol | Category | Interaction Types | Drug Claim Name | Drug Name | PMIDs |
| Page: 1 |

Copyright 2023-Present -The University of Texas Health Science Center at Houston |