
|
|||||
|
 | |
| |
| |
| |
| |
| |
|
Gene: HEXB |
Gene summary for HEXB |
| Gene information | Species | Human | Gene symbol | HEXB | Gene ID | 3074 |
| Gene name | hexosaminidase subunit beta | |
| Gene Alias | ENC-1AS | |
| Cytomap | 5q13.3 | |
| Gene Type | protein-coding | GO ID | GO:0000003 | UniProtAcc | A0A024RAJ6 |
Top |
Malignant transformation analysis |
| Identification of the aberrant gene expression in precancerous and cancerous lesions by comparing the gene expression of stem-like cells in diseased tissues with normal stem cells |
| Entrez ID | Symbol | Replicates | Species | Organ | Tissue | Adj P-value | Log2FC | Malignancy |
| 3074 | HEXB | LZE4T | Human | Esophagus | ESCC | 7.07e-07 | 1.47e-01 | 0.0811 |
| 3074 | HEXB | LZE20T | Human | Esophagus | ESCC | 3.09e-05 | 3.01e-02 | 0.0662 |
| 3074 | HEXB | LZE24T | Human | Esophagus | ESCC | 6.43e-16 | 7.22e-01 | 0.0596 |
| 3074 | HEXB | P2T-E | Human | Esophagus | ESCC | 6.46e-39 | 7.27e-01 | 0.1177 |
| 3074 | HEXB | P4T-E | Human | Esophagus | ESCC | 8.89e-19 | 6.09e-01 | 0.1323 |
| 3074 | HEXB | P5T-E | Human | Esophagus | ESCC | 6.40e-14 | 3.59e-01 | 0.1327 |
| 3074 | HEXB | P8T-E | Human | Esophagus | ESCC | 2.79e-31 | 5.10e-01 | 0.0889 |
| 3074 | HEXB | P9T-E | Human | Esophagus | ESCC | 1.47e-14 | 5.65e-01 | 0.1131 |
| 3074 | HEXB | P10T-E | Human | Esophagus | ESCC | 6.04e-27 | 4.93e-01 | 0.116 |
| 3074 | HEXB | P11T-E | Human | Esophagus | ESCC | 1.26e-12 | 8.14e-01 | 0.1426 |
| 3074 | HEXB | P12T-E | Human | Esophagus | ESCC | 2.47e-46 | 7.96e-01 | 0.1122 |
| 3074 | HEXB | P15T-E | Human | Esophagus | ESCC | 2.07e-26 | 6.19e-01 | 0.1149 |
| 3074 | HEXB | P16T-E | Human | Esophagus | ESCC | 5.03e-32 | 5.34e-01 | 0.1153 |
| 3074 | HEXB | P19T-E | Human | Esophagus | ESCC | 5.86e-08 | 8.11e-01 | 0.1662 |
| 3074 | HEXB | P20T-E | Human | Esophagus | ESCC | 6.94e-21 | 5.31e-01 | 0.1124 |
| 3074 | HEXB | P21T-E | Human | Esophagus | ESCC | 1.73e-40 | 8.28e-01 | 0.1617 |
| 3074 | HEXB | P22T-E | Human | Esophagus | ESCC | 1.76e-38 | 7.59e-01 | 0.1236 |
| 3074 | HEXB | P23T-E | Human | Esophagus | ESCC | 1.63e-16 | 7.02e-01 | 0.108 |
| 3074 | HEXB | P24T-E | Human | Esophagus | ESCC | 3.60e-21 | 4.00e-01 | 0.1287 |
| 3074 | HEXB | P26T-E | Human | Esophagus | ESCC | 2.11e-40 | 6.98e-01 | 0.1276 |
| Page: 1 2 3 4 5 6 |
| Tissue | Expression Dynamics | Abbreviation |
| Esophagus |  | ESCC: Esophageal squamous cell carcinoma |
| HGIN: High-grade intraepithelial neoplasias | ||
| LGIN: Low-grade intraepithelial neoplasias | ||
| Liver | 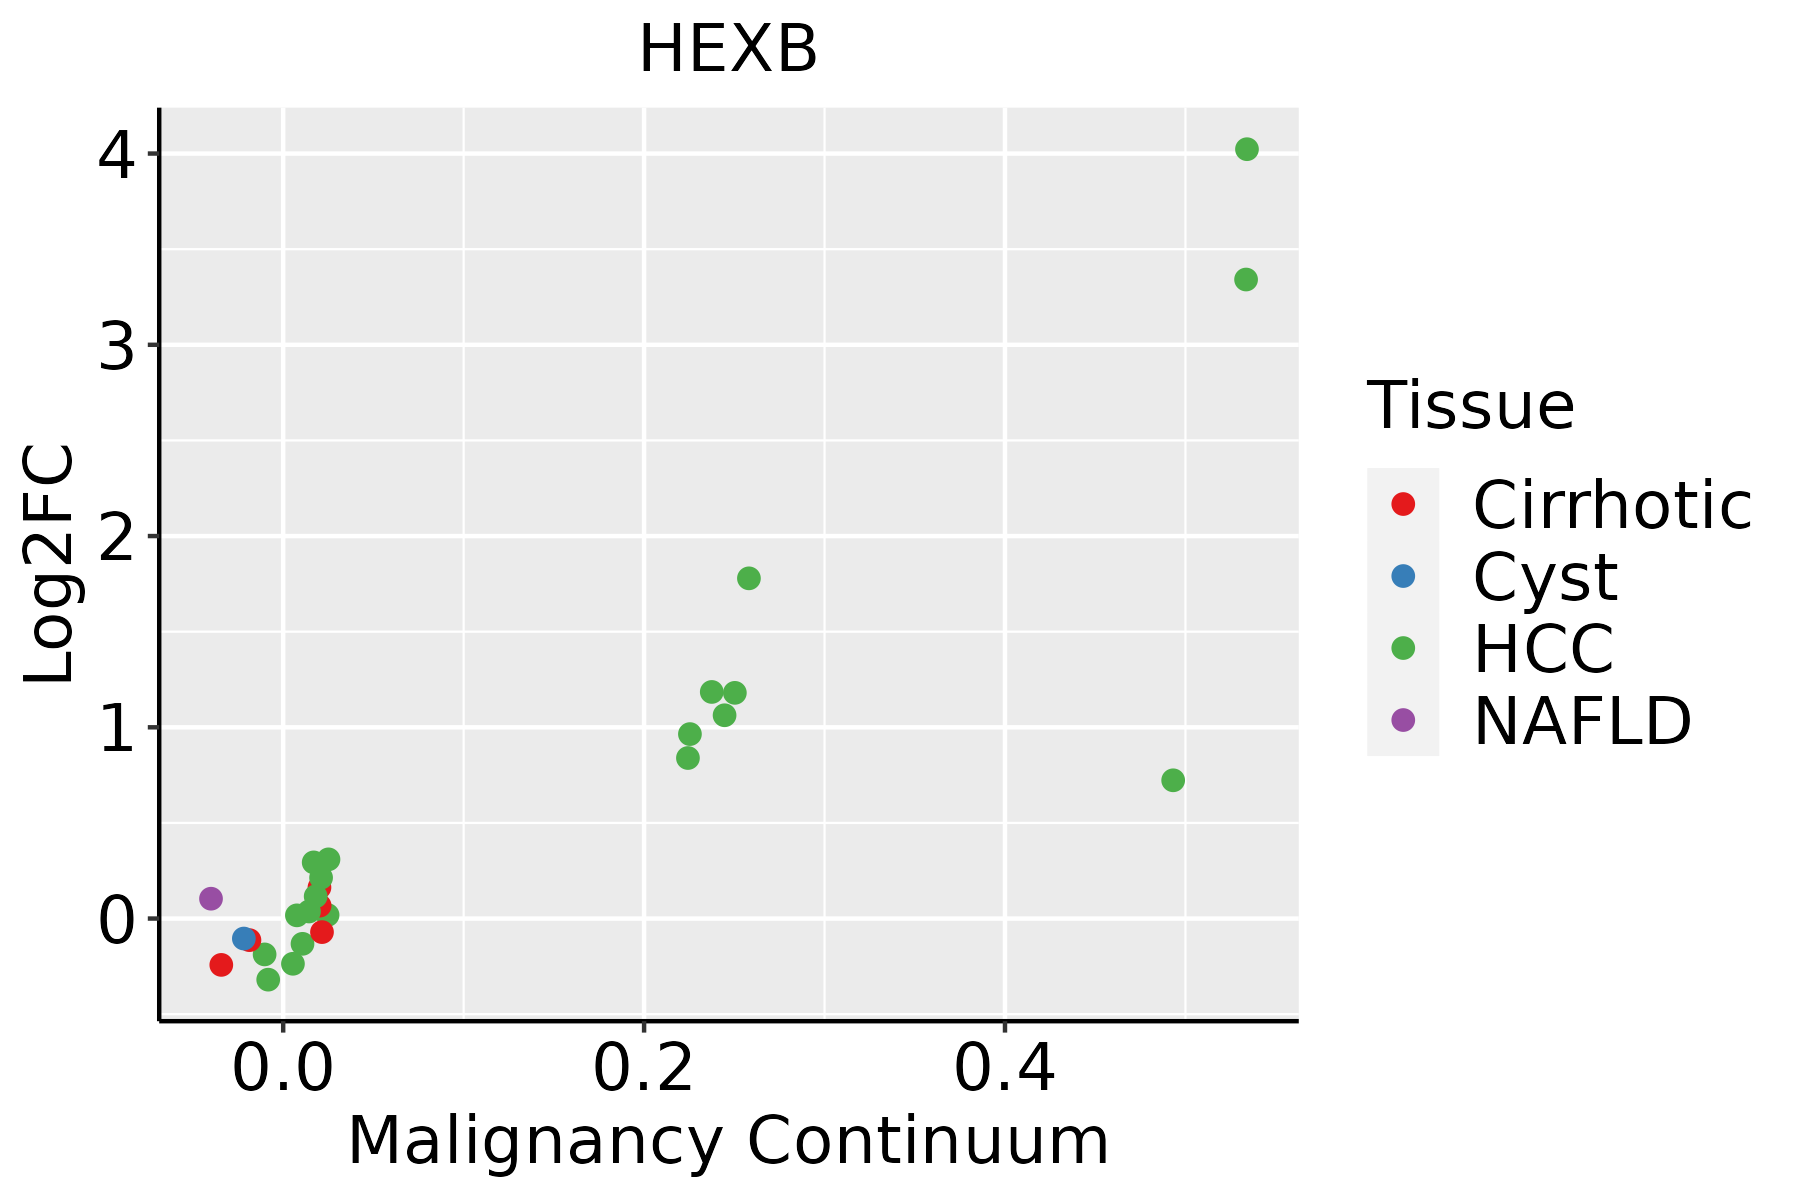 | HCC: Hepatocellular carcinoma |
| NAFLD: Non-alcoholic fatty liver disease | ||
| Oral Cavity |  | EOLP: Erosive Oral lichen planus |
| LP: leukoplakia | ||
| NEOLP: Non-erosive oral lichen planus | ||
| OSCC: Oral squamous cell carcinoma | ||
| Skin | 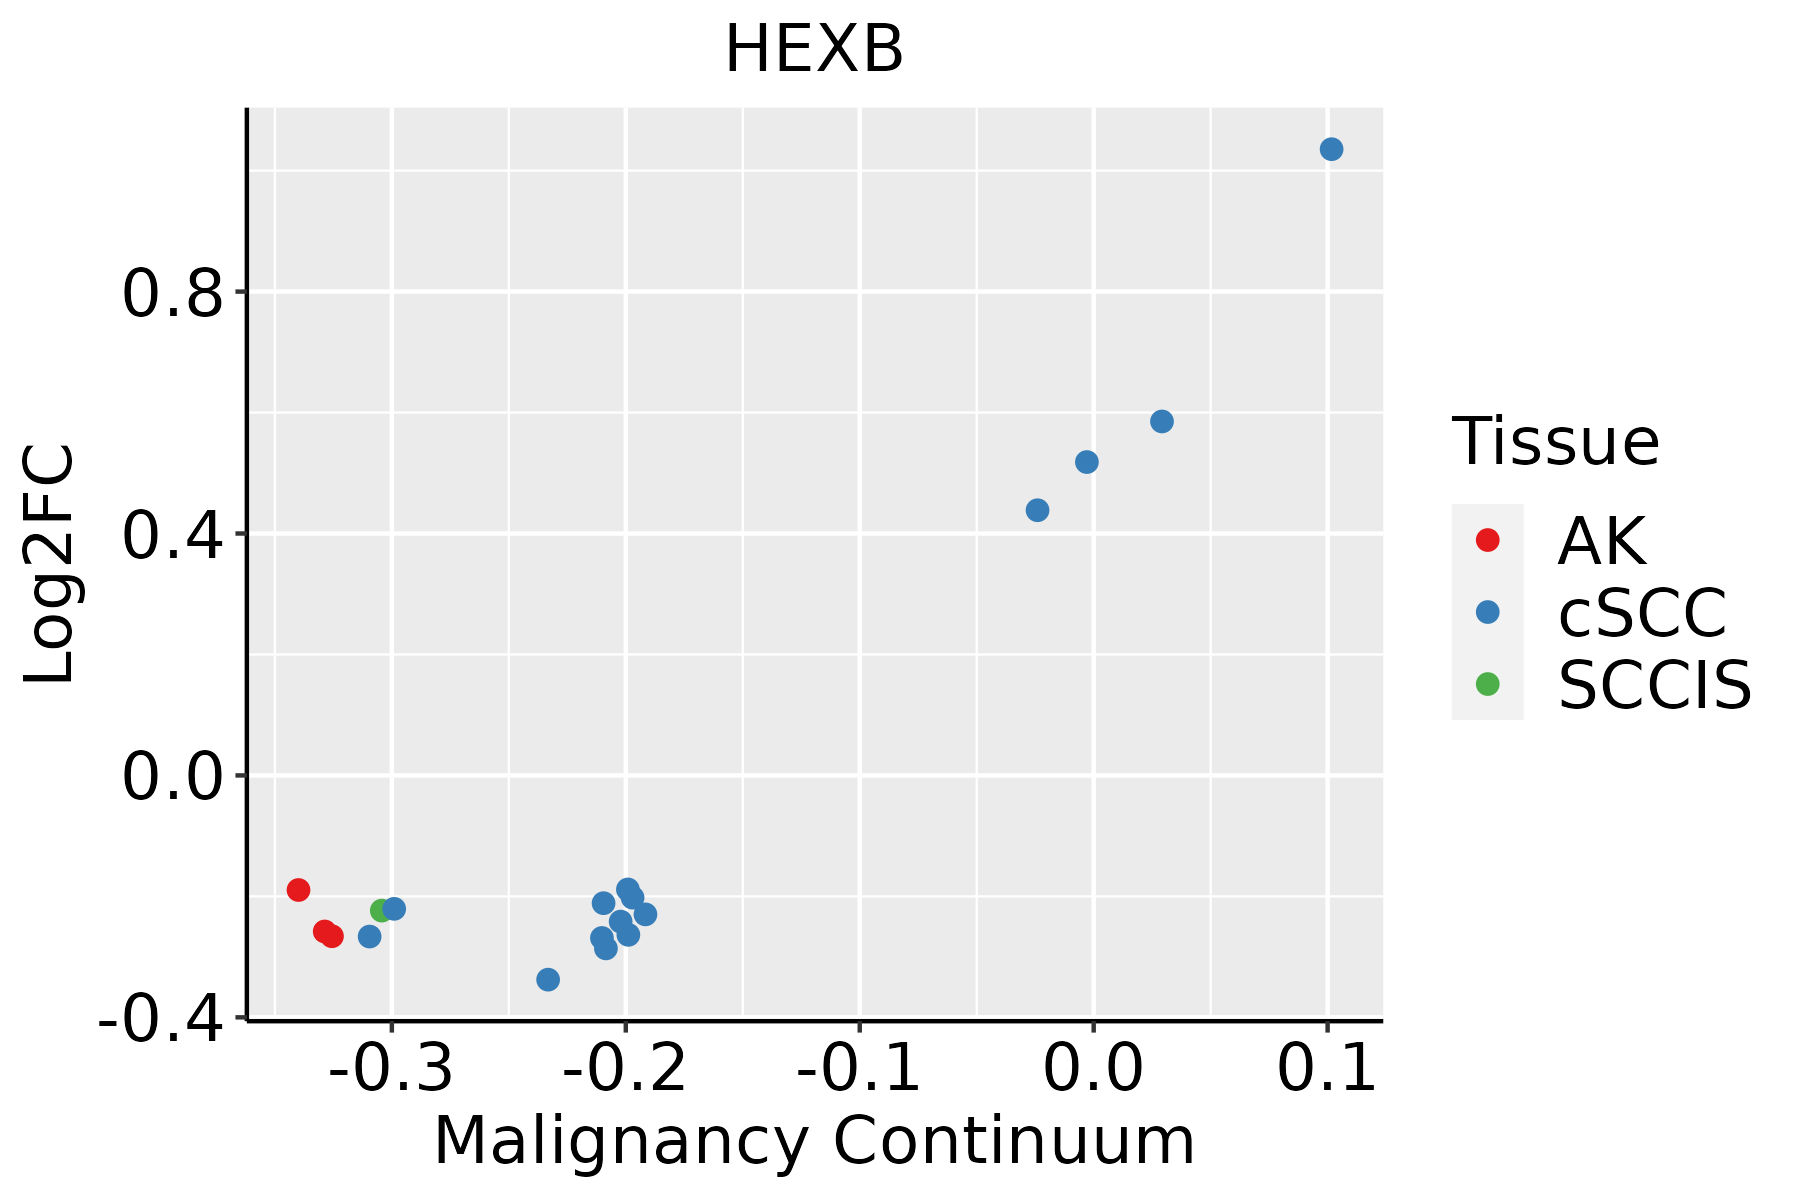 | AK: Actinic keratosis |
| cSCC: Cutaneous squamous cell carcinoma | ||
| SCCIS:squamous cell carcinoma in situ | ||
| Thyroid |  | ATC: Anaplastic thyroid cancer |
| HT: Hashimoto's thyroiditis | ||
| PTC: Papillary thyroid cancer |
| ∗log2FC in expression of this searched gene in stem-like cells from each diseased tissue sample relative to stem-like cells in normal samples in each tissue plotted against the malignancy continuum. Samples are colored based on if they are from different disease stage. |
Top |
Malignant transformation related pathway analysis |
| Find out the enriched GO biological processes and KEGG pathways involved in transition from healthy to precancer to cancer |
| Tissue | Disease Stage | Enriched GO biological Processes |
| Colorectum | AD |  |
| Colorectum | SER |  |
| Colorectum | MSS |  |
| Colorectum | MSI-H |  |
| Colorectum | FAP |  |
| ∗Top 15 enriched GO BP terms are showed in the bar plot of each disease state in each tissue. Each row represents a significant GO biological process which is colored according to the -log10(p.adjust). |
| Page: 1 2 3 4 5 6 7 8 9 |
| GO ID | Tissue | Disease Stage | Description | Gene Ratio | Bg Ratio | pvalue | p.adjust | Count |
| GO:000703314 | Esophagus | ESCC | vacuole organization | 127/8552 | 180/18723 | 1.04e-11 | 3.85e-10 | 127 |
| GO:00086544 | Esophagus | ESCC | phospholipid biosynthetic process | 162/8552 | 253/18723 | 2.59e-09 | 5.73e-08 | 162 |
| GO:0051235110 | Esophagus | ESCC | maintenance of location | 200/8552 | 327/18723 | 1.01e-08 | 2.02e-07 | 200 |
| GO:00066433 | Esophagus | ESCC | membrane lipid metabolic process | 130/8552 | 203/18723 | 9.29e-08 | 1.54e-06 | 130 |
| GO:002260420 | Esophagus | ESCC | regulation of cell morphogenesis | 180/8552 | 309/18723 | 5.19e-06 | 5.45e-05 | 180 |
| GO:00070403 | Esophagus | ESCC | lysosome organization | 53/8552 | 74/18723 | 5.34e-06 | 5.57e-05 | 53 |
| GO:00801713 | Esophagus | ESCC | lytic vacuole organization | 53/8552 | 74/18723 | 5.34e-06 | 5.57e-05 | 53 |
| GO:00066446 | Esophagus | ESCC | phospholipid metabolic process | 218/8552 | 383/18723 | 5.37e-06 | 5.59e-05 | 218 |
| GO:00425524 | Esophagus | ESCC | myelination | 85/8552 | 134/18723 | 2.51e-05 | 2.13e-04 | 85 |
| GO:00072724 | Esophagus | ESCC | ensheathment of neurons | 86/8552 | 136/18723 | 2.68e-05 | 2.24e-04 | 86 |
| GO:00083664 | Esophagus | ESCC | axon ensheathment | 86/8552 | 136/18723 | 2.68e-05 | 2.24e-04 | 86 |
| GO:00066652 | Esophagus | ESCC | sphingolipid metabolic process | 96/8552 | 155/18723 | 3.21e-05 | 2.66e-04 | 96 |
| GO:00420636 | Esophagus | ESCC | gliogenesis | 172/8552 | 301/18723 | 3.75e-05 | 3.04e-04 | 172 |
| GO:00199155 | Esophagus | ESCC | lipid storage | 58/8552 | 87/18723 | 6.15e-05 | 4.72e-04 | 58 |
| GO:000836018 | Esophagus | ESCC | regulation of cell shape | 92/8552 | 154/18723 | 3.00e-04 | 1.81e-03 | 92 |
| GO:00066642 | Esophagus | ESCC | glycolipid metabolic process | 63/8552 | 100/18723 | 3.55e-04 | 2.06e-03 | 63 |
| GO:19035092 | Esophagus | ESCC | liposaccharide metabolic process | 63/8552 | 101/18723 | 5.25e-04 | 2.90e-03 | 63 |
| GO:001605216 | Esophagus | ESCC | carbohydrate catabolic process | 91/8552 | 154/18723 | 5.39e-04 | 2.97e-03 | 91 |
| GO:00442427 | Esophagus | ESCC | cellular lipid catabolic process | 121/8552 | 214/18723 | 8.63e-04 | 4.43e-03 | 121 |
| GO:19011362 | Esophagus | ESCC | carbohydrate derivative catabolic process | 99/8552 | 172/18723 | 1.11e-03 | 5.54e-03 | 99 |
| Page: 1 2 3 4 5 6 7 8 |
| Pathway ID | Tissue | Disease Stage | Description | Gene Ratio | Bg Ratio | pvalue | p.adjust | qvalue | Count |
| hsa0414222 | Esophagus | ESCC | Lysosome | 102/4205 | 132/8465 | 5.11e-11 | 7.13e-10 | 3.65e-10 | 102 |
| hsa005136 | Esophagus | ESCC | Various types of N-glycan biosynthesis | 31/4205 | 42/8465 | 1.23e-03 | 3.78e-03 | 1.93e-03 | 31 |
| hsa005202 | Esophagus | ESCC | Amino sugar and nucleotide sugar metabolism | 35/4205 | 49/8465 | 1.60e-03 | 4.88e-03 | 2.50e-03 | 35 |
| hsa006003 | Esophagus | ESCC | Sphingolipid metabolism | 36/4205 | 53/8465 | 5.41e-03 | 1.36e-02 | 6.99e-03 | 36 |
| hsa0414232 | Esophagus | ESCC | Lysosome | 102/4205 | 132/8465 | 5.11e-11 | 7.13e-10 | 3.65e-10 | 102 |
| hsa0051313 | Esophagus | ESCC | Various types of N-glycan biosynthesis | 31/4205 | 42/8465 | 1.23e-03 | 3.78e-03 | 1.93e-03 | 31 |
| hsa0052011 | Esophagus | ESCC | Amino sugar and nucleotide sugar metabolism | 35/4205 | 49/8465 | 1.60e-03 | 4.88e-03 | 2.50e-03 | 35 |
| hsa0060012 | Esophagus | ESCC | Sphingolipid metabolism | 36/4205 | 53/8465 | 5.41e-03 | 1.36e-02 | 6.99e-03 | 36 |
| hsa041424 | Liver | Cirrhotic | Lysosome | 68/2530 | 132/8465 | 1.34e-07 | 1.97e-06 | 1.21e-06 | 68 |
| hsa005134 | Liver | Cirrhotic | Various types of N-glycan biosynthesis | 26/2530 | 42/8465 | 1.65e-05 | 1.41e-04 | 8.69e-05 | 26 |
| hsa0414211 | Liver | Cirrhotic | Lysosome | 68/2530 | 132/8465 | 1.34e-07 | 1.97e-06 | 1.21e-06 | 68 |
| hsa0051311 | Liver | Cirrhotic | Various types of N-glycan biosynthesis | 26/2530 | 42/8465 | 1.65e-05 | 1.41e-04 | 8.69e-05 | 26 |
| hsa041422 | Liver | HCC | Lysosome | 100/4020 | 132/8465 | 2.32e-11 | 4.31e-10 | 2.40e-10 | 100 |
| hsa005132 | Liver | HCC | Various types of N-glycan biosynthesis | 30/4020 | 42/8465 | 1.41e-03 | 5.07e-03 | 2.82e-03 | 30 |
| hsa00511 | Liver | HCC | Other glycan degradation | 15/4020 | 18/8465 | 1.96e-03 | 6.91e-03 | 3.84e-03 | 15 |
| hsa00600 | Liver | HCC | Sphingolipid metabolism | 34/4020 | 53/8465 | 1.06e-02 | 2.71e-02 | 1.51e-02 | 34 |
| hsa041423 | Liver | HCC | Lysosome | 100/4020 | 132/8465 | 2.32e-11 | 4.31e-10 | 2.40e-10 | 100 |
| hsa005133 | Liver | HCC | Various types of N-glycan biosynthesis | 30/4020 | 42/8465 | 1.41e-03 | 5.07e-03 | 2.82e-03 | 30 |
| hsa005111 | Liver | HCC | Other glycan degradation | 15/4020 | 18/8465 | 1.96e-03 | 6.91e-03 | 3.84e-03 | 15 |
| hsa006001 | Liver | HCC | Sphingolipid metabolism | 34/4020 | 53/8465 | 1.06e-02 | 2.71e-02 | 1.51e-02 | 34 |
| Page: 1 2 |
Top |
Cell-cell communication analysis |
| Identification of potential cell-cell interactions between two cell types and their ligand-receptor pairs for different disease states |
| Ligand | Receptor | LRpair | Pathway | Tissue | Disease Stage |
| Page: 1 |
Top |
Single-cell gene regulatory network inference analysis |
| Find out the significant the regulons (TFs) and the target genes of each regulon across cell types for different disease states |
| TF | Cell Type | Tissue | Disease Stage | Target Gene | RSS | Regulon Activity |
| ∗The dot plots of a searched regulon are shown for all cell subpopulations in each disease state of each tissue based on the regulon specific score inferred using pySCENIC and by calculating the average expression. |
| Page: 1 |
Top |
Somatic mutation of malignant transformation related genes |
| Annotation of somatic variants for genes involved in malignant transformation |
| Hugo Symbol | Variant Class | Variant Classification | dbSNP RS | HGVSc | HGVSp | HGVSp Short | SWISSPROT | BIOTYPE | SIFT | PolyPhen | Tumor Sample Barcode | Tissue | Histology | Sex | Age | Stage | Therapy Types | Drugs | Outcome |
| HEXB | SNV | Missense_Mutation | c.1316N>G | p.Ser439Cys | p.S439C | P07686 | protein_coding | deleterious(0) | possibly_damaging(0.746) | TCGA-AR-A24V-01 | Breast | breast invasive carcinoma | Female | <65 | I/II | Chemotherapy | doxorubicin | SD | |
| HEXB | SNV | Missense_Mutation | c.304C>T | p.His102Tyr | p.H102Y | P07686 | protein_coding | tolerated(1) | benign(0) | TCGA-E9-A1N5-01 | Breast | breast invasive carcinoma | Female | <65 | I/II | Chemotherapy | doxorubicin | SD | |
| HEXB | SNV | Missense_Mutation | c.1316C>T | p.Ser439Phe | p.S439F | P07686 | protein_coding | deleterious(0) | possibly_damaging(0.788) | TCGA-C5-A902-01 | Cervix | cervical & endocervical cancer | Female | <65 | I/II | Chemotherapy | cisplatin | SD | |
| HEXB | SNV | Missense_Mutation | rs550315046 | c.896N>T | p.Gly299Val | p.G299V | P07686 | protein_coding | deleterious(0) | probably_damaging(0.995) | TCGA-IR-A3LH-01 | Cervix | cervical & endocervical cancer | Female | <65 | I/II | Chemotherapy | cisplatin | CR |
| HEXB | SNV | Missense_Mutation | c.961C>T | p.Pro321Ser | p.P321S | P07686 | protein_coding | deleterious(0) | probably_damaging(0.992) | TCGA-JW-A69B-01 | Cervix | cervical & endocervical cancer | Female | <65 | I/II | Unknown | Unknown | SD | |
| HEXB | SNV | Missense_Mutation | rs533645939 | c.815N>A | p.Arg272His | p.R272H | P07686 | protein_coding | tolerated(0.26) | benign(0.001) | TCGA-AA-3947-01 | Colorectum | colon adenocarcinoma | Female | <65 | I/II | Unknown | Unknown | SD |
| HEXB | SNV | Missense_Mutation | c.1445N>C | p.Ile482Thr | p.I482T | P07686 | protein_coding | deleterious(0) | possibly_damaging(0.891) | TCGA-CM-5861-01 | Colorectum | colon adenocarcinoma | Female | <65 | I/II | Unknown | Unknown | PD | |
| HEXB | SNV | Missense_Mutation | c.232T>G | p.Tyr78Asp | p.Y78D | P07686 | protein_coding | tolerated(0.37) | benign(0.237) | TCGA-AG-A002-01 | Colorectum | rectum adenocarcinoma | Male | <65 | I/II | Unknown | Unknown | SD | |
| HEXB | SNV | Missense_Mutation | c.1202N>A | p.Gly401Glu | p.G401E | P07686 | protein_coding | tolerated(0.06) | possibly_damaging(0.571) | TCGA-AG-A016-01 | Colorectum | rectum adenocarcinoma | Male | <65 | III/IV | Chemotherapy | 5-fluorouracil | SD | |
| HEXB | SNV | Missense_Mutation | c.953N>G | p.Ser318Cys | p.S318C | P07686 | protein_coding | deleterious(0.01) | possibly_damaging(0.574) | TCGA-F5-6813-01 | Colorectum | rectum adenocarcinoma | Male | >=65 | III/IV | Unknown | Unknown | PD |
| Page: 1 2 3 4 |
Top |
Related drugs of malignant transformation related genes |
| Identification of chemicals and drugs interact with genes involved in malignant transfromation |
| (DGIdb 4.0) |
| Entrez ID | Symbol | Category | Interaction Types | Drug Claim Name | Drug Name | PMIDs |
| 3074 | HEXB | ENZYME | AMINOGLYCOSIDES | 3440638 | ||
| 3074 | HEXB | ENZYME | CIS-PLATINUM | 6987030 | ||
| 3074 | HEXB | ENZYME | TAMOXIFEN | TAMOXIFEN | 8577454 | |
| 3074 | HEXB | ENZYME | ESTRAMUSTINE | ESTRAMUSTINE | 6795611 | |
| 3074 | HEXB | ENZYME | OMEPRAZOLE | OMEPRAZOLE | 9593221 | |
| 3074 | HEXB | ENZYME | GENTAMICIN | GENTAMICIN | 2876489,8456116 | |
| 3074 | HEXB | ENZYME | N-ACETYLGLUCOSAMINE THIAZOLINE | CHEMBL257158 | 20822912 | |
| 3074 | HEXB | ENZYME | CDDP | CISPLATIN | 2089371 | |
| 3074 | HEXB | ENZYME | THYROXINE | THYROXINE | 7388056 | |
| 3074 | HEXB | ENZYME | CORTISONE | CORTISONE | 7388056 |
| Page: 1 2 |

Copyright 2023-Present -The University of Texas Health Science Center at Houston |