
|
|||||
|
 | |
| |
| |
| |
| |
| |
|
Gene: HEXA |
Gene summary for HEXA |
| Gene information | Species | Human | Gene symbol | HEXA | Gene ID | 3073 |
| Gene name | hexosaminidase subunit alpha | |
| Gene Alias | TSD | |
| Cytomap | 15q23 | |
| Gene Type | protein-coding | GO ID | GO:0001573 | UniProtAcc | A0A0S2Z3W3 |
Top |
Malignant transformation analysis |
| Identification of the aberrant gene expression in precancerous and cancerous lesions by comparing the gene expression of stem-like cells in diseased tissues with normal stem cells |
| Entrez ID | Symbol | Replicates | Species | Organ | Tissue | Adj P-value | Log2FC | Malignancy |
| 3073 | HEXA | LZE2T | Human | Esophagus | ESCC | 3.78e-07 | 1.12e+00 | 0.082 |
| 3073 | HEXA | LZE4T | Human | Esophagus | ESCC | 1.60e-12 | 3.66e-01 | 0.0811 |
| 3073 | HEXA | LZE5T | Human | Esophagus | ESCC | 3.69e-02 | 4.05e-01 | 0.0514 |
| 3073 | HEXA | LZE7T | Human | Esophagus | ESCC | 1.36e-11 | 7.68e-01 | 0.0667 |
| 3073 | HEXA | LZE8T | Human | Esophagus | ESCC | 4.51e-08 | 2.49e-01 | 0.067 |
| 3073 | HEXA | LZE20T | Human | Esophagus | ESCC | 1.28e-04 | 3.07e-01 | 0.0662 |
| 3073 | HEXA | LZE22T | Human | Esophagus | ESCC | 1.71e-04 | 2.32e-01 | 0.068 |
| 3073 | HEXA | LZE24T | Human | Esophagus | ESCC | 2.37e-10 | 3.94e-01 | 0.0596 |
| 3073 | HEXA | LZE21T | Human | Esophagus | ESCC | 1.09e-05 | 2.93e-01 | 0.0655 |
| 3073 | HEXA | LZE6T | Human | Esophagus | ESCC | 1.23e-06 | 6.06e-01 | 0.0845 |
| 3073 | HEXA | P1T-E | Human | Esophagus | ESCC | 9.29e-14 | 8.32e-01 | 0.0875 |
| 3073 | HEXA | P2T-E | Human | Esophagus | ESCC | 4.48e-31 | 4.40e-01 | 0.1177 |
| 3073 | HEXA | P4T-E | Human | Esophagus | ESCC | 7.30e-32 | 6.59e-01 | 0.1323 |
| 3073 | HEXA | P8T-E | Human | Esophagus | ESCC | 2.15e-47 | 8.71e-01 | 0.0889 |
| 3073 | HEXA | P9T-E | Human | Esophagus | ESCC | 2.15e-19 | 4.94e-01 | 0.1131 |
| 3073 | HEXA | P10T-E | Human | Esophagus | ESCC | 1.33e-35 | 7.10e-01 | 0.116 |
| 3073 | HEXA | P11T-E | Human | Esophagus | ESCC | 1.09e-14 | 8.77e-01 | 0.1426 |
| 3073 | HEXA | P12T-E | Human | Esophagus | ESCC | 5.40e-37 | 6.48e-01 | 0.1122 |
| 3073 | HEXA | P15T-E | Human | Esophagus | ESCC | 3.09e-22 | 6.11e-01 | 0.1149 |
| 3073 | HEXA | P16T-E | Human | Esophagus | ESCC | 5.48e-55 | 1.24e+00 | 0.1153 |
| Page: 1 2 3 4 5 6 7 |
| Tissue | Expression Dynamics | Abbreviation |
| Esophagus |  | ESCC: Esophageal squamous cell carcinoma |
| HGIN: High-grade intraepithelial neoplasias | ||
| LGIN: Low-grade intraepithelial neoplasias | ||
| Liver | 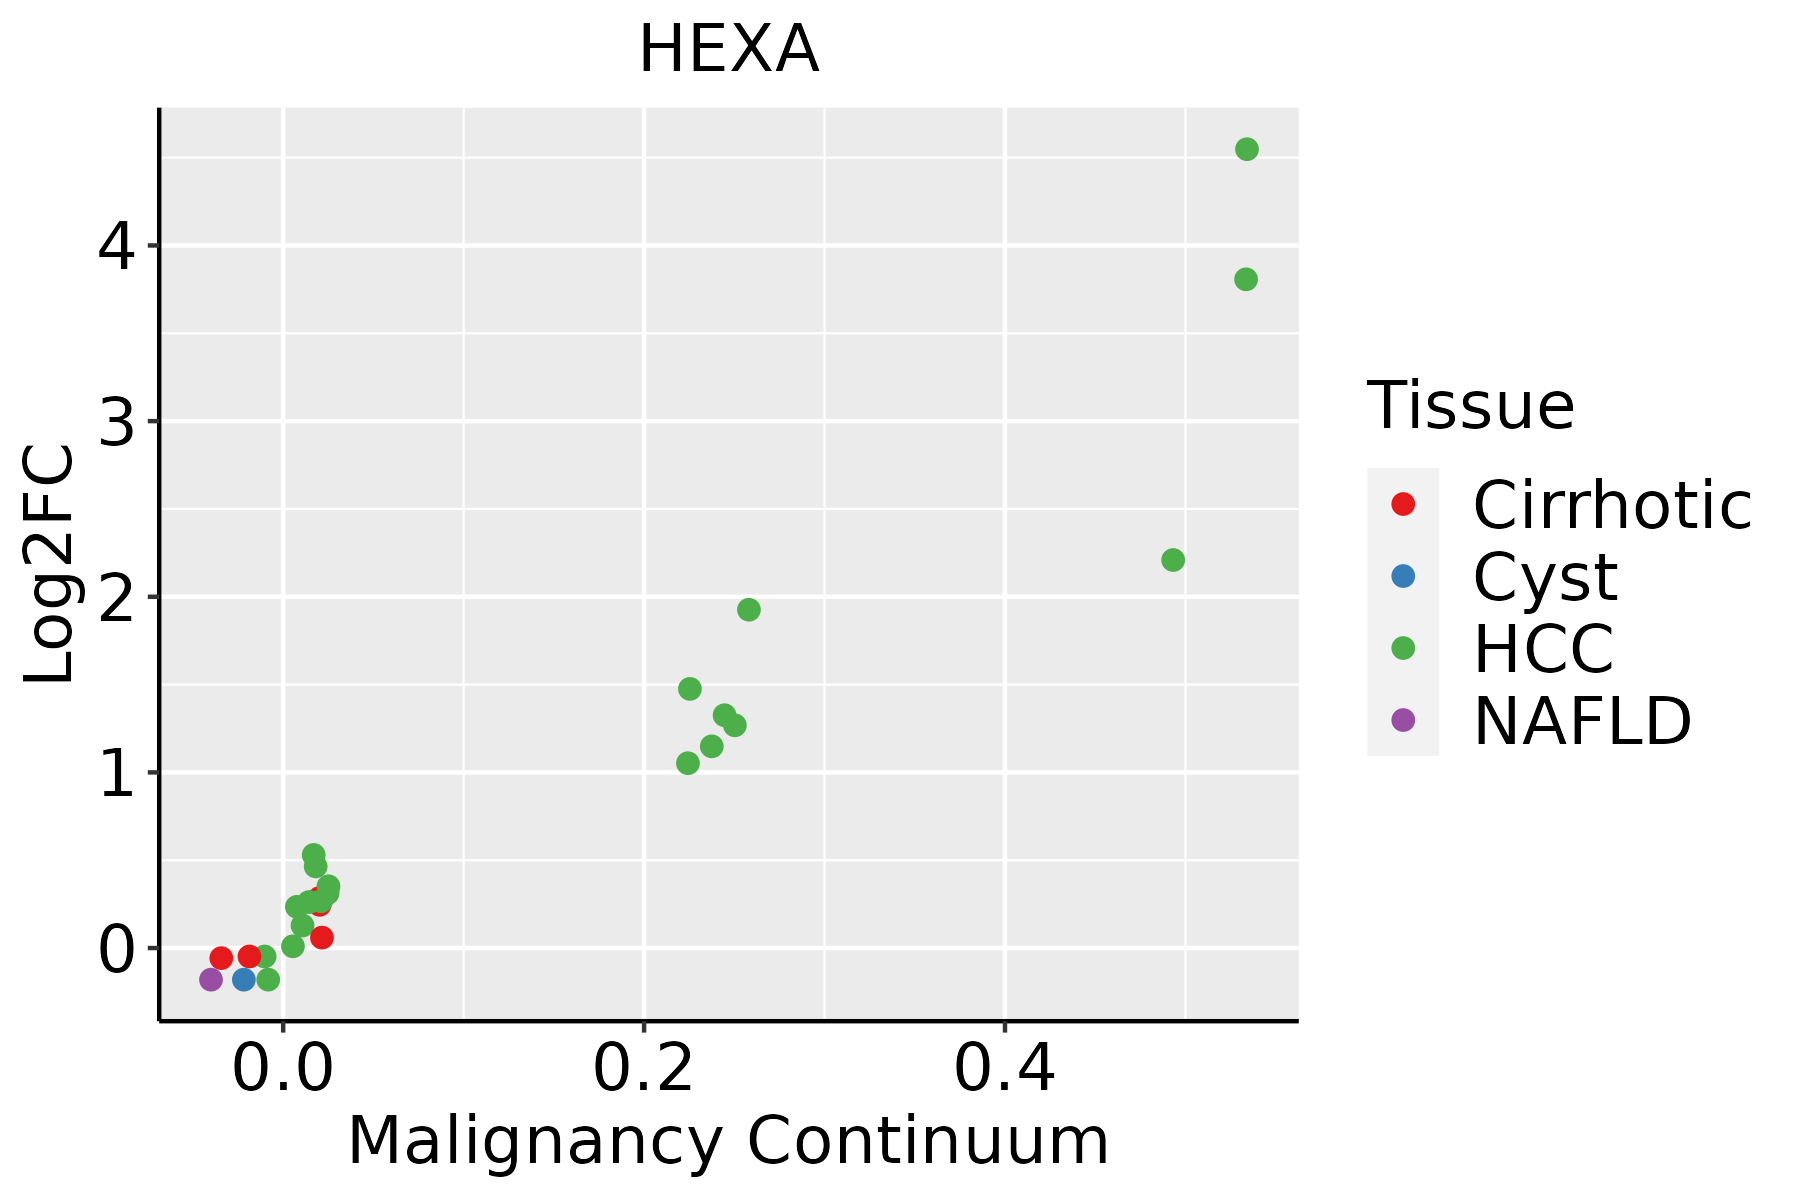 | HCC: Hepatocellular carcinoma |
| NAFLD: Non-alcoholic fatty liver disease | ||
| Oral Cavity |  | EOLP: Erosive Oral lichen planus |
| LP: leukoplakia | ||
| NEOLP: Non-erosive oral lichen planus | ||
| OSCC: Oral squamous cell carcinoma | ||
| Skin | 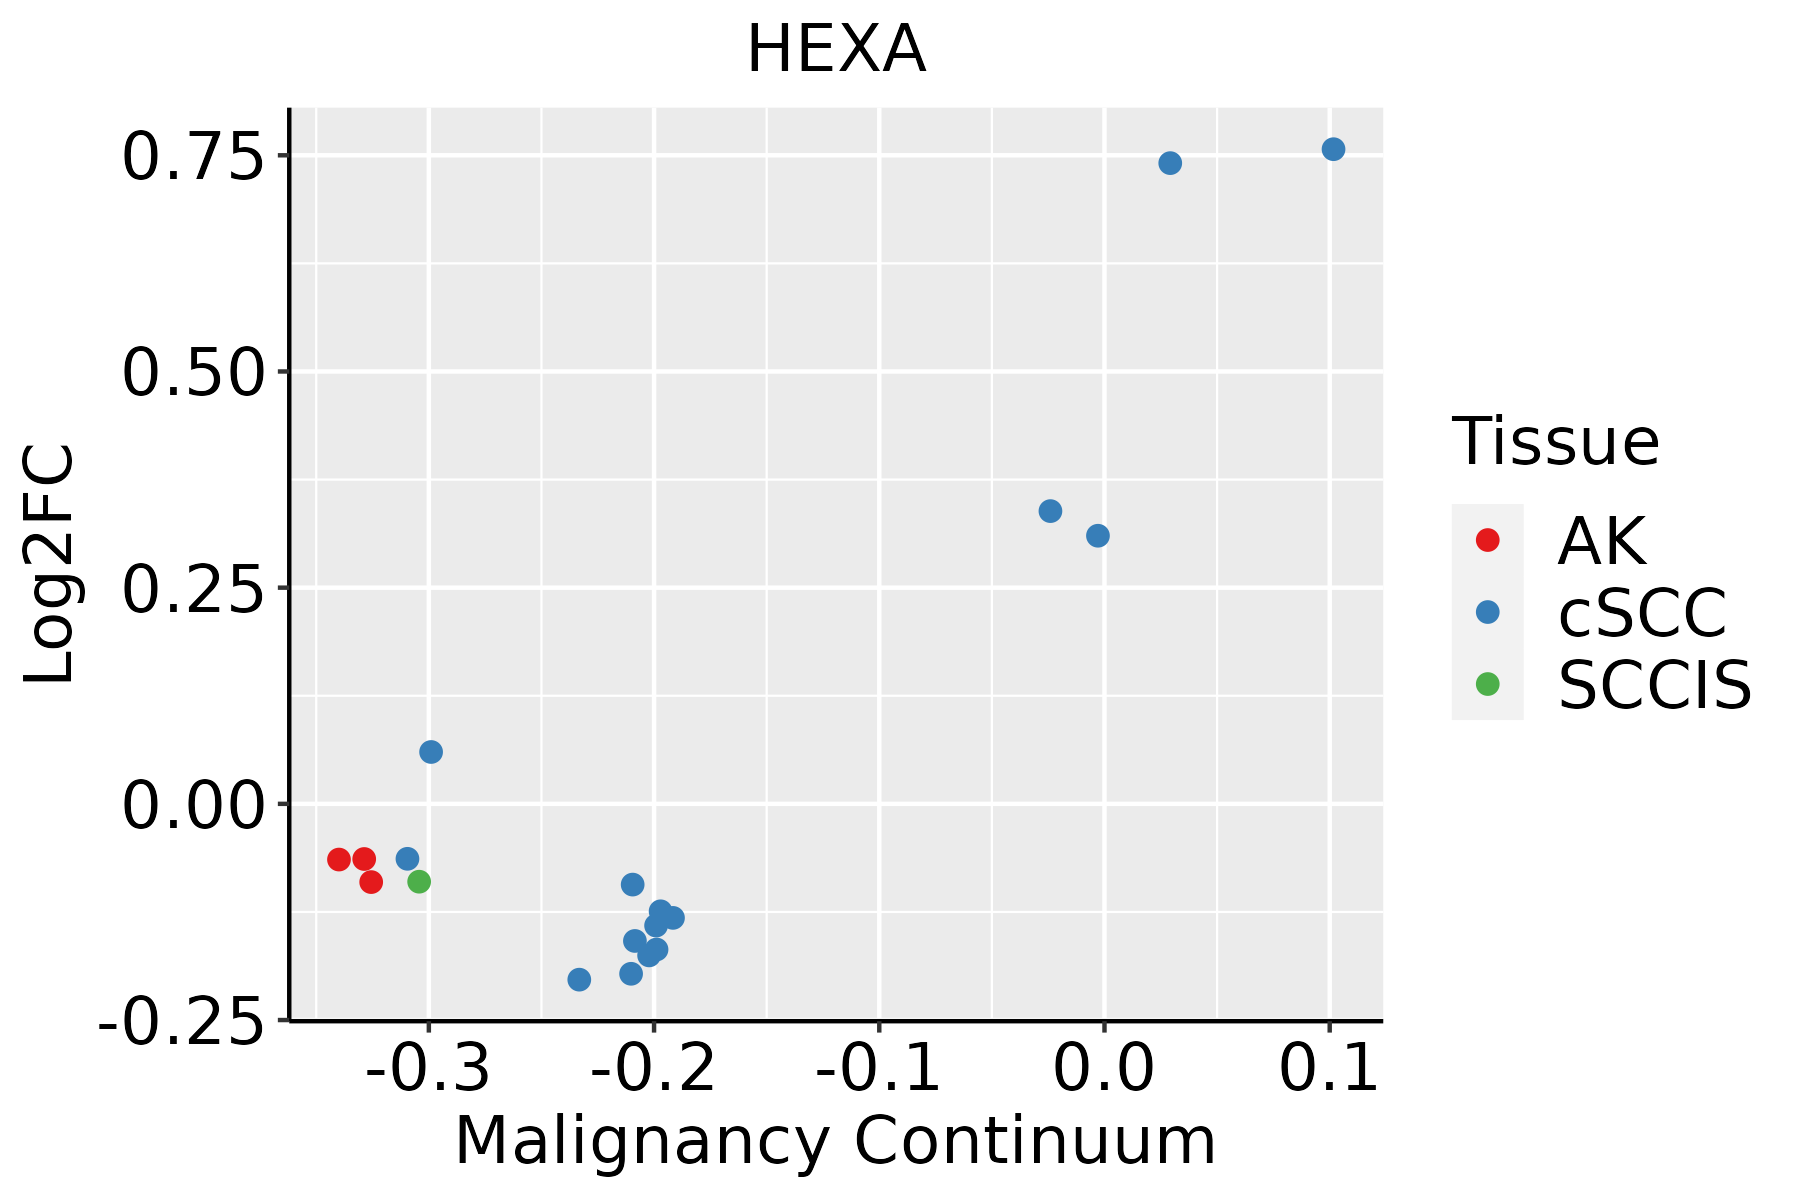 | AK: Actinic keratosis |
| cSCC: Cutaneous squamous cell carcinoma | ||
| SCCIS:squamous cell carcinoma in situ | ||
| Thyroid | 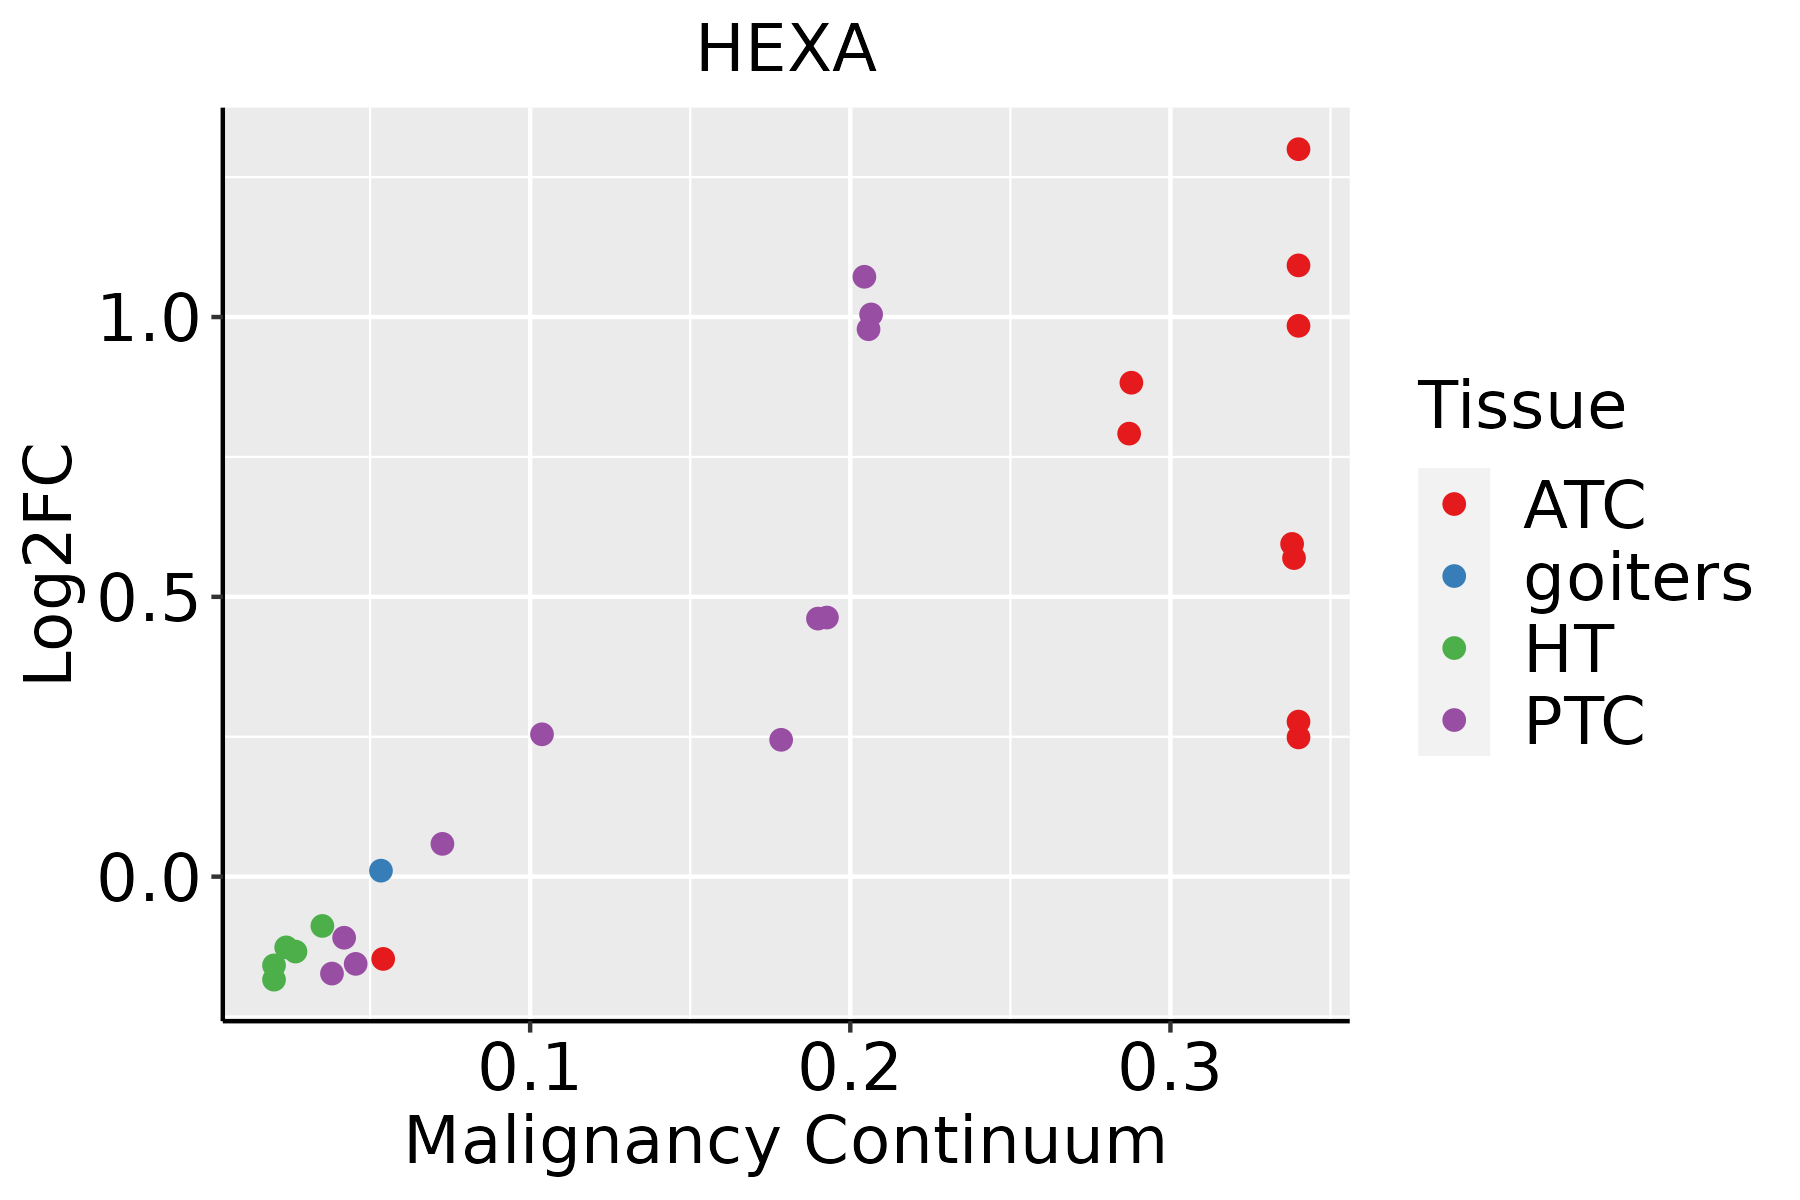 | ATC: Anaplastic thyroid cancer |
| HT: Hashimoto's thyroiditis | ||
| PTC: Papillary thyroid cancer |
| ∗log2FC in expression of this searched gene in stem-like cells from each diseased tissue sample relative to stem-like cells in normal samples in each tissue plotted against the malignancy continuum. Samples are colored based on if they are from different disease stage. |
Top |
Malignant transformation related pathway analysis |
| Find out the enriched GO biological processes and KEGG pathways involved in transition from healthy to precancer to cancer |
| Tissue | Disease Stage | Enriched GO biological Processes |
| Colorectum | AD |  |
| Colorectum | SER |  |
| Colorectum | MSS |  |
| Colorectum | MSI-H |  |
| Colorectum | FAP |  |
| ∗Top 15 enriched GO BP terms are showed in the bar plot of each disease state in each tissue. Each row represents a significant GO biological process which is colored according to the -log10(p.adjust). |
| Page: 1 2 3 4 5 6 7 8 9 |
| GO ID | Tissue | Disease Stage | Description | Gene Ratio | Bg Ratio | pvalue | p.adjust | Count |
| GO:00066433 | Esophagus | ESCC | membrane lipid metabolic process | 130/8552 | 203/18723 | 9.29e-08 | 1.54e-06 | 130 |
| GO:00066652 | Esophagus | ESCC | sphingolipid metabolic process | 96/8552 | 155/18723 | 3.21e-05 | 2.66e-04 | 96 |
| GO:00066642 | Esophagus | ESCC | glycolipid metabolic process | 63/8552 | 100/18723 | 3.55e-04 | 2.06e-03 | 63 |
| GO:19035092 | Esophagus | ESCC | liposaccharide metabolic process | 63/8552 | 101/18723 | 5.25e-04 | 2.90e-03 | 63 |
| GO:00442427 | Esophagus | ESCC | cellular lipid catabolic process | 121/8552 | 214/18723 | 8.63e-04 | 4.43e-03 | 121 |
| GO:19011362 | Esophagus | ESCC | carbohydrate derivative catabolic process | 99/8552 | 172/18723 | 1.11e-03 | 5.54e-03 | 99 |
| GO:00066721 | Esophagus | ESCC | ceramide metabolic process | 61/8552 | 102/18723 | 2.82e-03 | 1.19e-02 | 61 |
| GO:00160427 | Esophagus | ESCC | lipid catabolic process | 168/8552 | 320/18723 | 7.97e-03 | 2.84e-02 | 168 |
| GO:0006024 | Esophagus | ESCC | glycosaminoglycan biosynthetic process | 45/8552 | 75/18723 | 8.75e-03 | 3.08e-02 | 45 |
| GO:0006023 | Esophagus | ESCC | aminoglycan biosynthetic process | 47/8552 | 79/18723 | 9.29e-03 | 3.23e-02 | 47 |
| GO:004424212 | Liver | Cirrhotic | cellular lipid catabolic process | 82/4634 | 214/18723 | 6.91e-06 | 1.08e-04 | 82 |
| GO:001604212 | Liver | Cirrhotic | lipid catabolic process | 112/4634 | 320/18723 | 2.31e-05 | 3.03e-04 | 112 |
| GO:0006643 | Liver | Cirrhotic | membrane lipid metabolic process | 69/4634 | 203/18723 | 1.89e-03 | 1.19e-02 | 69 |
| GO:004424222 | Liver | HCC | cellular lipid catabolic process | 134/7958 | 214/18723 | 2.07e-09 | 5.79e-08 | 134 |
| GO:001604221 | Liver | HCC | lipid catabolic process | 175/7958 | 320/18723 | 6.50e-06 | 7.88e-05 | 175 |
| GO:00066431 | Liver | HCC | membrane lipid metabolic process | 115/7958 | 203/18723 | 3.17e-05 | 3.22e-04 | 115 |
| GO:1901136 | Liver | HCC | carbohydrate derivative catabolic process | 98/7958 | 172/18723 | 8.71e-05 | 7.62e-04 | 98 |
| GO:0006665 | Liver | HCC | sphingolipid metabolic process | 85/7958 | 155/18723 | 1.27e-03 | 6.92e-03 | 85 |
| GO:0006664 | Liver | HCC | glycolipid metabolic process | 57/7958 | 100/18723 | 2.40e-03 | 1.17e-02 | 57 |
| GO:1903509 | Liver | HCC | liposaccharide metabolic process | 57/7958 | 101/18723 | 3.25e-03 | 1.49e-02 | 57 |
| Page: 1 2 |
| Pathway ID | Tissue | Disease Stage | Description | Gene Ratio | Bg Ratio | pvalue | p.adjust | qvalue | Count |
| hsa0414222 | Esophagus | ESCC | Lysosome | 102/4205 | 132/8465 | 5.11e-11 | 7.13e-10 | 3.65e-10 | 102 |
| hsa005136 | Esophagus | ESCC | Various types of N-glycan biosynthesis | 31/4205 | 42/8465 | 1.23e-03 | 3.78e-03 | 1.93e-03 | 31 |
| hsa005202 | Esophagus | ESCC | Amino sugar and nucleotide sugar metabolism | 35/4205 | 49/8465 | 1.60e-03 | 4.88e-03 | 2.50e-03 | 35 |
| hsa006003 | Esophagus | ESCC | Sphingolipid metabolism | 36/4205 | 53/8465 | 5.41e-03 | 1.36e-02 | 6.99e-03 | 36 |
| hsa0414232 | Esophagus | ESCC | Lysosome | 102/4205 | 132/8465 | 5.11e-11 | 7.13e-10 | 3.65e-10 | 102 |
| hsa0051313 | Esophagus | ESCC | Various types of N-glycan biosynthesis | 31/4205 | 42/8465 | 1.23e-03 | 3.78e-03 | 1.93e-03 | 31 |
| hsa0052011 | Esophagus | ESCC | Amino sugar and nucleotide sugar metabolism | 35/4205 | 49/8465 | 1.60e-03 | 4.88e-03 | 2.50e-03 | 35 |
| hsa0060012 | Esophagus | ESCC | Sphingolipid metabolism | 36/4205 | 53/8465 | 5.41e-03 | 1.36e-02 | 6.99e-03 | 36 |
| hsa041424 | Liver | Cirrhotic | Lysosome | 68/2530 | 132/8465 | 1.34e-07 | 1.97e-06 | 1.21e-06 | 68 |
| hsa005134 | Liver | Cirrhotic | Various types of N-glycan biosynthesis | 26/2530 | 42/8465 | 1.65e-05 | 1.41e-04 | 8.69e-05 | 26 |
| hsa0414211 | Liver | Cirrhotic | Lysosome | 68/2530 | 132/8465 | 1.34e-07 | 1.97e-06 | 1.21e-06 | 68 |
| hsa0051311 | Liver | Cirrhotic | Various types of N-glycan biosynthesis | 26/2530 | 42/8465 | 1.65e-05 | 1.41e-04 | 8.69e-05 | 26 |
| hsa041422 | Liver | HCC | Lysosome | 100/4020 | 132/8465 | 2.32e-11 | 4.31e-10 | 2.40e-10 | 100 |
| hsa005132 | Liver | HCC | Various types of N-glycan biosynthesis | 30/4020 | 42/8465 | 1.41e-03 | 5.07e-03 | 2.82e-03 | 30 |
| hsa00511 | Liver | HCC | Other glycan degradation | 15/4020 | 18/8465 | 1.96e-03 | 6.91e-03 | 3.84e-03 | 15 |
| hsa00600 | Liver | HCC | Sphingolipid metabolism | 34/4020 | 53/8465 | 1.06e-02 | 2.71e-02 | 1.51e-02 | 34 |
| hsa041423 | Liver | HCC | Lysosome | 100/4020 | 132/8465 | 2.32e-11 | 4.31e-10 | 2.40e-10 | 100 |
| hsa005133 | Liver | HCC | Various types of N-glycan biosynthesis | 30/4020 | 42/8465 | 1.41e-03 | 5.07e-03 | 2.82e-03 | 30 |
| hsa005111 | Liver | HCC | Other glycan degradation | 15/4020 | 18/8465 | 1.96e-03 | 6.91e-03 | 3.84e-03 | 15 |
| hsa006001 | Liver | HCC | Sphingolipid metabolism | 34/4020 | 53/8465 | 1.06e-02 | 2.71e-02 | 1.51e-02 | 34 |
| Page: 1 2 |
Top |
Cell-cell communication analysis |
| Identification of potential cell-cell interactions between two cell types and their ligand-receptor pairs for different disease states |
| Ligand | Receptor | LRpair | Pathway | Tissue | Disease Stage |
| Page: 1 |
Top |
Single-cell gene regulatory network inference analysis |
| Find out the significant the regulons (TFs) and the target genes of each regulon across cell types for different disease states |
| TF | Cell Type | Tissue | Disease Stage | Target Gene | RSS | Regulon Activity |
| ∗The dot plots of a searched regulon are shown for all cell subpopulations in each disease state of each tissue based on the regulon specific score inferred using pySCENIC and by calculating the average expression. |
| Page: 1 |
Top |
Somatic mutation of malignant transformation related genes |
| Annotation of somatic variants for genes involved in malignant transformation |
| Hugo Symbol | Variant Class | Variant Classification | dbSNP RS | HGVSc | HGVSp | HGVSp Short | SWISSPROT | BIOTYPE | SIFT | PolyPhen | Tumor Sample Barcode | Tissue | Histology | Sex | Age | Stage | Therapy Types | Drugs | Outcome |
| HEXA | SNV | Missense_Mutation | c.1372G>C | p.Glu458Gln | p.E458Q | protein_coding | tolerated(0.18) | benign(0.068) | TCGA-AC-A23H-01 | Breast | breast invasive carcinoma | Female | >=65 | I/II | Unknown | Unknown | PD | ||
| HEXA | SNV | Missense_Mutation | c.1076N>C | p.Phe359Ser | p.F359S | protein_coding | deleterious(0.02) | probably_damaging(0.94) | TCGA-BH-A18G-01 | Breast | breast invasive carcinoma | Female | >=65 | I/II | Unknown | Unknown | SD | ||
| HEXA | SNV | Missense_Mutation | c.1377G>T | p.Gln459His | p.Q459H | protein_coding | deleterious(0) | probably_damaging(0.978) | TCGA-C8-A26Y-01 | Breast | breast invasive carcinoma | Female | >=65 | I/II | Unknown | Unknown | SD | ||
| HEXA | SNV | Missense_Mutation | c.1006G>A | p.Asp336Asn | p.D336N | protein_coding | tolerated(0.23) | possibly_damaging(0.86) | TCGA-E2-A1LH-01 | Breast | breast invasive carcinoma | Female | <65 | I/II | Chemotherapy | adriamycin | SD | ||
| HEXA | SNV | Missense_Mutation | c.1073N>G | p.Asp358Gly | p.D358G | protein_coding | deleterious(0) | probably_damaging(0.923) | TCGA-AA-3811-01 | Colorectum | colon adenocarcinoma | Female | >=65 | III/IV | Unknown | Unknown | PD | ||
| HEXA | SNV | Missense_Mutation | novel | c.689C>T | p.Pro230Leu | p.P230L | protein_coding | deleterious(0) | probably_damaging(0.999) | TCGA-AA-A01D-01 | Colorectum | colon adenocarcinoma | Female | <65 | III/IV | Chemotherapy | capecitabine | PD | |
| HEXA | SNV | Missense_Mutation | rs766966378 | c.293G>A | p.Arg98Gln | p.R98Q | protein_coding | tolerated(0.66) | benign(0.001) | TCGA-D5-6927-01 | Colorectum | colon adenocarcinoma | Male | <65 | I/II | Unknown | Unknown | SD | |
| HEXA | SNV | Missense_Mutation | c.756G>T | p.Glu252Asp | p.E252D | protein_coding | tolerated(0.6) | benign(0.007) | TCGA-F4-6570-01 | Colorectum | colon adenocarcinoma | Female | >=65 | I/II | Unknown | Unknown | SD | ||
| HEXA | SNV | Missense_Mutation | rs780078337 | c.62N>T | p.Thr21Met | p.T21M | protein_coding | tolerated(0.11) | benign(0.34) | TCGA-A5-A0G1-01 | Endometrium | uterine corpus endometrioid carcinoma | Female | >=65 | I/II | Unknown | Unknown | SD | |
| HEXA | SNV | Missense_Mutation | rs138058578 | c.778N>T | p.Arg260Trp | p.R260W | protein_coding | deleterious(0.01) | benign(0.329) | TCGA-AP-A056-01 | Endometrium | uterine corpus endometrioid carcinoma | Female | <65 | I/II | Unknown | Unknown | SD |
| Page: 1 2 3 4 |
Top |
Related drugs of malignant transformation related genes |
| Identification of chemicals and drugs interact with genes involved in malignant transfromation |
| (DGIdb 4.0) |
| Entrez ID | Symbol | Category | Interaction Types | Drug Claim Name | Drug Name | PMIDs |
| 3073 | HEXA | DRUGGABLE GENOME, ENZYME | N-ACETYLGLUCOSAMINE THIAZOLINE | CHEMBL257158 | 20822912 | |
| 3073 | HEXA | DRUGGABLE GENOME, ENZYME | THIOCORALINE | THIOCORALINE | ||
| 3073 | HEXA | DRUGGABLE GENOME, ENZYME | ECHINOMYCIN | ECHINOMYCIN | ||
| 3073 | HEXA | DRUGGABLE GENOME, ENZYME | TCMDC-124296 | CHEMBL22148 | 25984755 | |
| 3073 | HEXA | DRUGGABLE GENOME, ENZYME | PYRIMETHAMINE | PYRIMETHAMINE | 25984755,17237499 |
| Page: 1 |

Copyright 2023-Present -The University of Texas Health Science Center at Houston |