
|
|||||
|
 | |
| |
| |
| |
| |
| |
|
Gene: HES6 |
Gene summary for HES6 |
| Gene information | Species | Human | Gene symbol | HES6 | Gene ID | 55502 |
| Gene name | hes family bHLH transcription factor 6 | |
| Gene Alias | C-HAIRY1 | |
| Cytomap | 2q37.3 | |
| Gene Type | protein-coding | GO ID | GO:0000122 | UniProtAcc | Q96HZ4 |
Top |
Malignant transformation analysis |
| Identification of the aberrant gene expression in precancerous and cancerous lesions by comparing the gene expression of stem-like cells in diseased tissues with normal stem cells |
| Entrez ID | Symbol | Replicates | Species | Organ | Tissue | Adj P-value | Log2FC | Malignancy |
| 55502 | HES6 | HTA11_2487_2000001011 | Human | Colorectum | SER | 4.80e-03 | 2.36e-01 | -0.1808 |
| 55502 | HES6 | HTA11_1938_2000001011 | Human | Colorectum | AD | 5.05e-07 | 4.41e-01 | -0.0811 |
| 55502 | HES6 | HTA11_347_2000001011 | Human | Colorectum | AD | 1.95e-04 | 1.44e-01 | -0.1954 |
| 55502 | HES6 | HTA11_3361_2000001011 | Human | Colorectum | AD | 2.44e-03 | 3.11e-01 | -0.1207 |
| 55502 | HES6 | HTA11_696_2000001011 | Human | Colorectum | AD | 1.16e-18 | 7.14e-01 | -0.1464 |
| 55502 | HES6 | HTA11_1391_2000001011 | Human | Colorectum | AD | 4.74e-11 | 4.86e-01 | -0.059 |
| 55502 | HES6 | HTA11_546_2000001011 | Human | Colorectum | AD | 3.99e-02 | 3.36e-01 | -0.0842 |
| 55502 | HES6 | HTA11_866_3004761011 | Human | Colorectum | AD | 1.71e-11 | 4.06e-01 | 0.096 |
| 55502 | HES6 | HTA11_7663_2000001011 | Human | Colorectum | SER | 1.25e-02 | 3.45e-01 | 0.0131 |
| 55502 | HES6 | HTA11_10711_2000001011 | Human | Colorectum | AD | 3.95e-03 | 2.01e-01 | 0.0338 |
| 55502 | HES6 | HTA11_7696_3000711011 | Human | Colorectum | AD | 3.98e-13 | 4.68e-01 | 0.0674 |
| 55502 | HES6 | HTA11_6818_2000001021 | Human | Colorectum | AD | 4.76e-04 | 1.92e-01 | 0.0588 |
| 55502 | HES6 | HTA11_99999970781_79442 | Human | Colorectum | MSS | 2.59e-12 | 3.91e-01 | 0.294 |
| 55502 | HES6 | HTA11_99999965062_69753 | Human | Colorectum | MSI-H | 9.42e-08 | 1.19e+00 | 0.3487 |
| 55502 | HES6 | HTA11_99999971662_82457 | Human | Colorectum | MSS | 6.88e-09 | 5.24e-01 | 0.3859 |
| 55502 | HES6 | HTA11_99999973899_84307 | Human | Colorectum | MSS | 1.93e-10 | 5.02e-01 | 0.2585 |
| 55502 | HES6 | HTA11_99999974143_84620 | Human | Colorectum | MSS | 1.70e-22 | 6.26e-01 | 0.3005 |
| 55502 | HES6 | LZE24T | Human | Esophagus | ESCC | 4.05e-07 | 2.56e-01 | 0.0596 |
| 55502 | HES6 | P1T-E | Human | Esophagus | ESCC | 3.04e-02 | 1.87e-01 | 0.0875 |
| 55502 | HES6 | P2T-E | Human | Esophagus | ESCC | 4.49e-13 | 3.20e-01 | 0.1177 |
| Page: 1 2 3 4 |
| Tissue | Expression Dynamics | Abbreviation |
| Colorectum (GSE201348) |  | FAP: Familial adenomatous polyposis |
| CRC: Colorectal cancer | ||
| Colorectum (HTA11) | 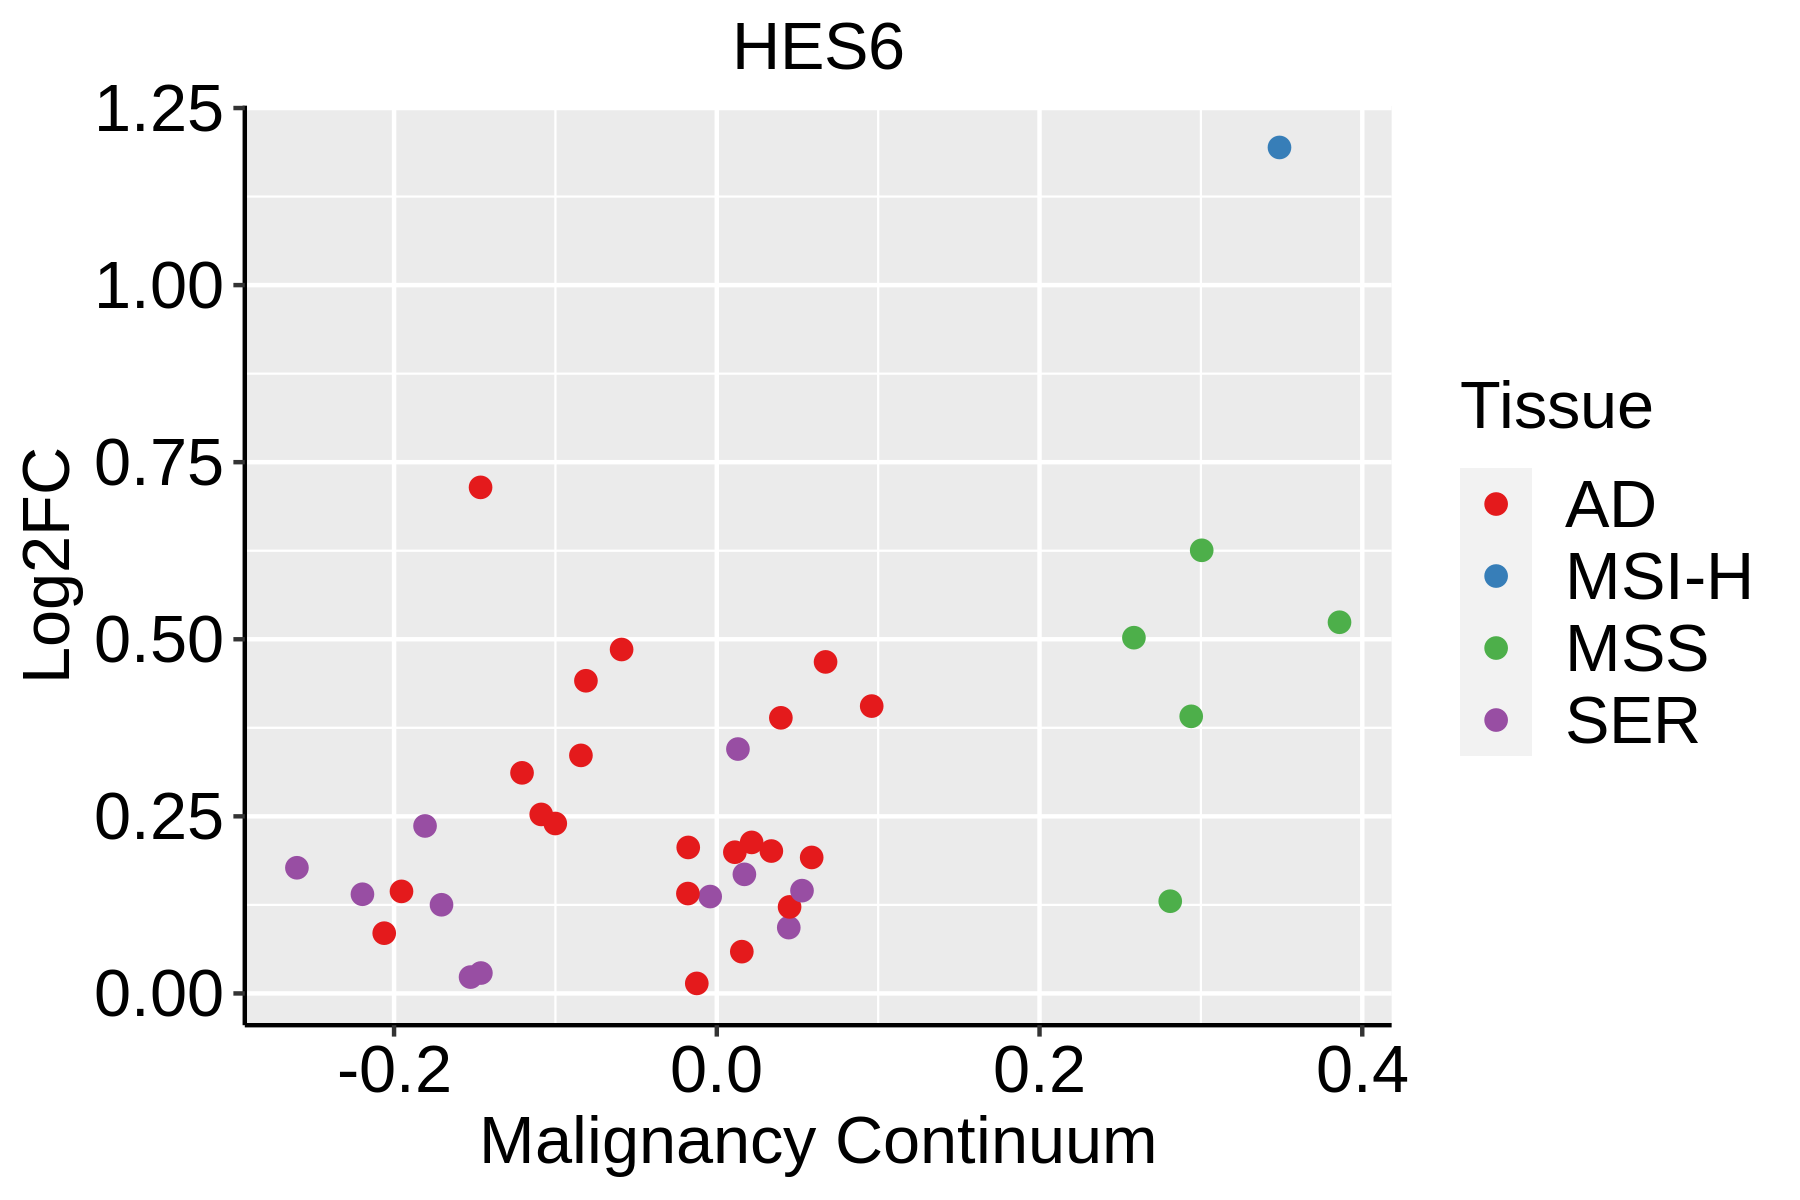 | AD: Adenomas |
| SER: Sessile serrated lesions | ||
| MSI-H: Microsatellite-high colorectal cancer | ||
| MSS: Microsatellite stable colorectal cancer | ||
| Esophagus | 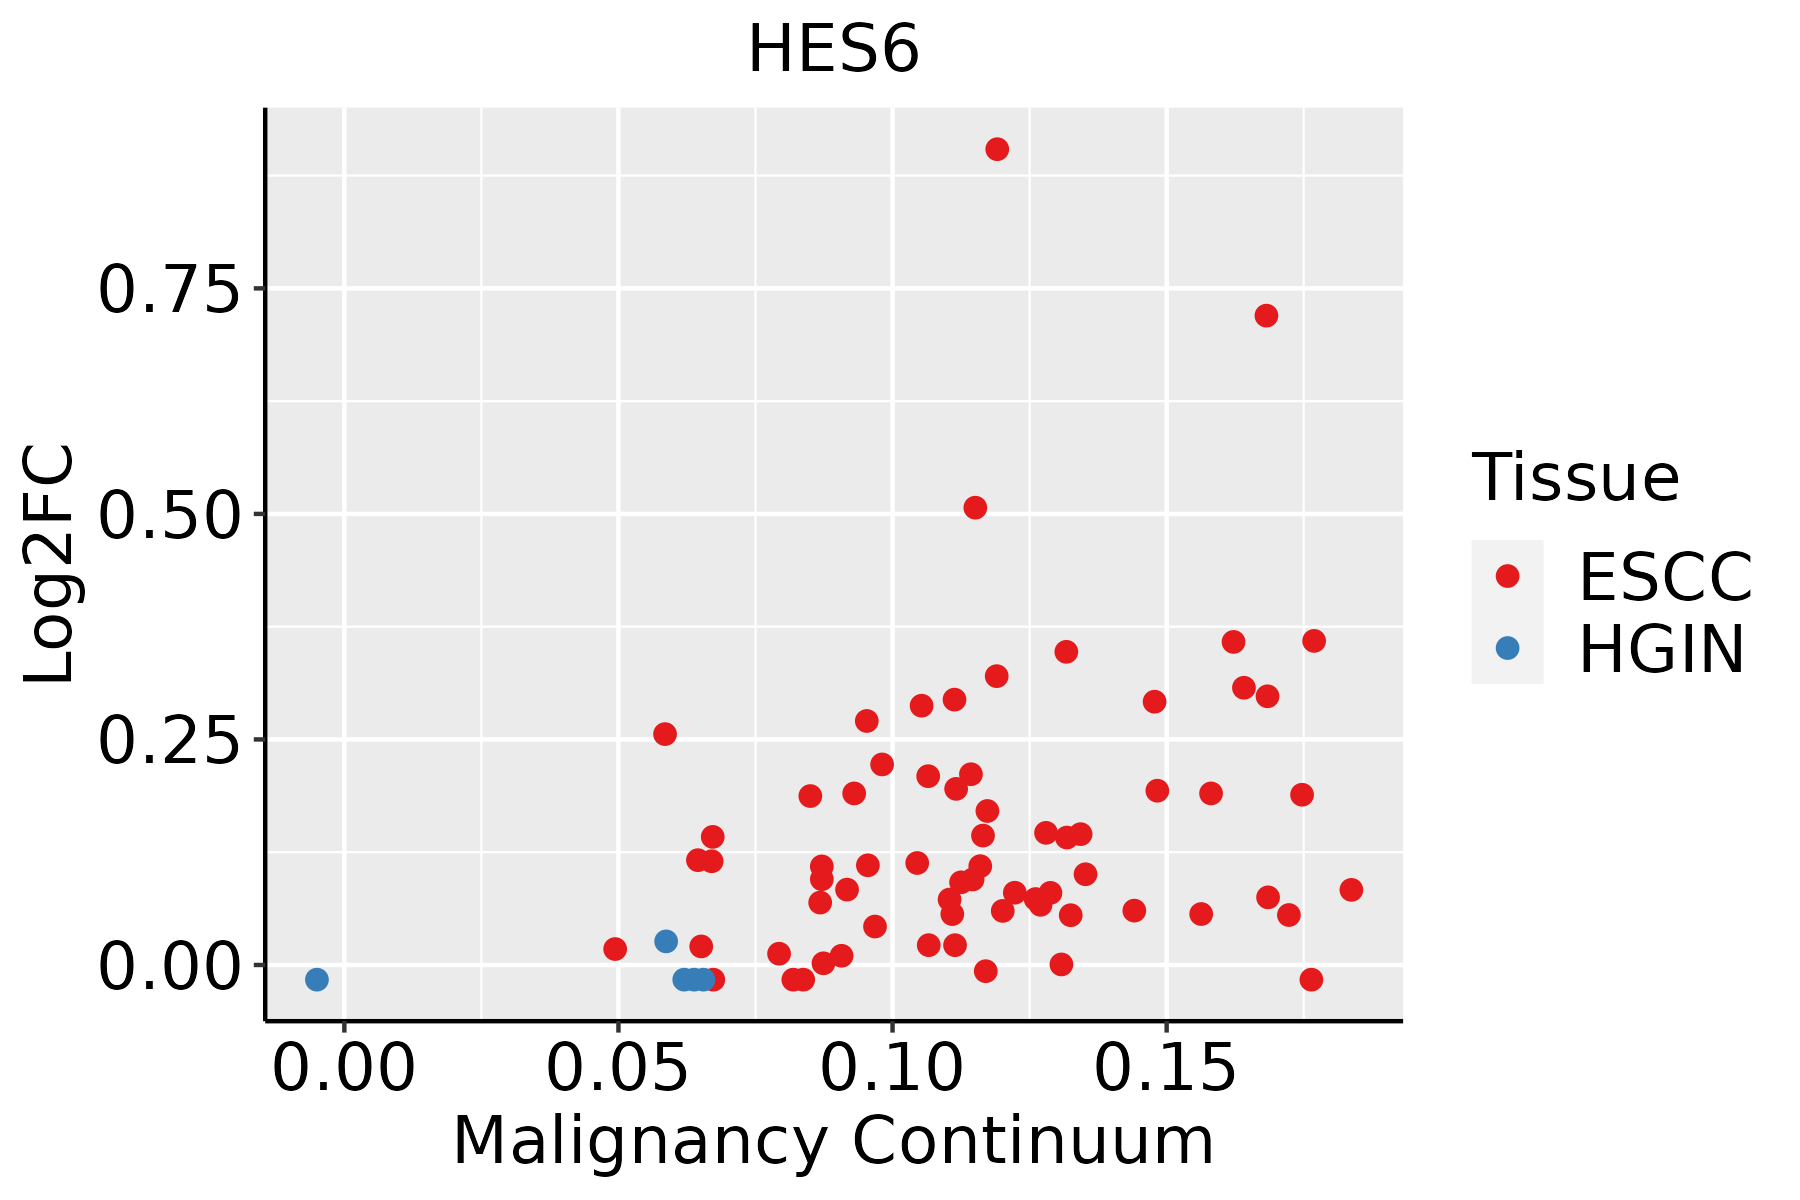 | ESCC: Esophageal squamous cell carcinoma |
| HGIN: High-grade intraepithelial neoplasias | ||
| LGIN: Low-grade intraepithelial neoplasias | ||
| Liver | 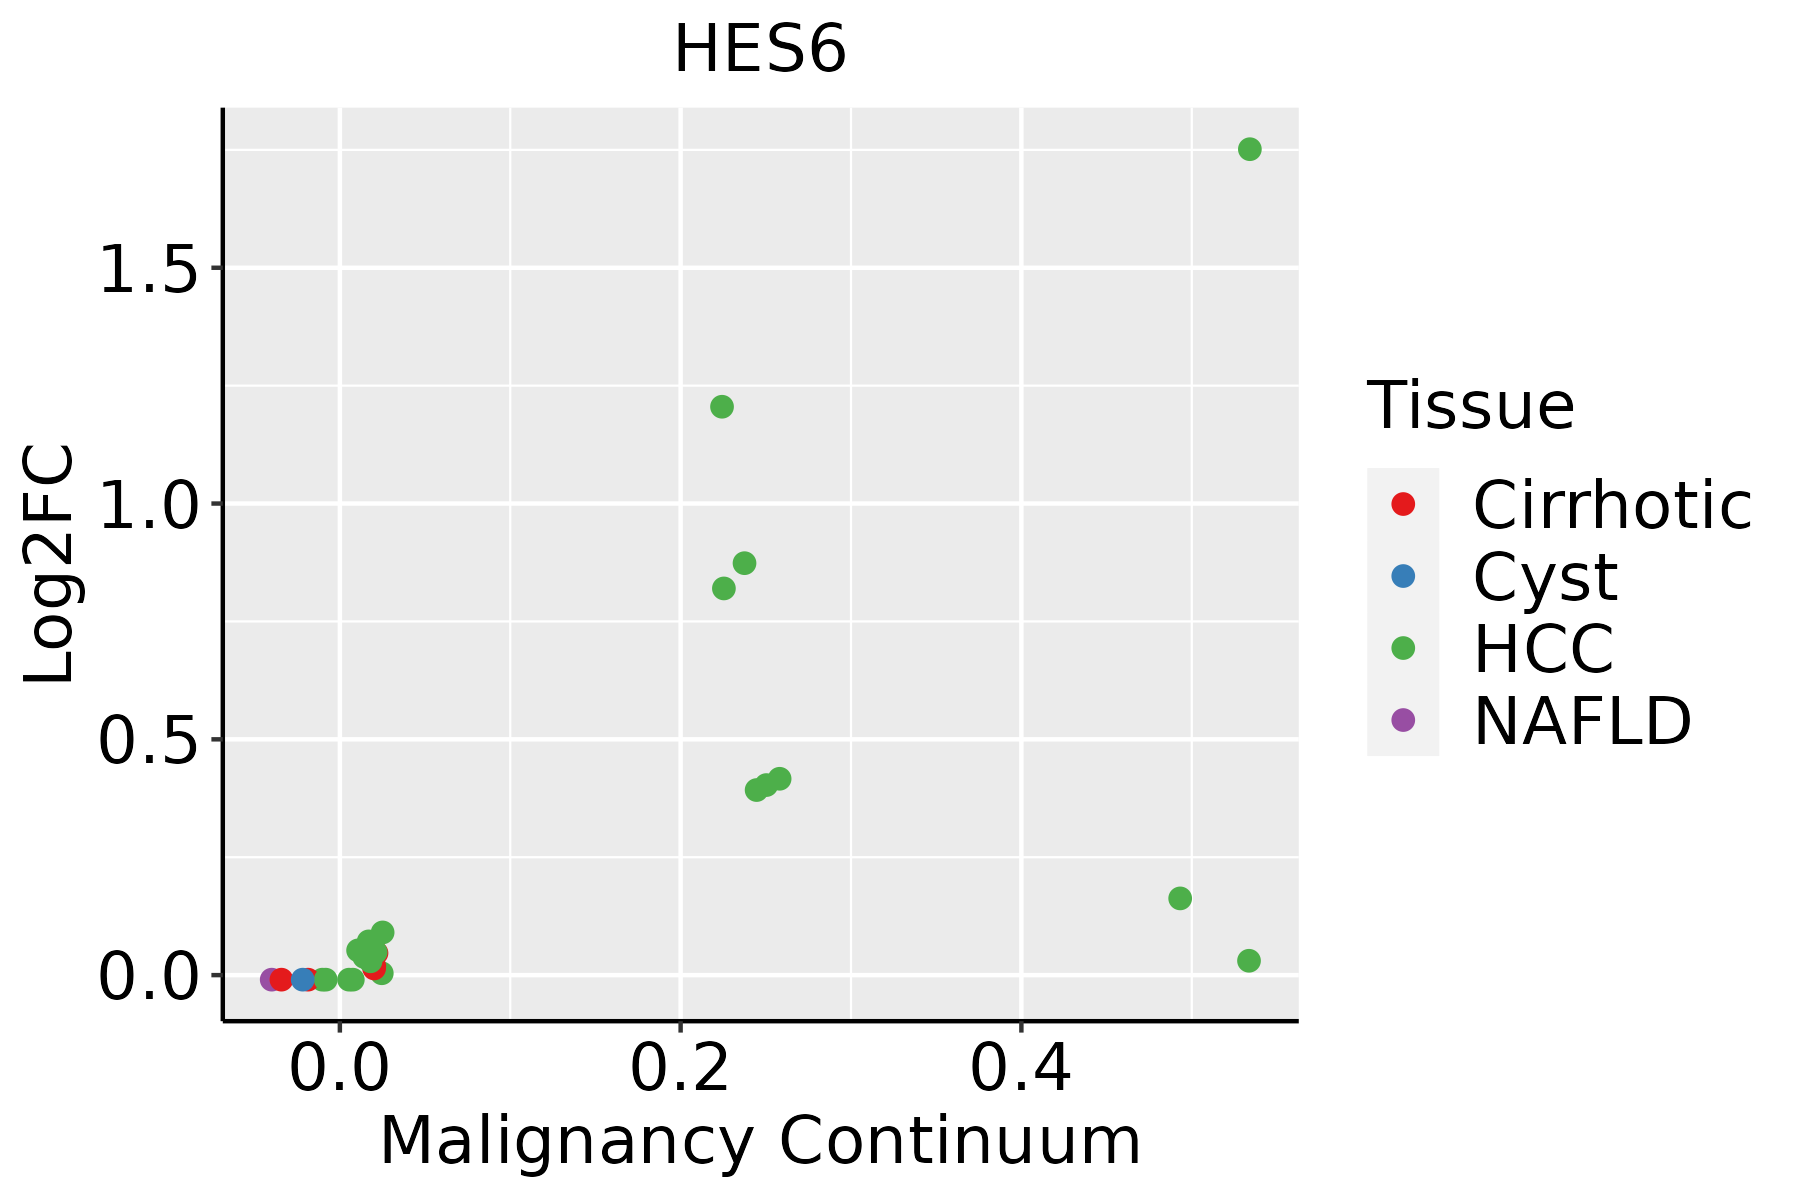 | HCC: Hepatocellular carcinoma |
| NAFLD: Non-alcoholic fatty liver disease | ||
| Oral Cavity | 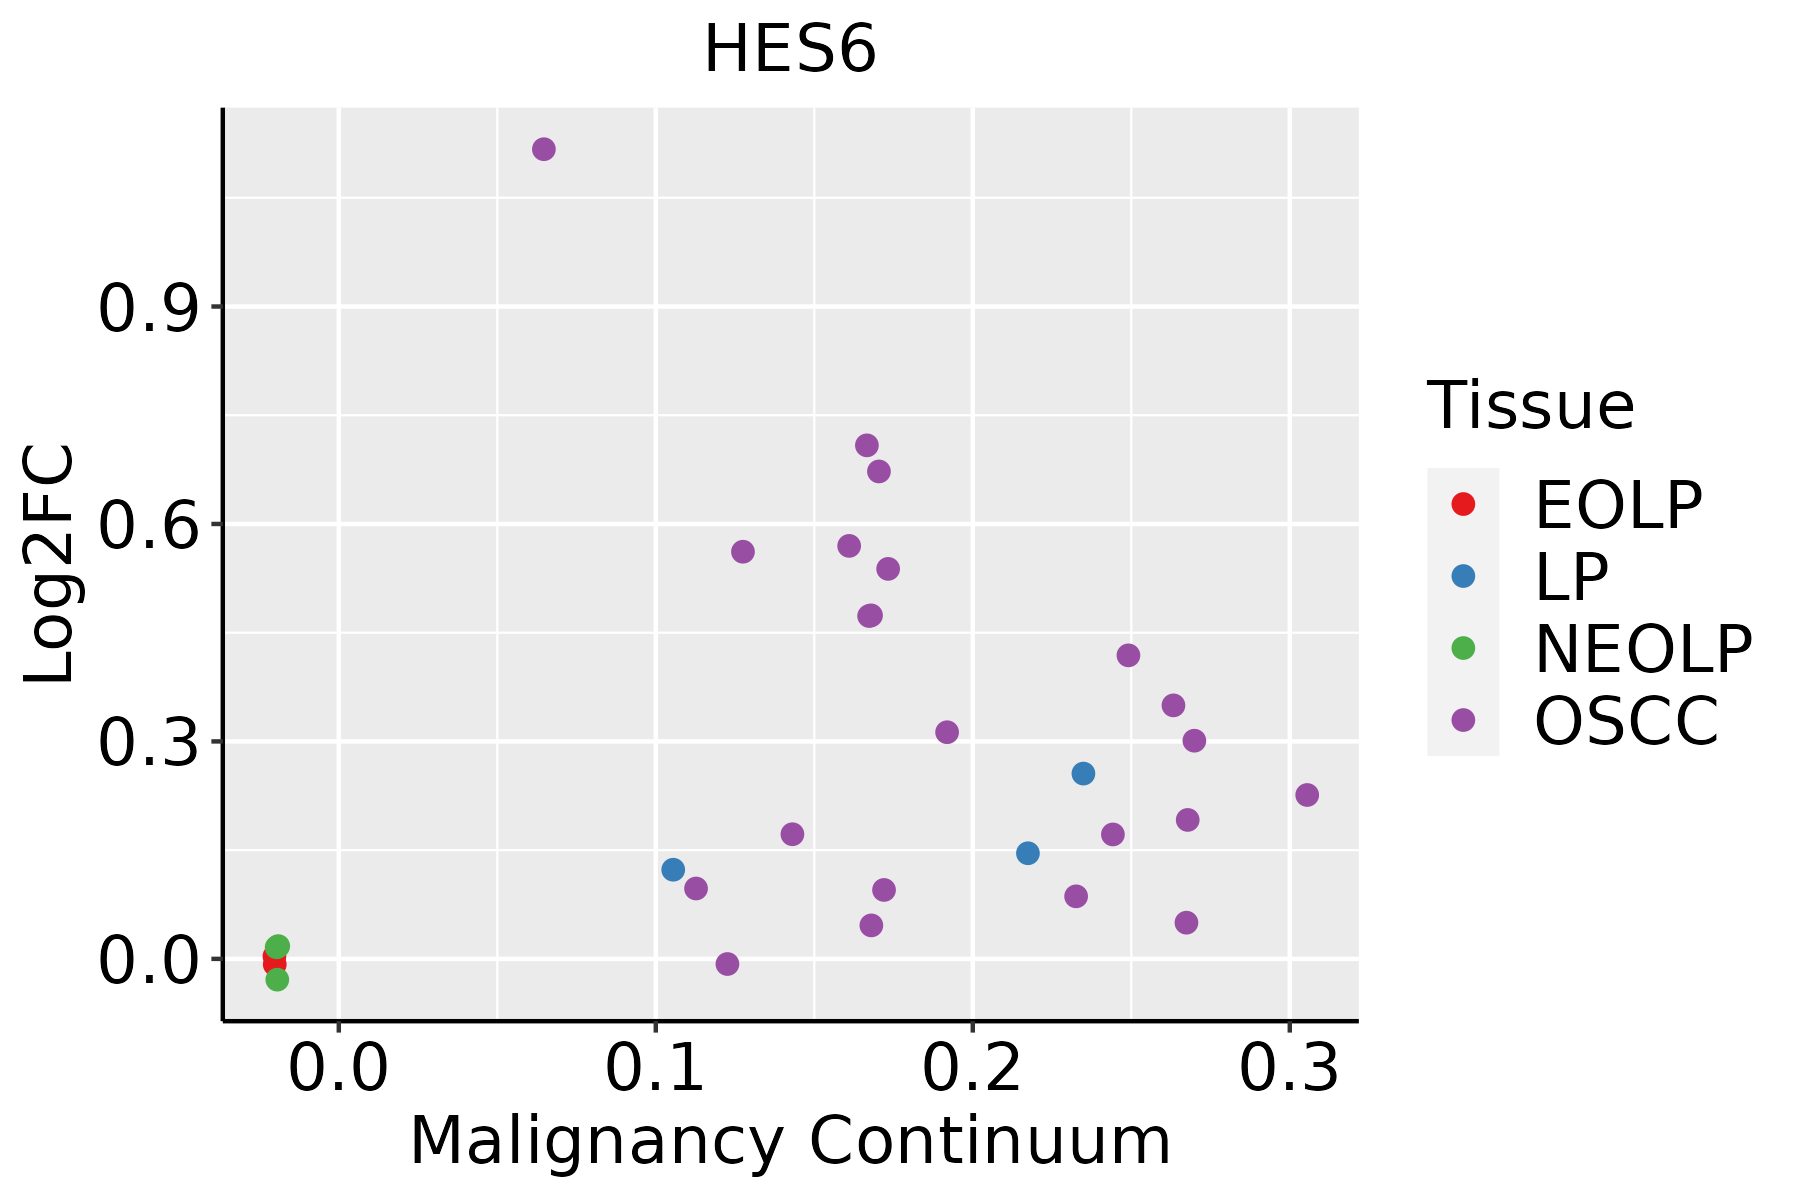 | EOLP: Erosive Oral lichen planus |
| LP: leukoplakia | ||
| NEOLP: Non-erosive oral lichen planus | ||
| OSCC: Oral squamous cell carcinoma |
| ∗log2FC in expression of this searched gene in stem-like cells from each diseased tissue sample relative to stem-like cells in normal samples in each tissue plotted against the malignancy continuum. Samples are colored based on if they are from different disease stage. |
Top |
Malignant transformation related pathway analysis |
| Find out the enriched GO biological processes and KEGG pathways involved in transition from healthy to precancer to cancer |
| Tissue | Disease Stage | Enriched GO biological Processes |
| Colorectum | AD |  |
| Colorectum | SER |  |
| Colorectum | MSS |  |
| Colorectum | MSI-H |  |
| Colorectum | FAP |  |
| ∗Top 15 enriched GO BP terms are showed in the bar plot of each disease state in each tissue. Each row represents a significant GO biological process which is colored according to the -log10(p.adjust). |
| Page: 1 2 3 4 5 6 7 8 9 |
| GO ID | Tissue | Disease Stage | Description | Gene Ratio | Bg Ratio | pvalue | p.adjust | Count |
| GO:0050767 | Colorectum | AD | regulation of neurogenesis | 99/3918 | 364/18723 | 2.35e-03 | 1.82e-02 | 99 |
| GO:00507671 | Colorectum | MSS | regulation of neurogenesis | 94/3467 | 364/18723 | 3.12e-04 | 4.06e-03 | 94 |
| GO:0051090 | Colorectum | MSS | regulation of DNA-binding transcription factor activity | 106/3467 | 440/18723 | 1.88e-03 | 1.65e-02 | 106 |
| GO:0051960 | Colorectum | MSS | regulation of nervous system development | 103/3467 | 443/18723 | 6.68e-03 | 4.38e-02 | 103 |
| GO:00510908 | Esophagus | ESCC | regulation of DNA-binding transcription factor activity | 252/8552 | 440/18723 | 5.22e-07 | 6.97e-06 | 252 |
| GO:005076710 | Esophagus | ESCC | regulation of neurogenesis | 203/8552 | 364/18723 | 6.10e-05 | 4.68e-04 | 203 |
| GO:00519606 | Esophagus | ESCC | regulation of nervous system development | 237/8552 | 443/18723 | 5.02e-04 | 2.78e-03 | 237 |
| GO:00434332 | Esophagus | ESCC | negative regulation of DNA-binding transcription factor activity | 103/8552 | 185/18723 | 3.86e-03 | 1.57e-02 | 103 |
| GO:00510902 | Liver | HCC | regulation of DNA-binding transcription factor activity | 220/7958 | 440/18723 | 8.04e-04 | 4.82e-03 | 220 |
| GO:00507674 | Liver | HCC | regulation of neurogenesis | 181/7958 | 364/18723 | 3.00e-03 | 1.40e-02 | 181 |
| GO:00510907 | Oral cavity | OSCC | regulation of DNA-binding transcription factor activity | 221/7305 | 440/18723 | 9.06e-07 | 1.23e-05 | 221 |
| GO:00507679 | Oral cavity | OSCC | regulation of neurogenesis | 179/7305 | 364/18723 | 4.49e-05 | 3.84e-04 | 179 |
| GO:00519605 | Oral cavity | OSCC | regulation of nervous system development | 205/7305 | 443/18723 | 9.80e-04 | 5.11e-03 | 205 |
| Page: 1 |
| Pathway ID | Tissue | Disease Stage | Description | Gene Ratio | Bg Ratio | pvalue | p.adjust | qvalue | Count |
| hsa0516510 | Esophagus | ESCC | Human papillomavirus infection | 215/4205 | 331/8465 | 7.86e-09 | 7.12e-08 | 3.65e-08 | 215 |
| hsa0516515 | Esophagus | ESCC | Human papillomavirus infection | 215/4205 | 331/8465 | 7.86e-09 | 7.12e-08 | 3.65e-08 | 215 |
| hsa051652 | Liver | HCC | Human papillomavirus infection | 188/4020 | 331/8465 | 3.34e-04 | 1.49e-03 | 8.29e-04 | 188 |
| hsa051653 | Liver | HCC | Human papillomavirus infection | 188/4020 | 331/8465 | 3.34e-04 | 1.49e-03 | 8.29e-04 | 188 |
| hsa051659 | Oral cavity | OSCC | Human papillomavirus infection | 200/3704 | 331/8465 | 3.83e-10 | 4.93e-09 | 2.51e-09 | 200 |
| hsa0516514 | Oral cavity | OSCC | Human papillomavirus infection | 200/3704 | 331/8465 | 3.83e-10 | 4.93e-09 | 2.51e-09 | 200 |
| Page: 1 |
Top |
Cell-cell communication analysis |
| Identification of potential cell-cell interactions between two cell types and their ligand-receptor pairs for different disease states |
| Ligand | Receptor | LRpair | Pathway | Tissue | Disease Stage |
| Page: 1 |
Top |
Single-cell gene regulatory network inference analysis |
| Find out the significant the regulons (TFs) and the target genes of each regulon across cell types for different disease states |
| TF | Cell Type | Tissue | Disease Stage | Target Gene | RSS | Regulon Activity |
| HES6 | CD8TRM | Breast | ADJ | FGFBP2,SPON2,CLIC3, etc. | 5.67e-02 |  |
| HES6 | CD8TEREX | Breast | Healthy | FGFBP2,SPON2,CLIC3, etc. | 1.15e-01 |  |
| HES6 | GDT | Cervix | CC | KRT81,TMIGD2,CLIC3, etc. | 1.30e-01 |  |
| HES6 | CD8TEX | Endometrium | ADJ | IGFBP2,NKG7,CLIC3, etc. | 4.64e-02 |  |
| HES6 | NK | Endometrium | ADJ | IGFBP2,NKG7,CLIC3, etc. | 4.09e-01 | |
| HES6 | NK | Endometrium | AEH | IGFBP2,NKG7,CLIC3, etc. | 9.70e-02 |  |
| HES6 | CD8TEX | Endometrium | Healthy | IGFBP2,NKG7,CLIC3, etc. | 1.47e-01 |  |
| HES6 | AT1 | Lung | AAH | MT-CO3,NREP,PODXL2, etc. | 1.12e-02 |  |
| HES6 | BAS | Lung | AAH | MT-CO3,NREP,PODXL2, etc. | 0.00e+00 | |
| HES6 | ABP | Lung | ADJ | MT-CO3,NREP,PODXL2, etc. | 0.00e+00 |  |
| ∗The dot plots of a searched regulon are shown for all cell subpopulations in each disease state of each tissue based on the regulon specific score inferred using pySCENIC and by calculating the average expression. |
| Page: 1 2 3 4 |
Top |
Somatic mutation of malignant transformation related genes |
| Annotation of somatic variants for genes involved in malignant transformation |
| Hugo Symbol | Variant Class | Variant Classification | dbSNP RS | HGVSc | HGVSp | HGVSp Short | SWISSPROT | BIOTYPE | SIFT | PolyPhen | Tumor Sample Barcode | Tissue | Histology | Sex | Age | Stage | Therapy Types | Drugs | Outcome |
| HES6 | SNV | Missense_Mutation | novel | c.640N>A | p.Ala214Thr | p.A214T | Q96HZ4 | protein_coding | tolerated(0.16) | benign(0.005) | TCGA-VS-A94W-01 | Cervix | cervical & endocervical cancer | Female | <65 | I/II | Chemotherapy | cisplatin | CR |
| HES6 | SNV | Missense_Mutation | novel | c.548C>T | p.Ser183Phe | p.S183F | Q96HZ4 | protein_coding | deleterious(0) | probably_damaging(0.98) | TCGA-AA-3947-01 | Colorectum | colon adenocarcinoma | Female | <65 | I/II | Unknown | Unknown | SD |
| HES6 | SNV | Missense_Mutation | novel | c.524C>T | p.Pro175Leu | p.P175L | Q96HZ4 | protein_coding | tolerated(0.1) | benign(0) | TCGA-IQ-7630-01 | Oral cavity | head & neck squamous cell carcinoma | Male | <65 | I/II | Chemotherapy | docetaxel | CR |
| HES6 | SNV | Missense_Mutation | novel | c.361N>T | p.Val121Phe | p.V121F | Q96HZ4 | protein_coding | deleterious(0.04) | possibly_damaging(0.722) | TCGA-VQ-A91K-01 | Stomach | stomach adenocarcinoma | Male | >=65 | III/IV | Chemotherapy | fluorouracil | CR |
| Page: 1 |
Top |
Related drugs of malignant transformation related genes |
| Identification of chemicals and drugs interact with genes involved in malignant transfromation |
| (DGIdb 4.0) |
| Entrez ID | Symbol | Category | Interaction Types | Drug Claim Name | Drug Name | PMIDs |
| Page: 1 |

Copyright 2023-Present -The University of Texas Health Science Center at Houston |