
|
|||||
|
 | |
| |
| |
| |
| |
| |
|
Gene: HES4 |
Gene summary for HES4 |
| Gene information | Species | Human | Gene symbol | HES4 | Gene ID | 57801 |
| Gene name | hes family bHLH transcription factor 4 | |
| Gene Alias | bHLHb42 | |
| Cytomap | 1p36.33 | |
| Gene Type | protein-coding | GO ID | GO:0003002 | UniProtAcc | E9PB28 |
Top |
Malignant transformation analysis |
| Identification of the aberrant gene expression in precancerous and cancerous lesions by comparing the gene expression of stem-like cells in diseased tissues with normal stem cells |
| Entrez ID | Symbol | Replicates | Species | Organ | Tissue | Adj P-value | Log2FC | Malignancy |
| 57801 | HES4 | AEH-subject1 | Human | Endometrium | AEH | 4.87e-03 | 4.39e-01 | -0.3059 |
| 57801 | HES4 | AEH-subject2 | Human | Endometrium | AEH | 1.85e-05 | 3.74e-01 | -0.2525 |
| 57801 | HES4 | AEH-subject3 | Human | Endometrium | AEH | 1.77e-10 | 4.75e-01 | -0.2576 |
| 57801 | HES4 | EEC-subject2 | Human | Endometrium | EEC | 6.56e-22 | 6.78e-01 | -0.2607 |
| 57801 | HES4 | EEC-subject3 | Human | Endometrium | EEC | 3.54e-09 | -1.08e-01 | -0.2525 |
| 57801 | HES4 | EEC-subject5 | Human | Endometrium | EEC | 4.18e-03 | 3.25e-01 | -0.249 |
| 57801 | HES4 | GSM5276935 | Human | Endometrium | EEC | 1.44e-11 | 4.53e-01 | -0.123 |
| 57801 | HES4 | GSM6177620_NYU_UCEC1_lib1_lib1 | Human | Endometrium | EEC | 8.70e-10 | -1.32e-01 | -0.1869 |
| 57801 | HES4 | GSM6177620_NYU_UCEC1_lib2_lib2 | Human | Endometrium | EEC | 7.23e-07 | -2.64e-01 | -0.1875 |
| 57801 | HES4 | GSM6177620_NYU_UCEC1_lib3_lib3 | Human | Endometrium | EEC | 3.47e-09 | -2.55e-01 | -0.1883 |
| 57801 | HES4 | GSM6177621_NYU_UCEC2_lib1_lib1 | Human | Endometrium | EEC | 1.49e-11 | -2.19e-01 | -0.1934 |
| 57801 | HES4 | GSM6177622_NYU_UCEC3_lib1_lib1 | Human | Endometrium | EEC | 4.39e-14 | -2.58e-01 | -0.1917 |
| 57801 | HES4 | GSM6177622_NYU_UCEC3_lib2_lib2 | Human | Endometrium | EEC | 2.01e-13 | -2.98e-01 | -0.1916 |
| 57801 | HES4 | GSM6177623_NYU_UCEC3_Vis | Human | Endometrium | EEC | 2.46e-18 | -3.14e-01 | -0.1269 |
| 57801 | HES4 | LZE5T | Human | Esophagus | ESCC | 1.01e-08 | 6.35e-01 | 0.0514 |
| 57801 | HES4 | LZE20T | Human | Esophagus | ESCC | 1.09e-10 | 5.43e-01 | 0.0662 |
| 57801 | HES4 | LZE22T | Human | Esophagus | ESCC | 5.28e-09 | 5.45e-01 | 0.068 |
| 57801 | HES4 | LZE24T | Human | Esophagus | ESCC | 1.71e-31 | 1.14e+00 | 0.0596 |
| 57801 | HES4 | LZE21T | Human | Esophagus | ESCC | 2.04e-05 | 5.86e-01 | 0.0655 |
| 57801 | HES4 | P1T-E | Human | Esophagus | ESCC | 4.74e-16 | 1.30e+00 | 0.0875 |
| Page: 1 2 3 4 5 6 7 |
| Tissue | Expression Dynamics | Abbreviation |
| Endometrium | 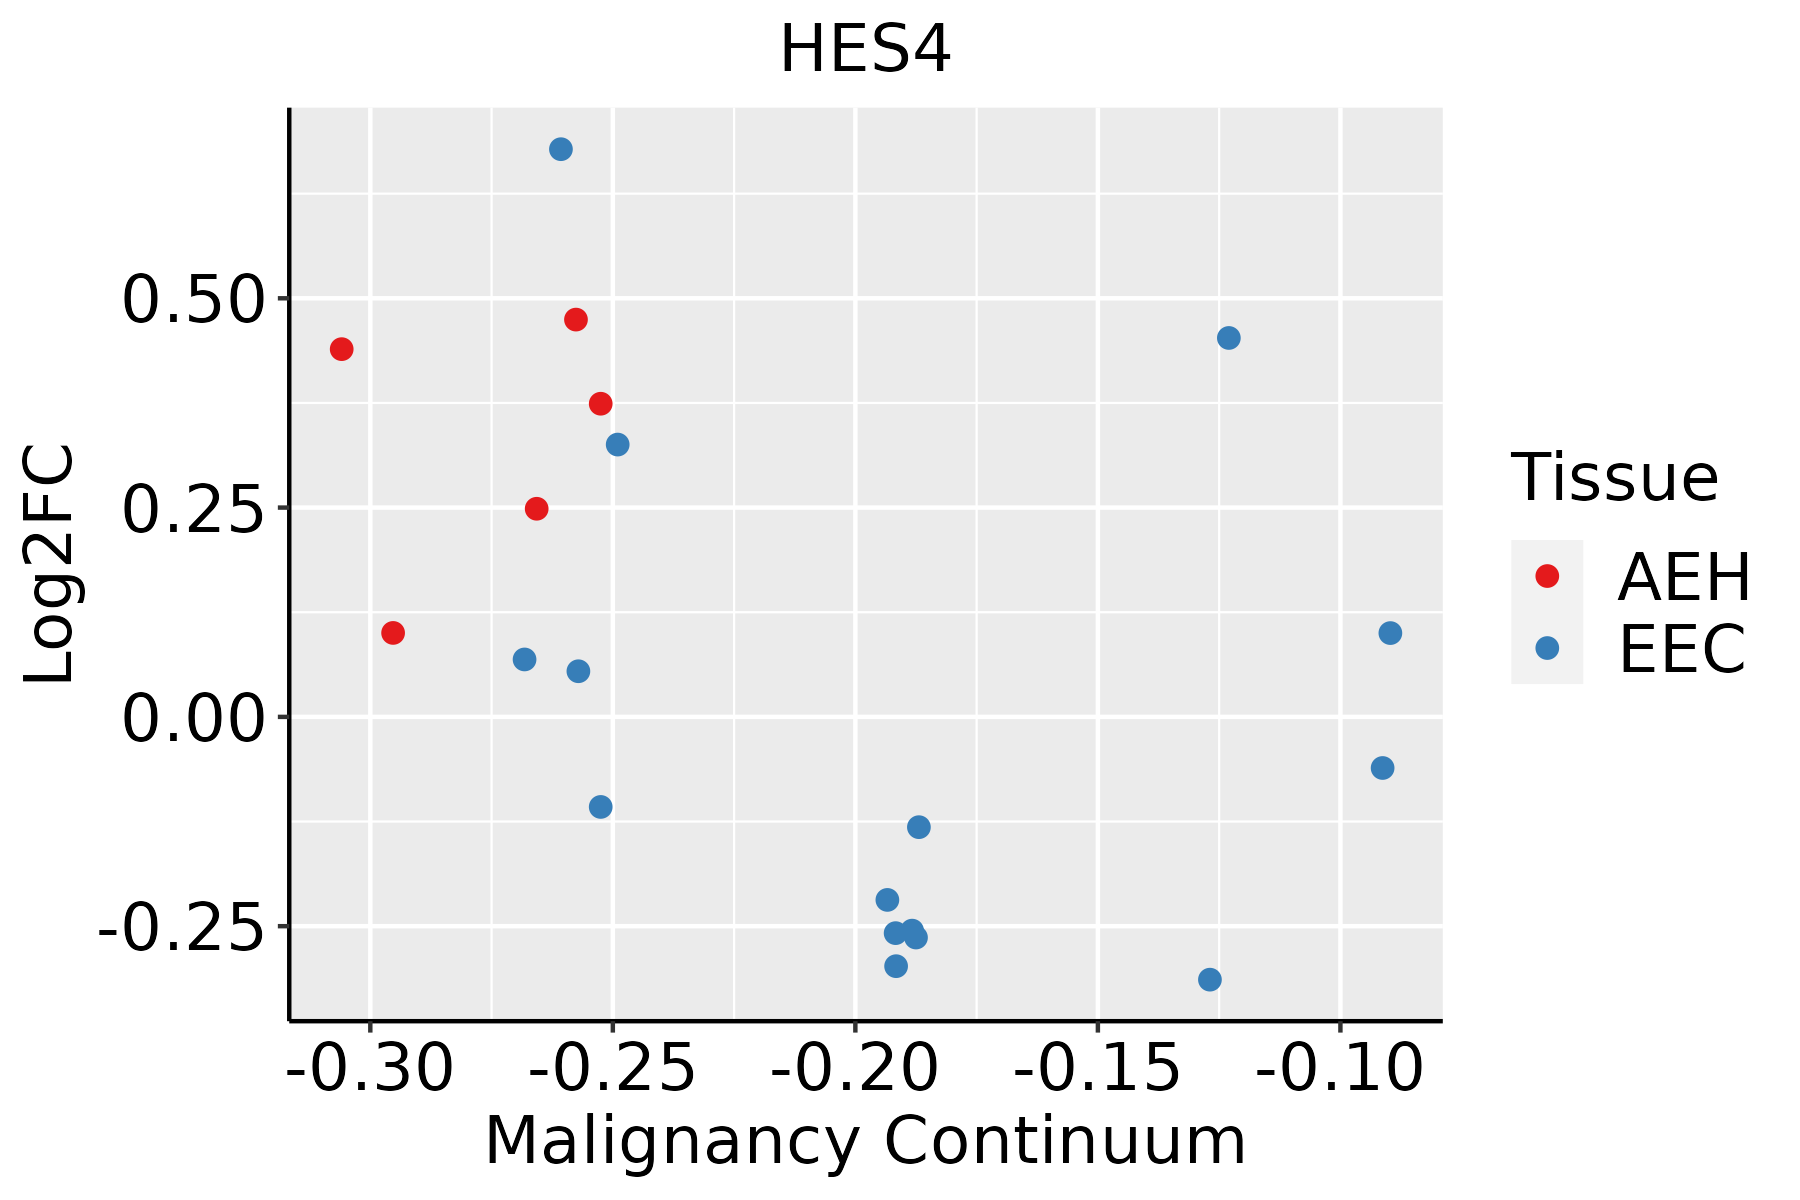 | AEH: Atypical endometrial hyperplasia |
| EEC: Endometrioid Cancer | ||
| Esophagus | 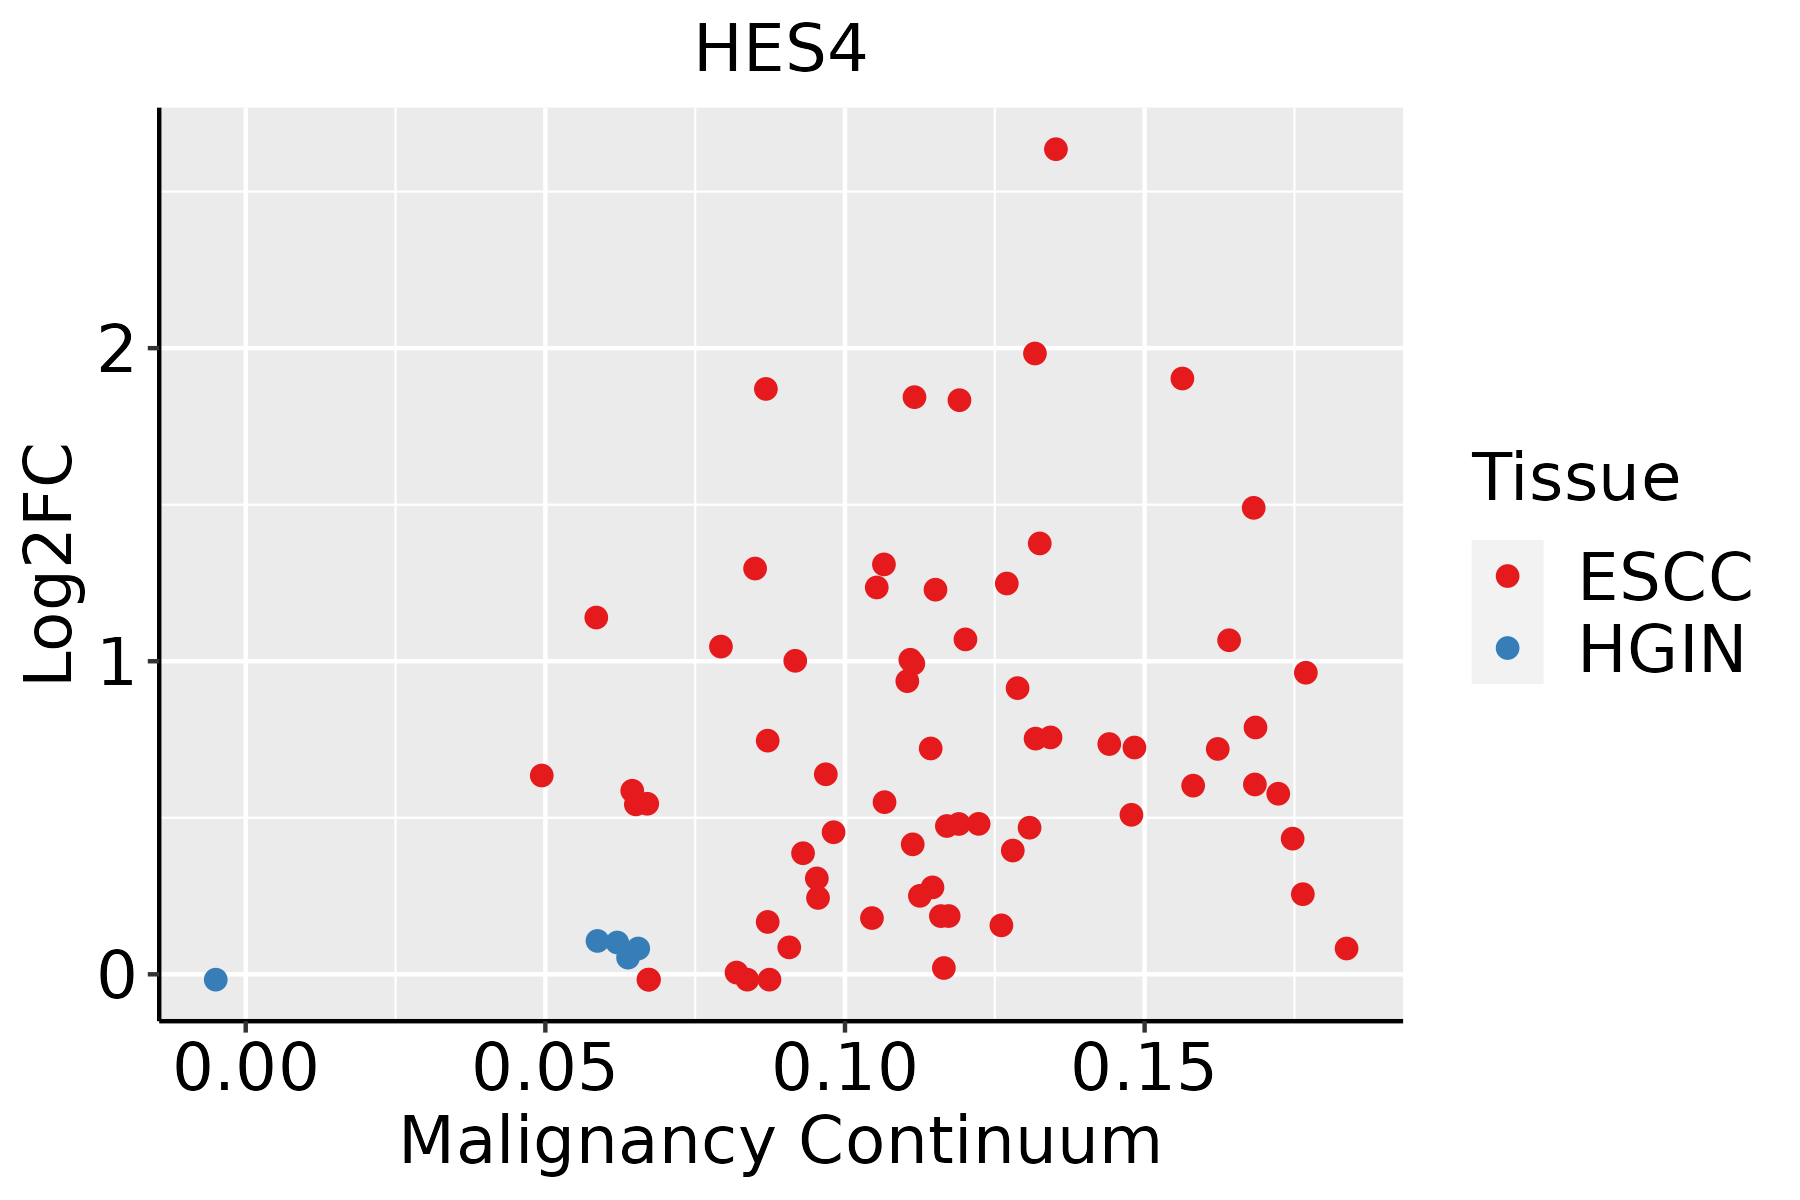 | ESCC: Esophageal squamous cell carcinoma |
| HGIN: High-grade intraepithelial neoplasias | ||
| LGIN: Low-grade intraepithelial neoplasias | ||
| Liver | 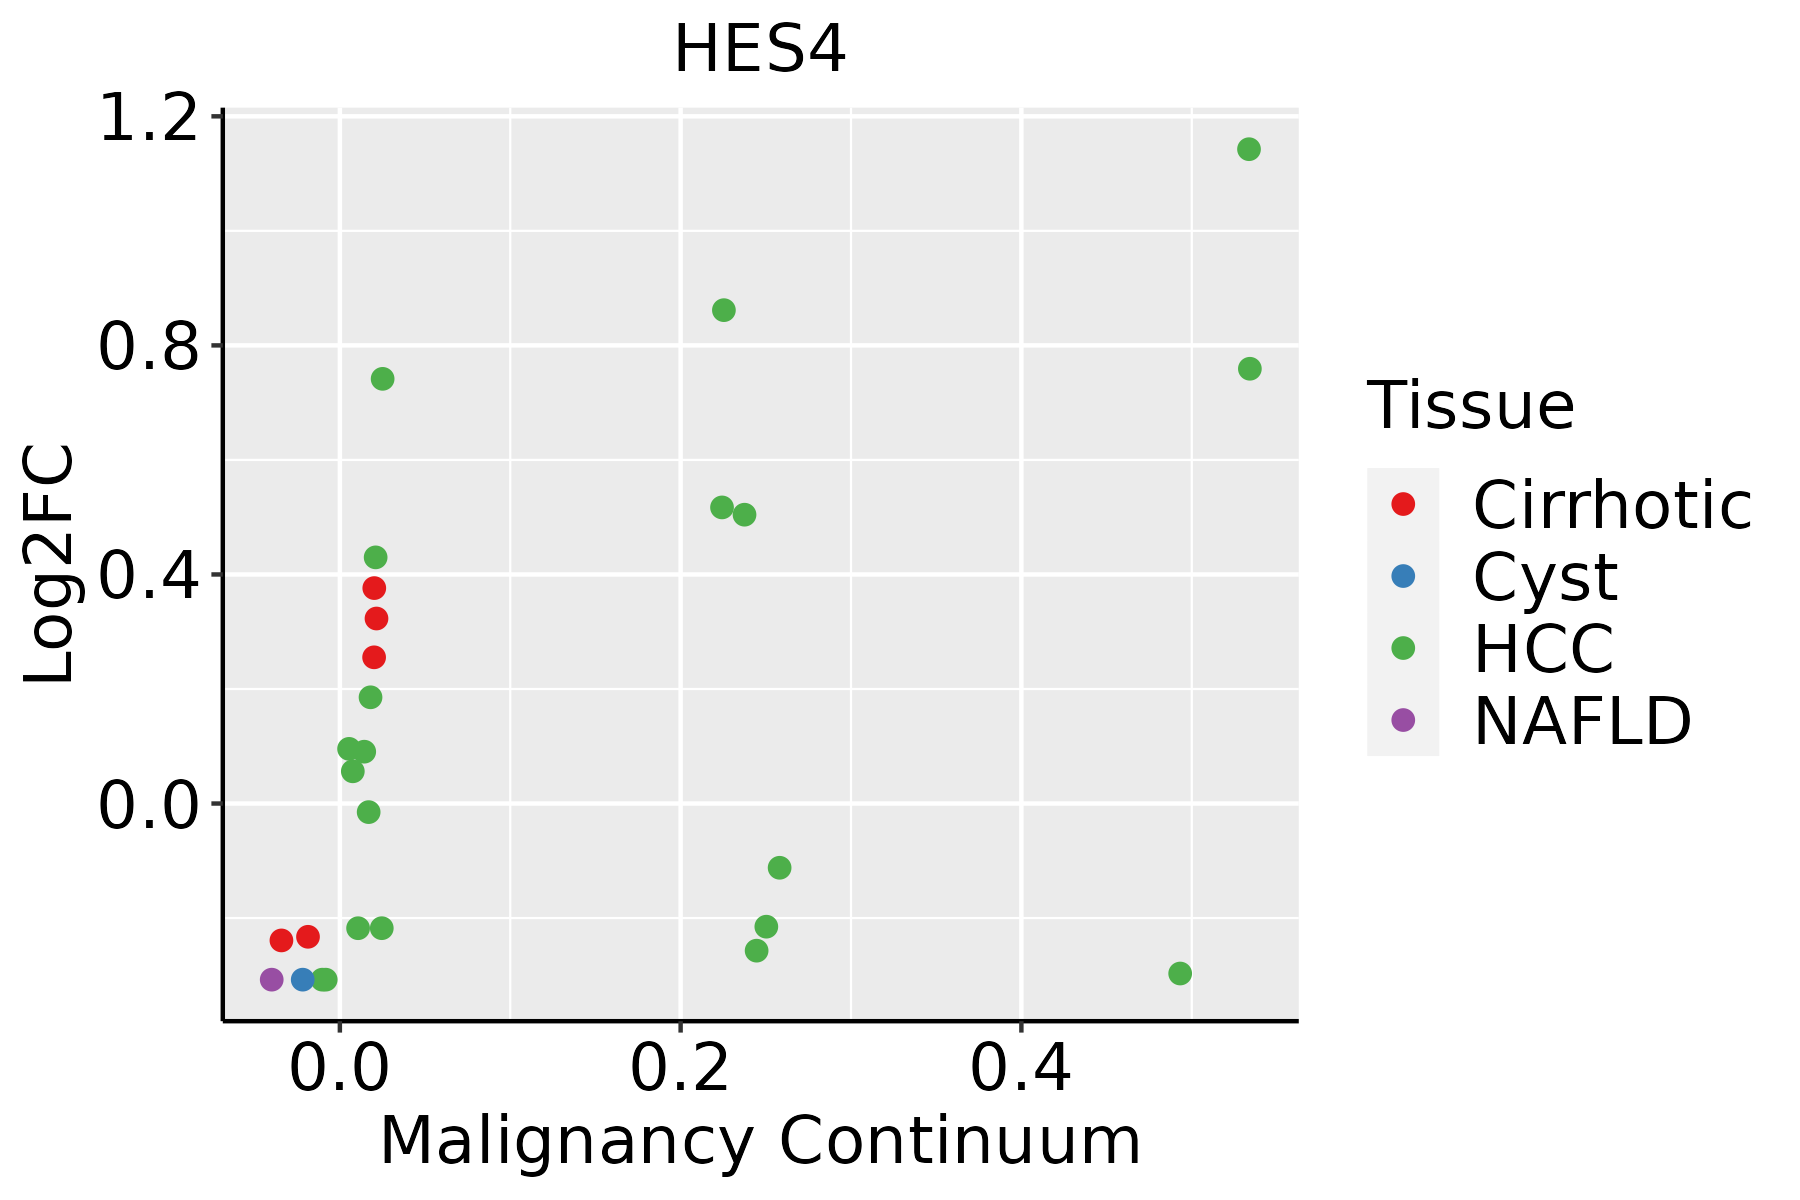 | HCC: Hepatocellular carcinoma |
| NAFLD: Non-alcoholic fatty liver disease | ||
| Oral Cavity | 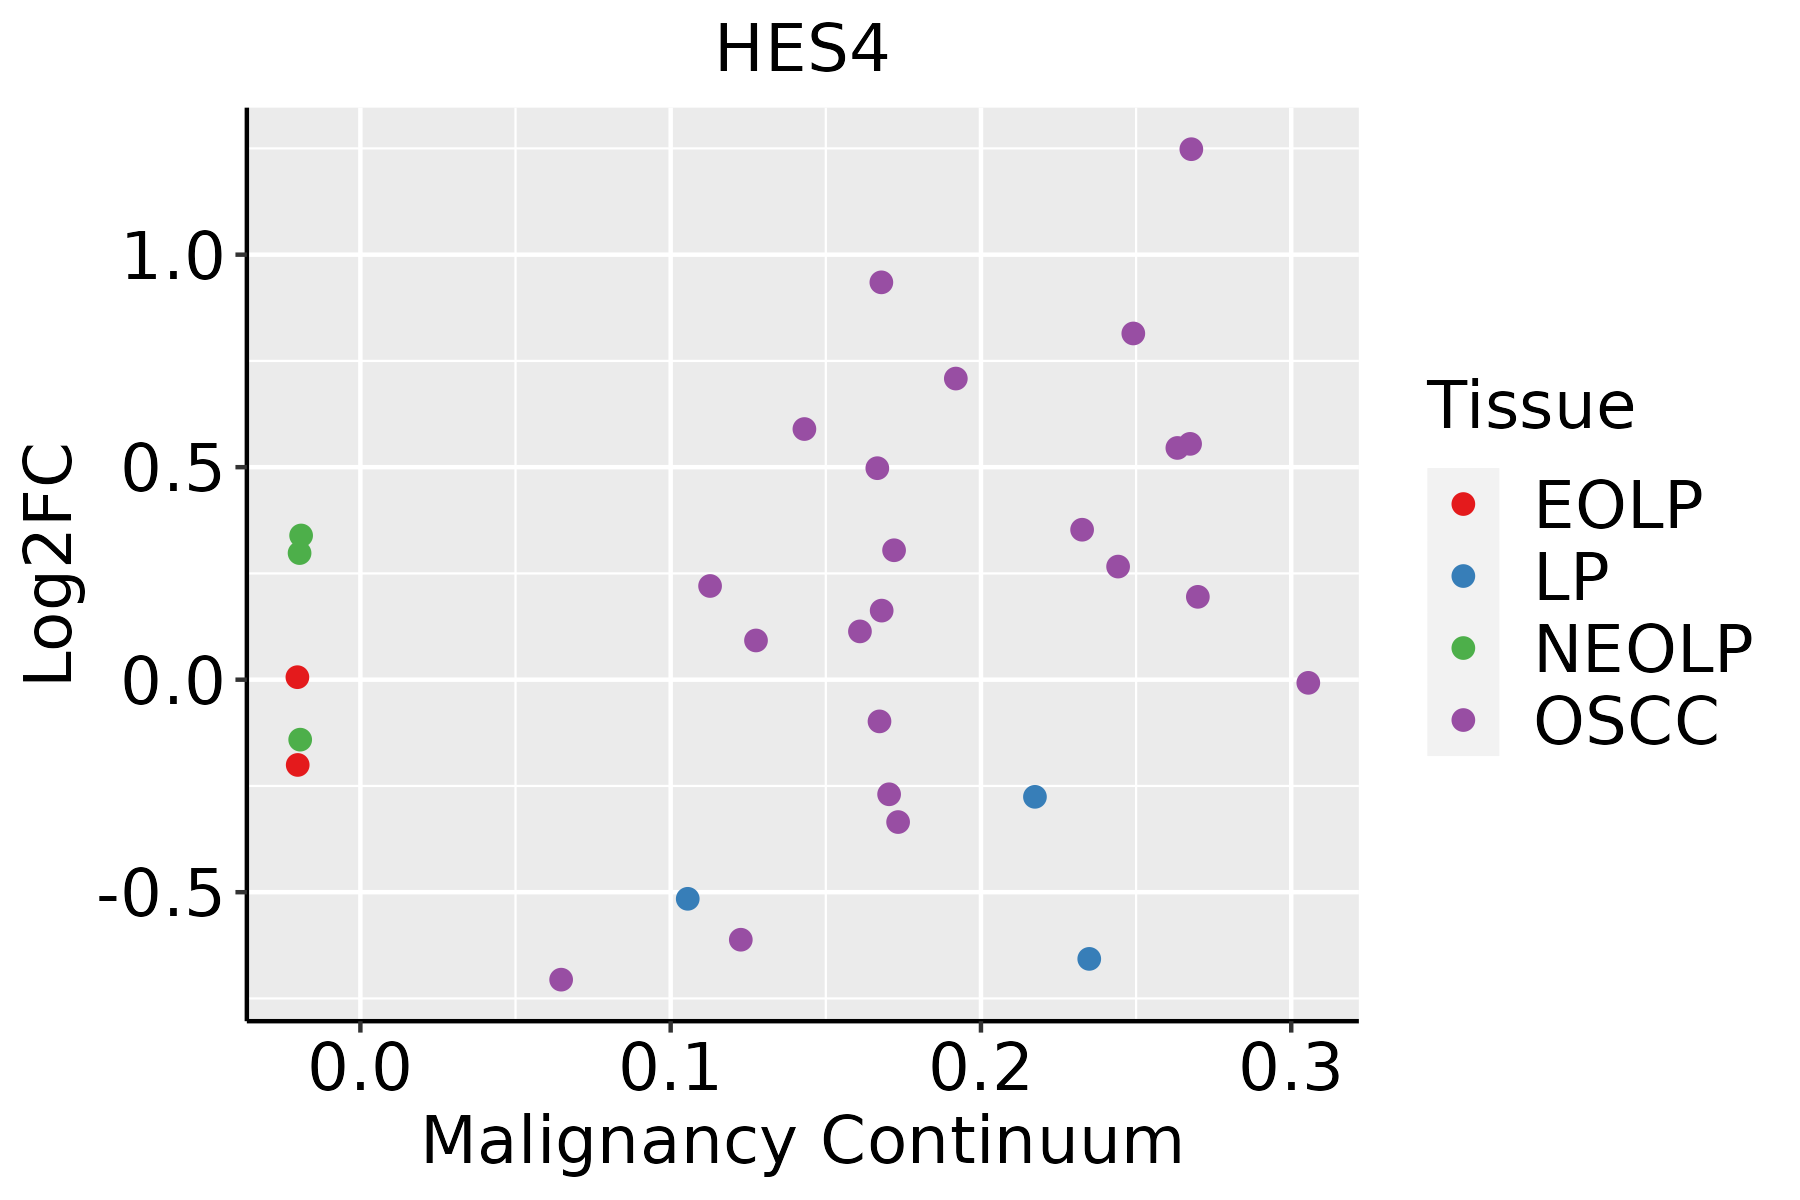 | EOLP: Erosive Oral lichen planus |
| LP: leukoplakia | ||
| NEOLP: Non-erosive oral lichen planus | ||
| OSCC: Oral squamous cell carcinoma | ||
| Prostate | 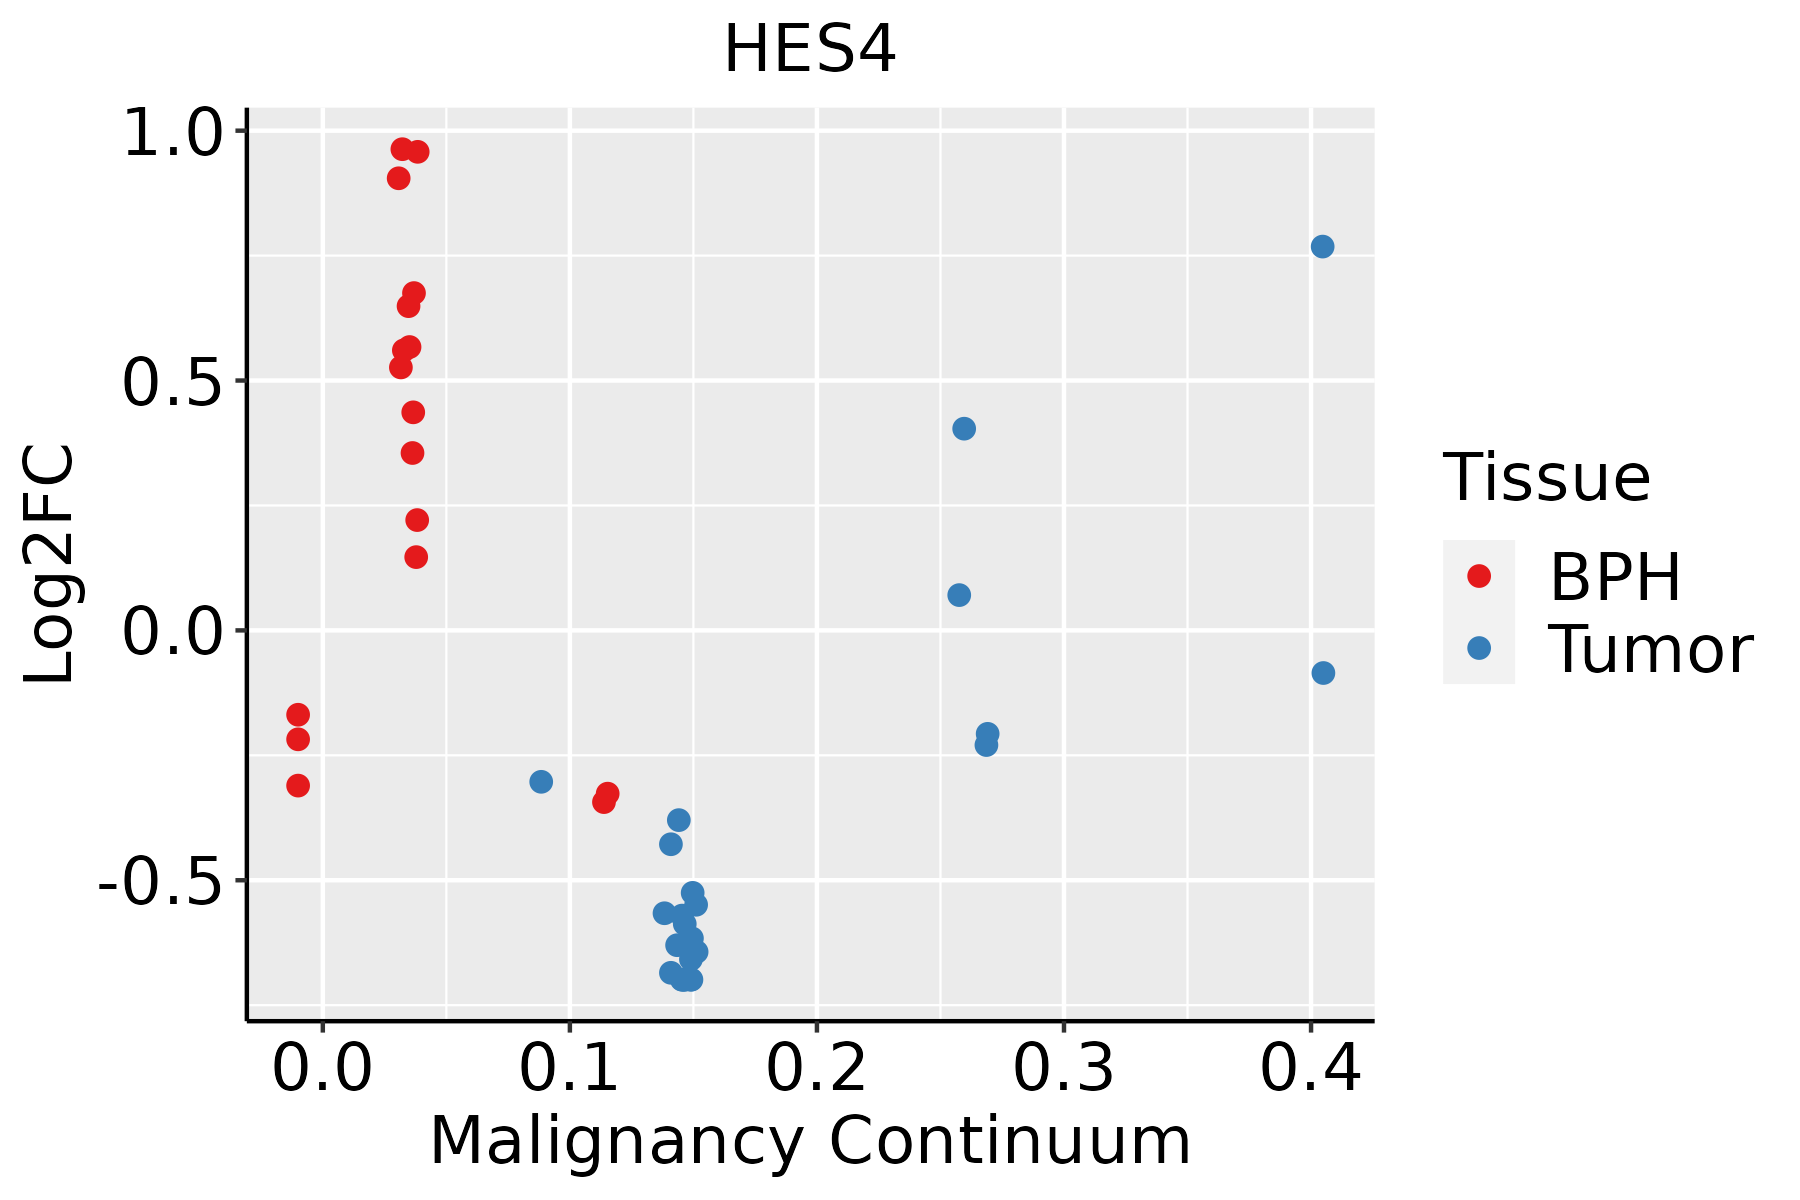 | BPH: Benign Prostatic Hyperplasia |
| Skin | 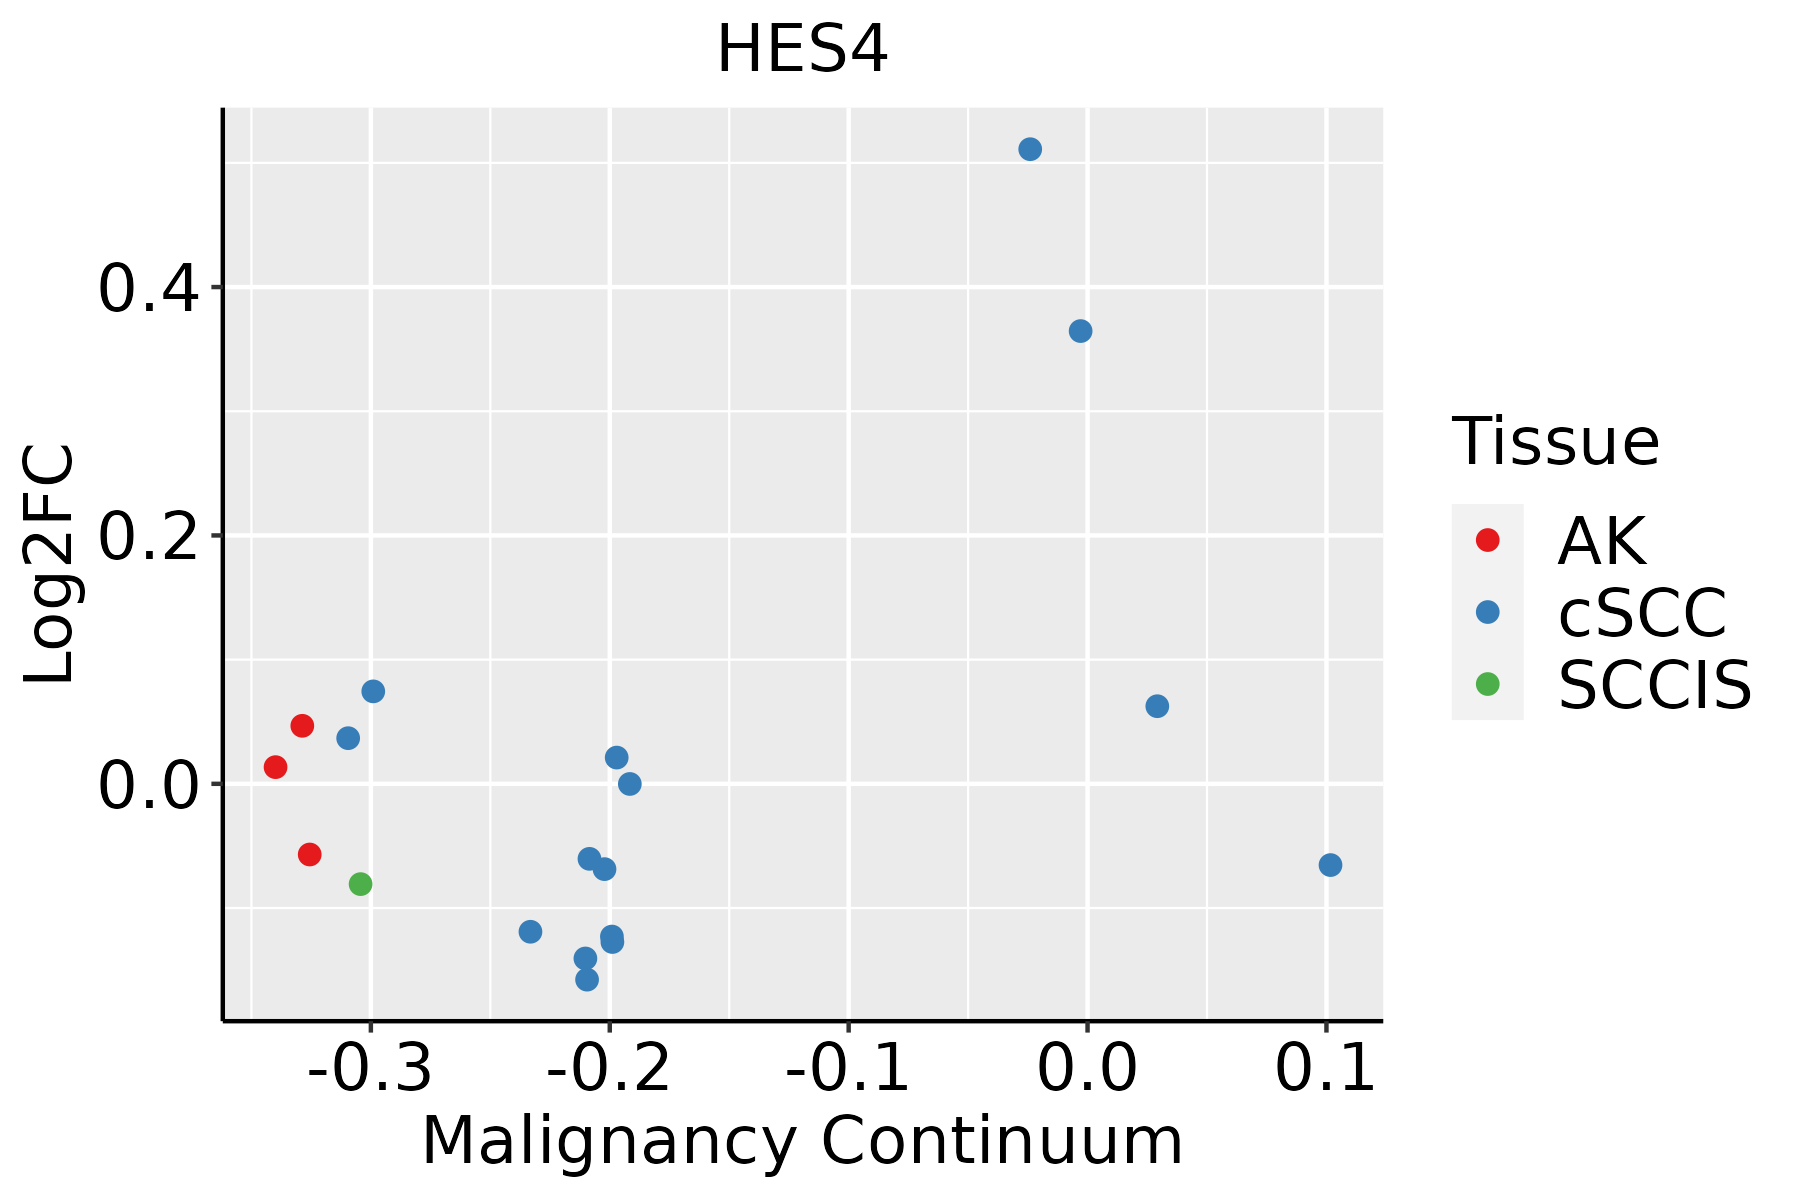 | AK: Actinic keratosis |
| cSCC: Cutaneous squamous cell carcinoma | ||
| SCCIS:squamous cell carcinoma in situ | ||
| Thyroid | 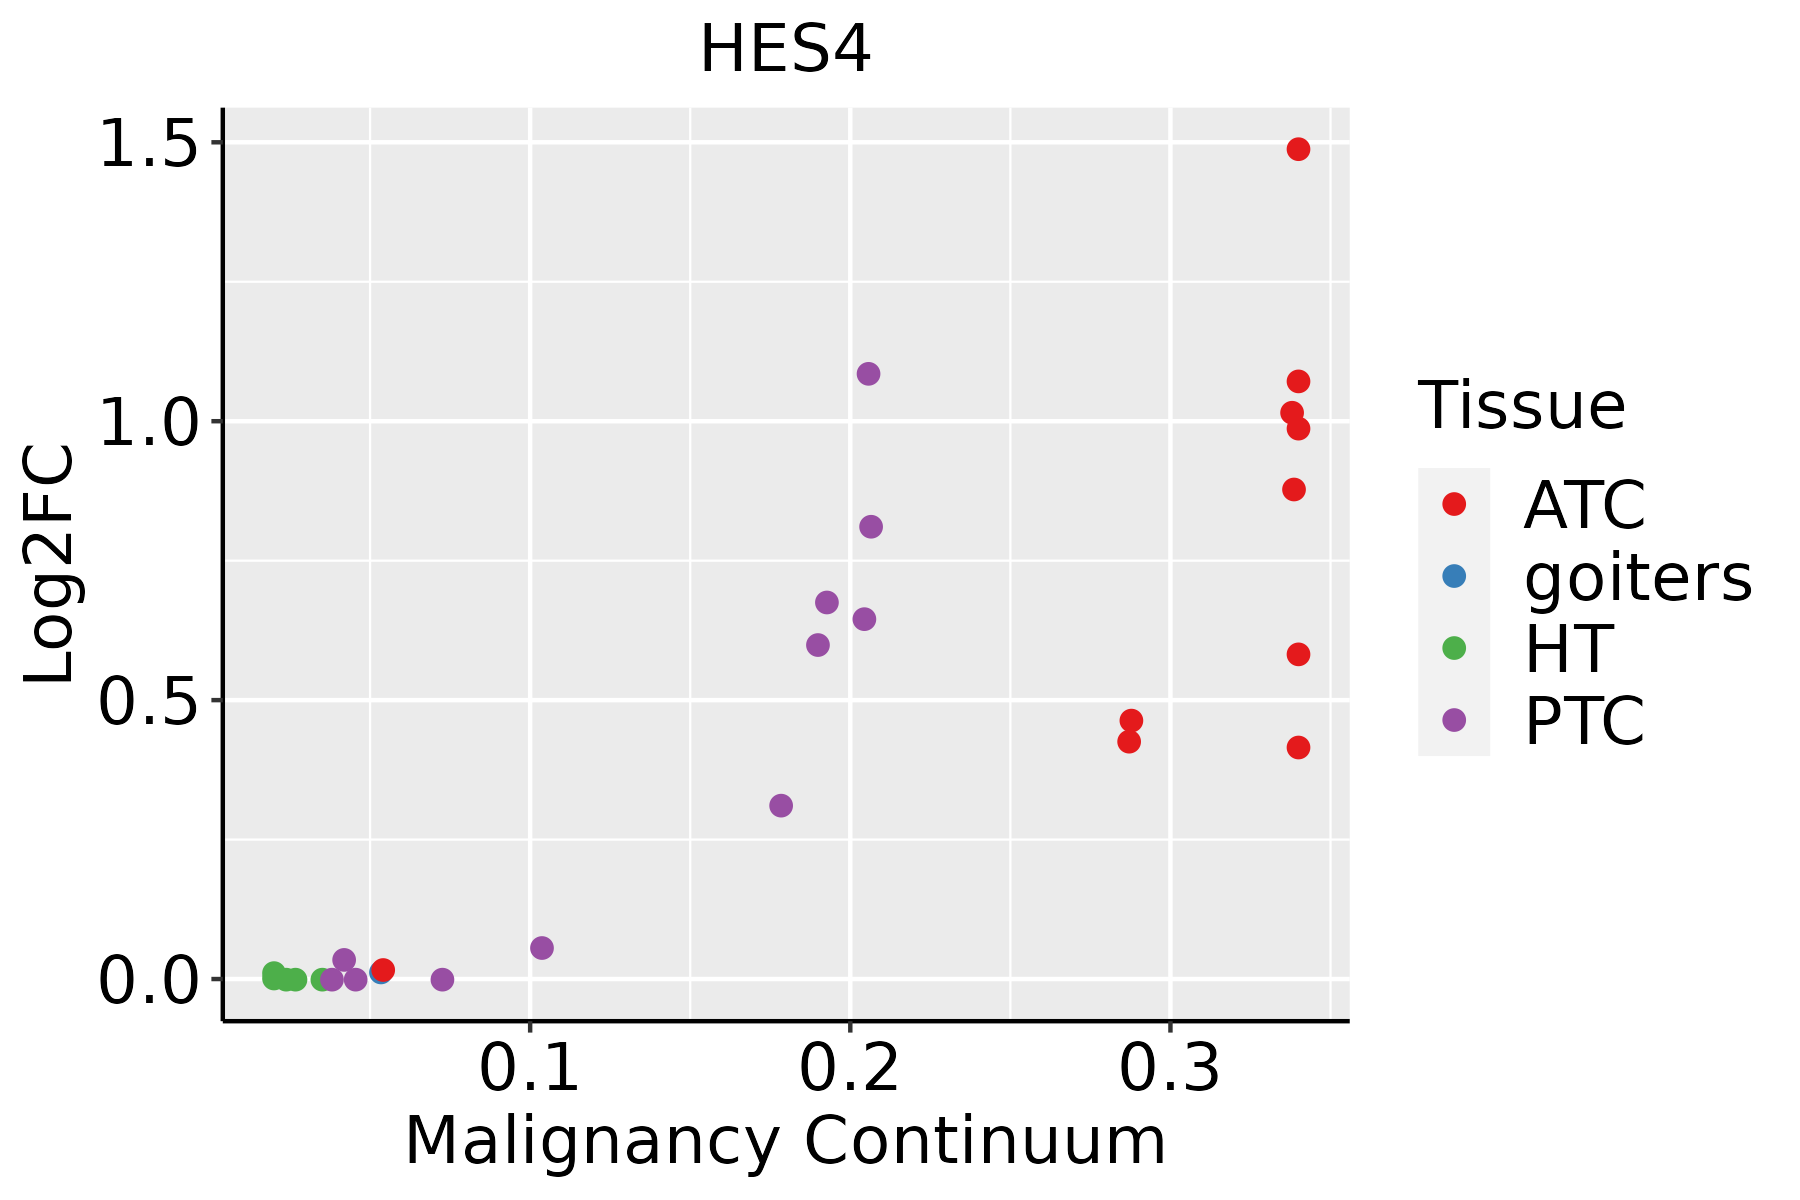 | ATC: Anaplastic thyroid cancer |
| HT: Hashimoto's thyroiditis | ||
| PTC: Papillary thyroid cancer |
| ∗log2FC in expression of this searched gene in stem-like cells from each diseased tissue sample relative to stem-like cells in normal samples in each tissue plotted against the malignancy continuum. Samples are colored based on if they are from different disease stage. |
Top |
Malignant transformation related pathway analysis |
| Find out the enriched GO biological processes and KEGG pathways involved in transition from healthy to precancer to cancer |
| Tissue | Disease Stage | Enriched GO biological Processes |
| Colorectum | AD |  |
| Colorectum | SER |  |
| Colorectum | MSS |  |
| Colorectum | MSI-H |  |
| Colorectum | FAP |  |
| ∗Top 15 enriched GO BP terms are showed in the bar plot of each disease state in each tissue. Each row represents a significant GO biological process which is colored according to the -log10(p.adjust). |
| Page: 1 2 3 4 5 6 7 8 9 |
| GO ID | Tissue | Disease Stage | Description | Gene Ratio | Bg Ratio | pvalue | p.adjust | Count |
| Page: 1 |
| Pathway ID | Tissue | Disease Stage | Description | Gene Ratio | Bg Ratio | pvalue | p.adjust | qvalue | Count |
| hsa0516510 | Esophagus | ESCC | Human papillomavirus infection | 215/4205 | 331/8465 | 7.86e-09 | 7.12e-08 | 3.65e-08 | 215 |
| hsa0516515 | Esophagus | ESCC | Human papillomavirus infection | 215/4205 | 331/8465 | 7.86e-09 | 7.12e-08 | 3.65e-08 | 215 |
| hsa05165 | Liver | Cirrhotic | Human papillomavirus infection | 124/2530 | 331/8465 | 1.55e-03 | 7.83e-03 | 4.83e-03 | 124 |
| hsa051651 | Liver | Cirrhotic | Human papillomavirus infection | 124/2530 | 331/8465 | 1.55e-03 | 7.83e-03 | 4.83e-03 | 124 |
| hsa051652 | Liver | HCC | Human papillomavirus infection | 188/4020 | 331/8465 | 3.34e-04 | 1.49e-03 | 8.29e-04 | 188 |
| hsa051653 | Liver | HCC | Human papillomavirus infection | 188/4020 | 331/8465 | 3.34e-04 | 1.49e-03 | 8.29e-04 | 188 |
| hsa051659 | Oral cavity | OSCC | Human papillomavirus infection | 200/3704 | 331/8465 | 3.83e-10 | 4.93e-09 | 2.51e-09 | 200 |
| hsa0516514 | Oral cavity | OSCC | Human papillomavirus infection | 200/3704 | 331/8465 | 3.83e-10 | 4.93e-09 | 2.51e-09 | 200 |
| hsa0516541 | Oral cavity | EOLP | Human papillomavirus infection | 79/1218 | 331/8465 | 1.96e-06 | 1.63e-05 | 9.60e-06 | 79 |
| hsa0516551 | Oral cavity | EOLP | Human papillomavirus infection | 79/1218 | 331/8465 | 1.96e-06 | 1.63e-05 | 9.60e-06 | 79 |
| hsa0516561 | Oral cavity | NEOLP | Human papillomavirus infection | 90/1112 | 331/8465 | 2.75e-12 | 1.75e-10 | 1.10e-10 | 90 |
| hsa0516571 | Oral cavity | NEOLP | Human papillomavirus infection | 90/1112 | 331/8465 | 2.75e-12 | 1.75e-10 | 1.10e-10 | 90 |
| hsa051658 | Prostate | BPH | Human papillomavirus infection | 111/1718 | 331/8465 | 6.15e-09 | 7.81e-08 | 4.83e-08 | 111 |
| hsa0516513 | Prostate | BPH | Human papillomavirus infection | 111/1718 | 331/8465 | 6.15e-09 | 7.81e-08 | 4.83e-08 | 111 |
| hsa0516522 | Prostate | Tumor | Human papillomavirus infection | 110/1791 | 331/8465 | 1.31e-07 | 1.51e-06 | 9.36e-07 | 110 |
| hsa0516532 | Prostate | Tumor | Human papillomavirus infection | 110/1791 | 331/8465 | 1.31e-07 | 1.51e-06 | 9.36e-07 | 110 |
| Page: 1 |
Top |
Cell-cell communication analysis |
| Identification of potential cell-cell interactions between two cell types and their ligand-receptor pairs for different disease states |
| Ligand | Receptor | LRpair | Pathway | Tissue | Disease Stage |
| Page: 1 |
Top |
Single-cell gene regulatory network inference analysis |
| Find out the significant the regulons (TFs) and the target genes of each regulon across cell types for different disease states |
| TF | Cell Type | Tissue | Disease Stage | Target Gene | RSS | Regulon Activity |
| HES4 | CD8TRM | Breast | ADJ | MB21D2,ARMCX2,CDYL, etc. | 3.67e-02 |  |
| HES4 | INMON | Breast | ADJ | MB21D2,ARMCX2,CDYL, etc. | 6.31e-02 | |
| HES4 | DC | Breast | DCIS | MB21D2,ARMCX2,CDYL, etc. | 1.27e-01 |  |
| HES4 | pDC | Breast | DCIS | MB21D2,ARMCX2,CDYL, etc. | 6.74e-02 | |
| HES4 | pDC | Breast | Healthy | MB21D2,ARMCX2,CDYL, etc. | 1.33e-02 |  |
| HES4 | pDC | Breast | IDC | MB21D2,ARMCX2,CDYL, etc. | 3.50e-02 |  |
| HES4 | PERI | Cervix | ADJ | NOTCH3,MCAM,ADIRF, etc. | 3.79e-01 |  |
| HES4 | MYOFIB | Cervix | CC | NOTCH3,MCAM,ADIRF, etc. | 3.65e-01 |  |
| HES4 | PERI | Cervix | CC | NOTCH3,MCAM,ADIRF, etc. | 2.03e-02 | |
| HES4 | MYOFIB | Cervix | HSIL_HPV | NOTCH3,MCAM,ADIRF, etc. | 1.86e-01 |  |
| ∗The dot plots of a searched regulon are shown for all cell subpopulations in each disease state of each tissue based on the regulon specific score inferred using pySCENIC and by calculating the average expression. |
| Page: 1 2 3 |
Top |
Somatic mutation of malignant transformation related genes |
| Annotation of somatic variants for genes involved in malignant transformation |
| Hugo Symbol | Variant Class | Variant Classification | dbSNP RS | HGVSc | HGVSp | HGVSp Short | SWISSPROT | BIOTYPE | SIFT | PolyPhen | Tumor Sample Barcode | Tissue | Histology | Sex | Age | Stage | Therapy Types | Drugs | Outcome |
| HES4 | SNV | Missense_Mutation | c.197N>G | p.Pro66Arg | p.P66R | protein_coding | deleterious(0) | probably_damaging(1) | TCGA-EX-A1H6-01 | Cervix | cervical & endocervical cancer | Female | <65 | I/II | Unknown | Unknown | SD | ||
| HES4 | SNV | Missense_Mutation | c.211C>T | p.Arg71Trp | p.R71W | protein_coding | deleterious(0) | probably_damaging(1) | TCGA-A6-5665-01 | Colorectum | colon adenocarcinoma | Female | >=65 | I/II | Unknown | Unknown | PD | ||
| HES4 | SNV | Missense_Mutation | novel | c.146G>T | p.Gly49Val | p.G49V | protein_coding | tolerated_low_confidence(0.16) | benign(0) | TCGA-EY-A1GK-01 | Endometrium | uterine corpus endometrioid carcinoma | Female | >=65 | I/II | Unknown | Unknown | SD |
| Page: 1 |
Top |
Related drugs of malignant transformation related genes |
| Identification of chemicals and drugs interact with genes involved in malignant transfromation |
| (DGIdb 4.0) |
| Entrez ID | Symbol | Category | Interaction Types | Drug Claim Name | Drug Name | PMIDs |
| Page: 1 |

Copyright 2023-Present -The University of Texas Health Science Center at Houston |