
|
|||||
|
 | |
| |
| |
| |
| |
| |
|
Gene: HES2 |
Gene summary for HES2 |
| Gene information | Species | Human | Gene symbol | HES2 | Gene ID | 54626 |
| Gene name | hes family bHLH transcription factor 2 | |
| Gene Alias | bHLHb40 | |
| Cytomap | 1p36.31 | |
| Gene Type | protein-coding | GO ID | GO:0000122 | UniProtAcc | Q9Y543 |
Top |
Malignant transformation analysis |
| Identification of the aberrant gene expression in precancerous and cancerous lesions by comparing the gene expression of stem-like cells in diseased tissues with normal stem cells |
| Entrez ID | Symbol | Replicates | Species | Organ | Tissue | Adj P-value | Log2FC | Malignancy |
| 54626 | HES2 | LZE4T | Human | Esophagus | ESCC | 2.29e-05 | 2.12e-01 | 0.0811 |
| 54626 | HES2 | LZE22T | Human | Esophagus | ESCC | 3.18e-06 | 4.90e-01 | 0.068 |
| 54626 | HES2 | P4T-E | Human | Esophagus | ESCC | 2.25e-15 | 4.59e-01 | 0.1323 |
| 54626 | HES2 | P5T-E | Human | Esophagus | ESCC | 5.56e-10 | 3.79e-01 | 0.1327 |
| 54626 | HES2 | P9T-E | Human | Esophagus | ESCC | 4.38e-06 | 2.29e-01 | 0.1131 |
| 54626 | HES2 | P12T-E | Human | Esophagus | ESCC | 3.22e-02 | 1.56e-01 | 0.1122 |
| 54626 | HES2 | P15T-E | Human | Esophagus | ESCC | 1.91e-21 | 5.43e-01 | 0.1149 |
| 54626 | HES2 | P17T-E | Human | Esophagus | ESCC | 3.28e-04 | 3.10e-01 | 0.1278 |
| 54626 | HES2 | P20T-E | Human | Esophagus | ESCC | 2.71e-04 | 1.90e-01 | 0.1124 |
| 54626 | HES2 | P21T-E | Human | Esophagus | ESCC | 5.33e-09 | 2.35e-01 | 0.1617 |
| 54626 | HES2 | P22T-E | Human | Esophagus | ESCC | 7.30e-09 | 1.69e-01 | 0.1236 |
| 54626 | HES2 | P23T-E | Human | Esophagus | ESCC | 5.20e-09 | 2.62e-01 | 0.108 |
| 54626 | HES2 | P24T-E | Human | Esophagus | ESCC | 1.03e-14 | 4.58e-01 | 0.1287 |
| 54626 | HES2 | P26T-E | Human | Esophagus | ESCC | 1.10e-04 | 8.59e-02 | 0.1276 |
| 54626 | HES2 | P27T-E | Human | Esophagus | ESCC | 8.96e-13 | 3.03e-01 | 0.1055 |
| 54626 | HES2 | P28T-E | Human | Esophagus | ESCC | 3.24e-11 | 3.29e-01 | 0.1149 |
| 54626 | HES2 | P30T-E | Human | Esophagus | ESCC | 6.35e-06 | 3.19e-01 | 0.137 |
| 54626 | HES2 | P32T-E | Human | Esophagus | ESCC | 1.04e-02 | 1.09e-01 | 0.1666 |
| 54626 | HES2 | P36T-E | Human | Esophagus | ESCC | 5.00e-02 | 1.97e-01 | 0.1187 |
| 54626 | HES2 | P37T-E | Human | Esophagus | ESCC | 2.02e-07 | 2.22e-01 | 0.1371 |
| Page: 1 2 3 4 |
| Tissue | Expression Dynamics | Abbreviation |
| Esophagus |  | ESCC: Esophageal squamous cell carcinoma |
| HGIN: High-grade intraepithelial neoplasias | ||
| LGIN: Low-grade intraepithelial neoplasias | ||
| Liver |  | HCC: Hepatocellular carcinoma |
| NAFLD: Non-alcoholic fatty liver disease | ||
| Oral Cavity | 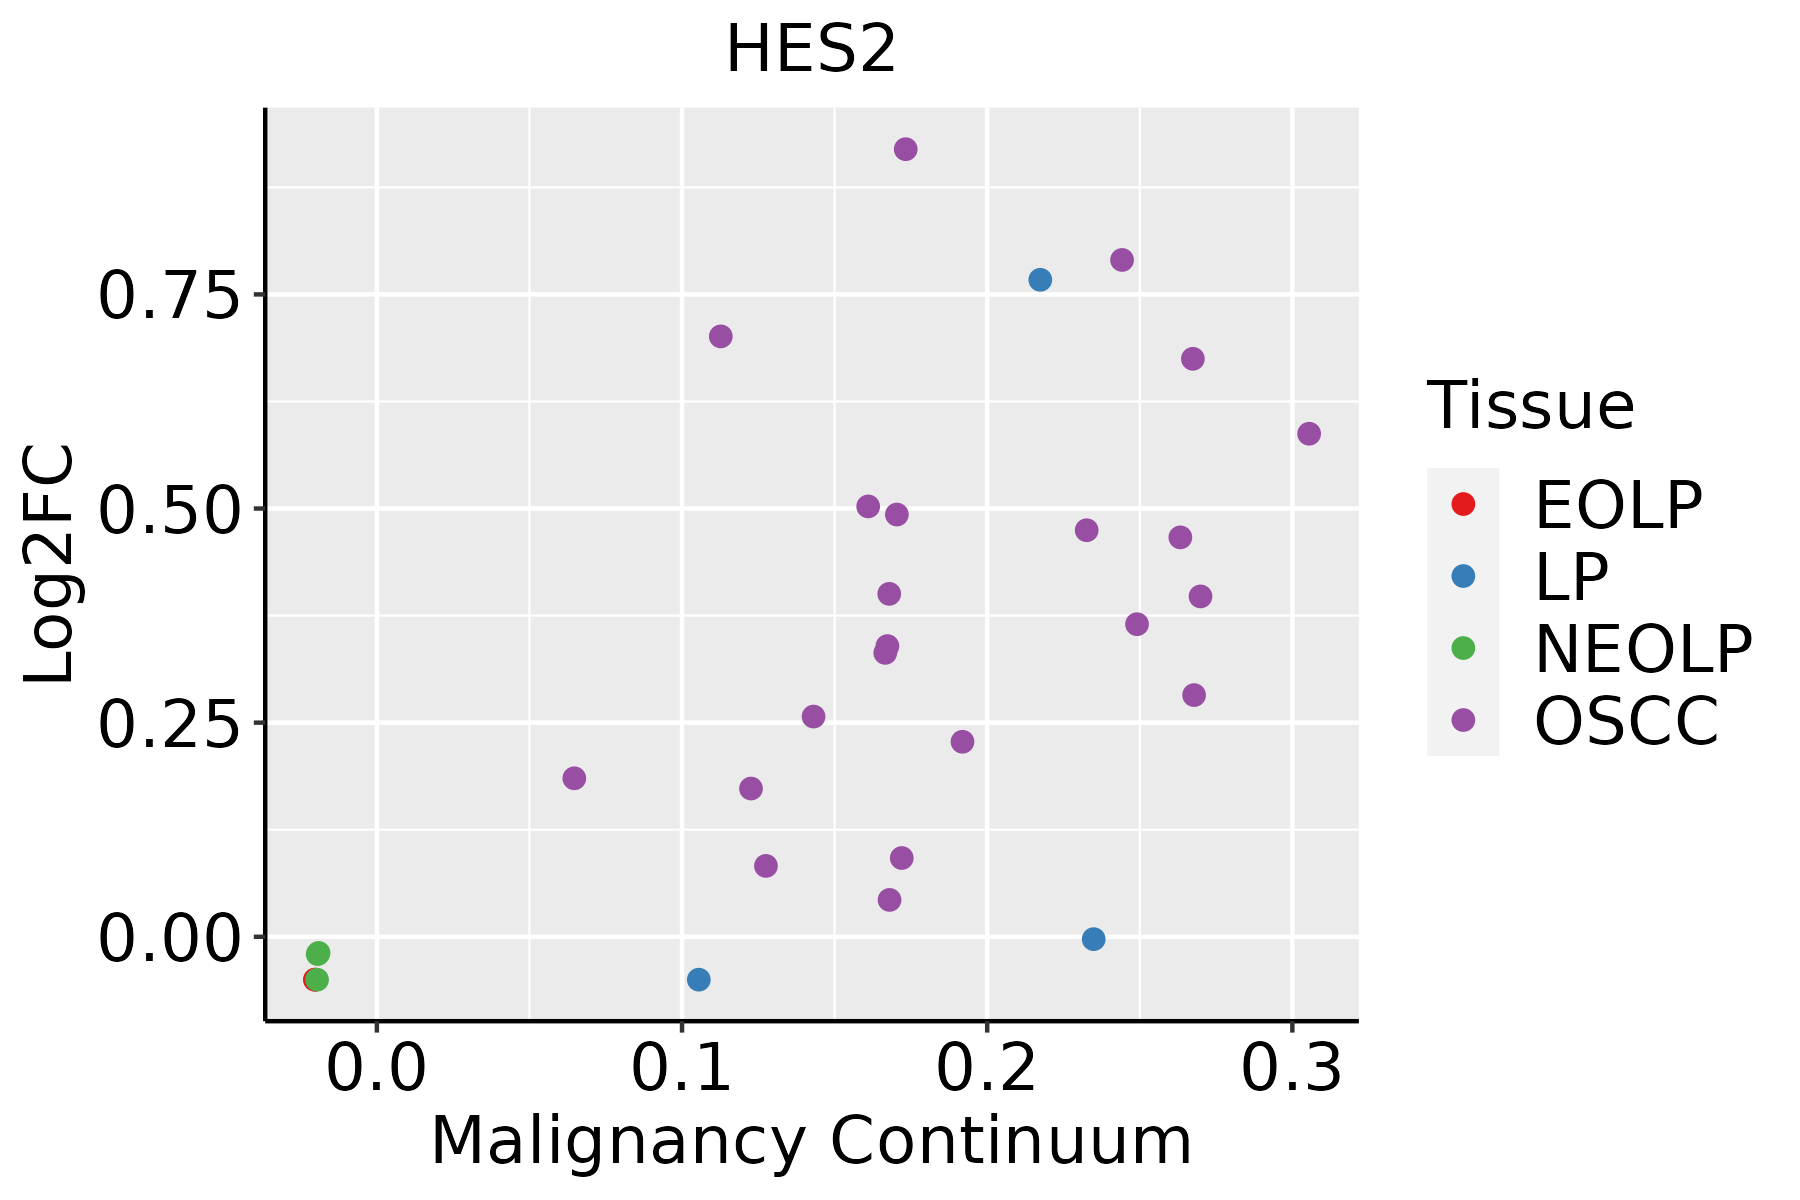 | EOLP: Erosive Oral lichen planus |
| LP: leukoplakia | ||
| NEOLP: Non-erosive oral lichen planus | ||
| OSCC: Oral squamous cell carcinoma | ||
| Skin | 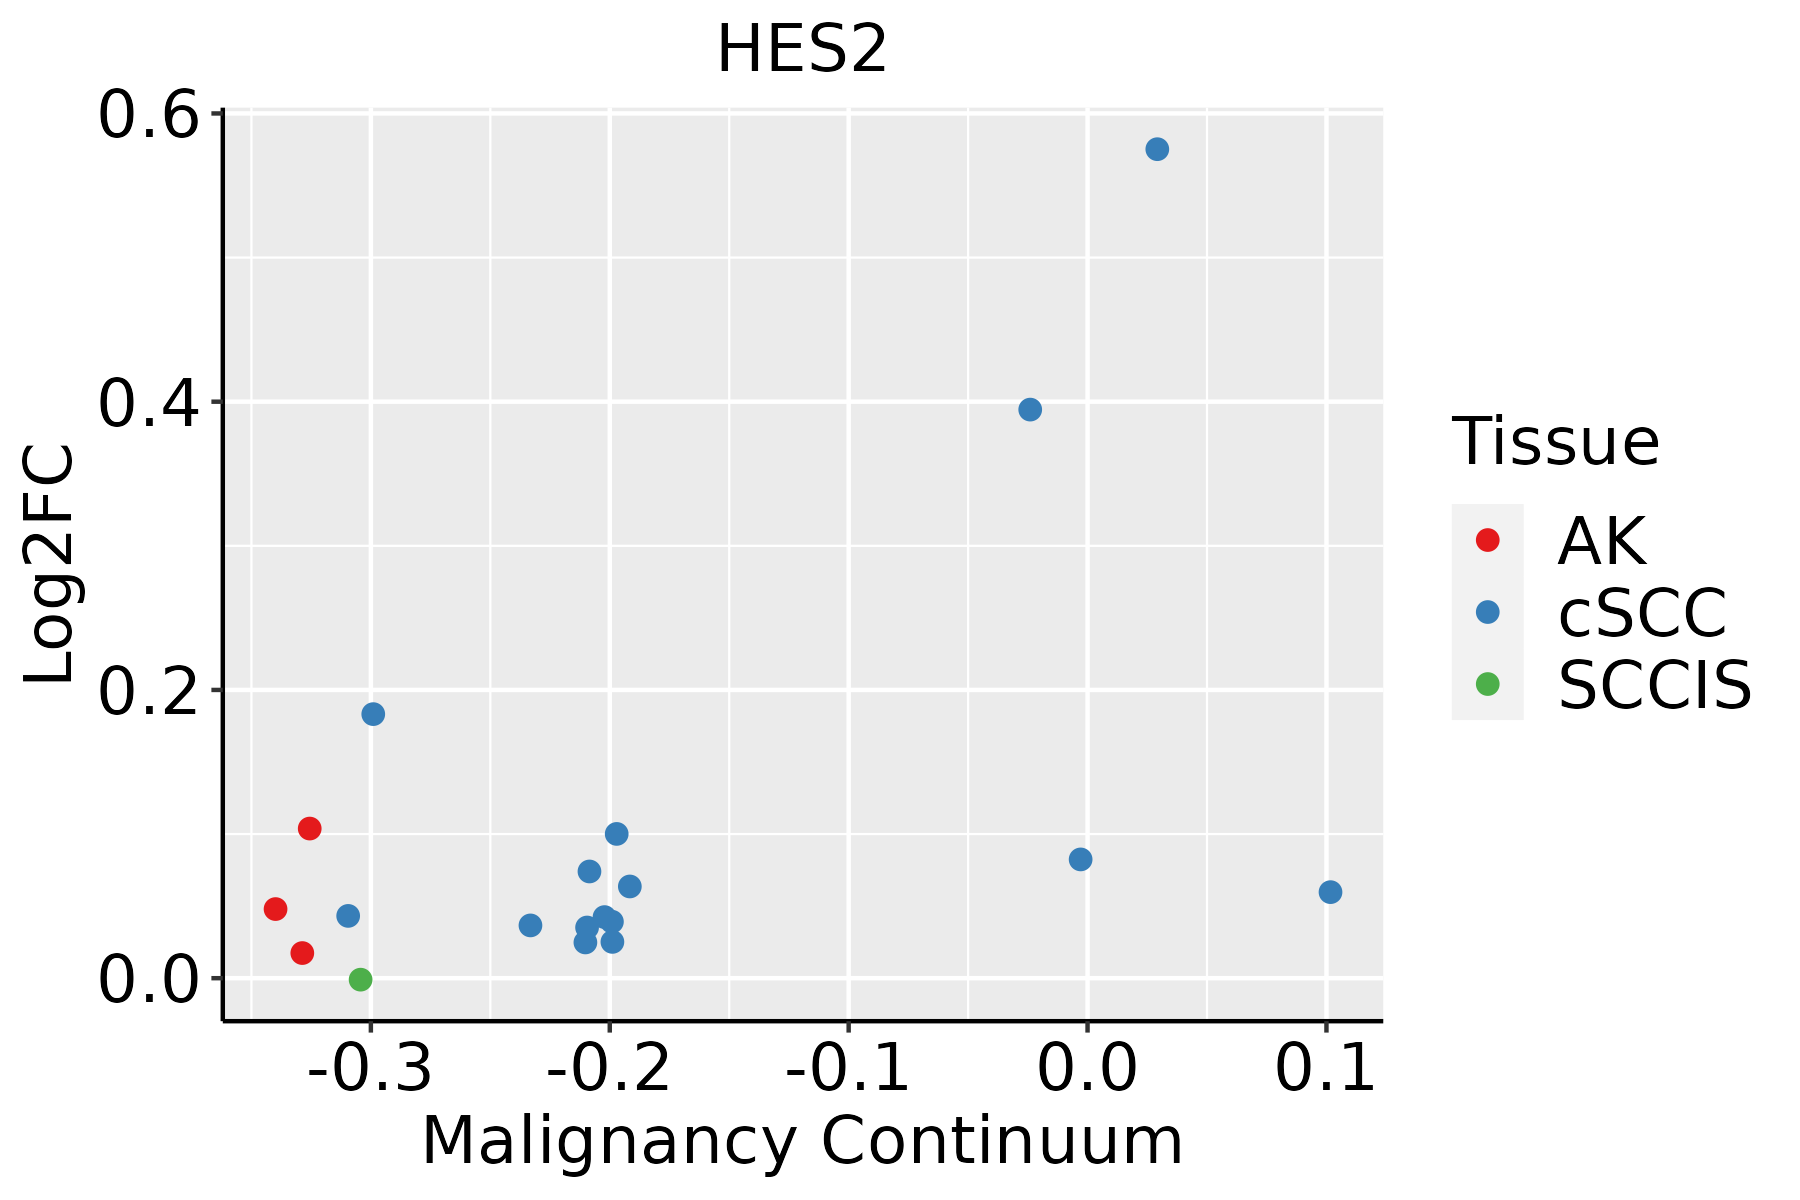 | AK: Actinic keratosis |
| cSCC: Cutaneous squamous cell carcinoma | ||
| SCCIS:squamous cell carcinoma in situ |
| ∗log2FC in expression of this searched gene in stem-like cells from each diseased tissue sample relative to stem-like cells in normal samples in each tissue plotted against the malignancy continuum. Samples are colored based on if they are from different disease stage. |
Top |
Malignant transformation related pathway analysis |
| Find out the enriched GO biological processes and KEGG pathways involved in transition from healthy to precancer to cancer |
| Tissue | Disease Stage | Enriched GO biological Processes |
| Colorectum | AD |  |
| Colorectum | SER |  |
| Colorectum | MSS |  |
| Colorectum | MSI-H |  |
| Colorectum | FAP |  |
| ∗Top 15 enriched GO BP terms are showed in the bar plot of each disease state in each tissue. Each row represents a significant GO biological process which is colored according to the -log10(p.adjust). |
| Page: 1 2 3 4 5 6 7 8 9 |
| GO ID | Tissue | Disease Stage | Description | Gene Ratio | Bg Ratio | pvalue | p.adjust | Count |
| GO:005076710 | Esophagus | ESCC | regulation of neurogenesis | 203/8552 | 364/18723 | 6.10e-05 | 4.68e-04 | 203 |
| GO:00519606 | Esophagus | ESCC | regulation of nervous system development | 237/8552 | 443/18723 | 5.02e-04 | 2.78e-03 | 237 |
| GO:00507674 | Liver | HCC | regulation of neurogenesis | 181/7958 | 364/18723 | 3.00e-03 | 1.40e-02 | 181 |
| GO:00507679 | Oral cavity | OSCC | regulation of neurogenesis | 179/7305 | 364/18723 | 4.49e-05 | 3.84e-04 | 179 |
| GO:00519605 | Oral cavity | OSCC | regulation of nervous system development | 205/7305 | 443/18723 | 9.80e-04 | 5.11e-03 | 205 |
| GO:005076722 | Skin | cSCC | regulation of neurogenesis | 118/4864 | 364/18723 | 3.32e-03 | 1.81e-02 | 118 |
| Page: 1 |
| Pathway ID | Tissue | Disease Stage | Description | Gene Ratio | Bg Ratio | pvalue | p.adjust | qvalue | Count |
| hsa0516510 | Esophagus | ESCC | Human papillomavirus infection | 215/4205 | 331/8465 | 7.86e-09 | 7.12e-08 | 3.65e-08 | 215 |
| hsa0516515 | Esophagus | ESCC | Human papillomavirus infection | 215/4205 | 331/8465 | 7.86e-09 | 7.12e-08 | 3.65e-08 | 215 |
| hsa051652 | Liver | HCC | Human papillomavirus infection | 188/4020 | 331/8465 | 3.34e-04 | 1.49e-03 | 8.29e-04 | 188 |
| hsa051653 | Liver | HCC | Human papillomavirus infection | 188/4020 | 331/8465 | 3.34e-04 | 1.49e-03 | 8.29e-04 | 188 |
| hsa051659 | Oral cavity | OSCC | Human papillomavirus infection | 200/3704 | 331/8465 | 3.83e-10 | 4.93e-09 | 2.51e-09 | 200 |
| hsa0516514 | Oral cavity | OSCC | Human papillomavirus infection | 200/3704 | 331/8465 | 3.83e-10 | 4.93e-09 | 2.51e-09 | 200 |
| hsa0516523 | Oral cavity | LP | Human papillomavirus infection | 121/2418 | 331/8465 | 8.00e-04 | 3.86e-03 | 2.49e-03 | 121 |
| hsa0516533 | Oral cavity | LP | Human papillomavirus infection | 121/2418 | 331/8465 | 8.00e-04 | 3.86e-03 | 2.49e-03 | 121 |
| Page: 1 |
Top |
Cell-cell communication analysis |
| Identification of potential cell-cell interactions between two cell types and their ligand-receptor pairs for different disease states |
| Ligand | Receptor | LRpair | Pathway | Tissue | Disease Stage |
| Page: 1 |
Top |
Single-cell gene regulatory network inference analysis |
| Find out the significant the regulons (TFs) and the target genes of each regulon across cell types for different disease states |
| TF | Cell Type | Tissue | Disease Stage | Target Gene | RSS | Regulon Activity |
| HES2 | CD8TEFF | Cervix | ADJ | FXYD3,SERPINB3,KRT19, etc. | 2.43e-02 |  |
| HES2 | M2MAC | Cervix | HSIL_HPV | FXYD3,SERPINB3,KRT19, etc. | 1.14e-01 |  |
| HES2 | PRO | Esophagus | Healthy | TGM1,RHOV,DYNLT3, etc. | 1.44e-01 |  |
| HES2 | TRANS | Esophagus | Healthy | TGM1,RHOV,DYNLT3, etc. | 1.82e-01 | |
| HES2 | ICAF | Lung | Healthy | OTOA,CES1,FDX1, etc. | 3.46e-01 |  |
| HES2 | MVA | Lung | Healthy | OTOA,CES1,FDX1, etc. | 1.04e-01 | |
| HES2 | SPI | Oral cavity | OSCC | RHOV,THBD,HES4, etc. | 4.41e-01 |  |
| ∗The dot plots of a searched regulon are shown for all cell subpopulations in each disease state of each tissue based on the regulon specific score inferred using pySCENIC and by calculating the average expression. |
| Page: 1 |
Top |
Somatic mutation of malignant transformation related genes |
| Annotation of somatic variants for genes involved in malignant transformation |
| Hugo Symbol | Variant Class | Variant Classification | dbSNP RS | HGVSc | HGVSp | HGVSp Short | SWISSPROT | BIOTYPE | SIFT | PolyPhen | Tumor Sample Barcode | Tissue | Histology | Sex | Age | Stage | Therapy Types | Drugs | Outcome |
| HES2 | SNV | Missense_Mutation | novel | c.194N>A | p.Arg65His | p.R65H | Q9Y543 | protein_coding | tolerated(0.08) | benign(0.111) | TCGA-AX-A0J0-01 | Endometrium | uterine corpus endometrioid carcinoma | Female | <65 | I/II | Unknown | Unknown | SD |
| HES2 | SNV | Missense_Mutation | c.163N>A | p.Glu55Lys | p.E55K | Q9Y543 | protein_coding | deleterious(0) | probably_damaging(0.997) | TCGA-55-A48Y-01 | Lung | lung adenocarcinoma | Male | >=65 | I/II | Chemotherapy | carboplatin | CR |
| Page: 1 |
Top |
Related drugs of malignant transformation related genes |
| Identification of chemicals and drugs interact with genes involved in malignant transfromation |
| (DGIdb 4.0) |
| Entrez ID | Symbol | Category | Interaction Types | Drug Claim Name | Drug Name | PMIDs |
| Page: 1 |

Copyright 2023-Present -The University of Texas Health Science Center at Houston |