
|
|||||
|
 | |
| |
| |
| |
| |
| |
|
Gene: HERPUD2 |
Gene summary for HERPUD2 |
| Gene information | Species | Human | Gene symbol | HERPUD2 | Gene ID | 64224 |
| Gene name | HERPUD family member 2 | |
| Gene Alias | HERPUD2 | |
| Cytomap | 7p14.2 | |
| Gene Type | protein-coding | GO ID | GO:0000003 | UniProtAcc | A0A024RA77 |
Top |
Malignant transformation analysis |
| Identification of the aberrant gene expression in precancerous and cancerous lesions by comparing the gene expression of stem-like cells in diseased tissues with normal stem cells |
| Entrez ID | Symbol | Replicates | Species | Organ | Tissue | Adj P-value | Log2FC | Malignancy |
| 64224 | HERPUD2 | LZE4T | Human | Esophagus | ESCC | 1.71e-10 | 3.29e-01 | 0.0811 |
| 64224 | HERPUD2 | LZE20T | Human | Esophagus | ESCC | 1.86e-11 | 3.14e-01 | 0.0662 |
| 64224 | HERPUD2 | LZE22T | Human | Esophagus | ESCC | 4.20e-12 | 4.29e-01 | 0.068 |
| 64224 | HERPUD2 | LZE24T | Human | Esophagus | ESCC | 7.91e-22 | 6.47e-01 | 0.0596 |
| 64224 | HERPUD2 | P1T-E | Human | Esophagus | ESCC | 9.55e-12 | 5.84e-01 | 0.0875 |
| 64224 | HERPUD2 | P2T-E | Human | Esophagus | ESCC | 2.12e-28 | 5.52e-01 | 0.1177 |
| 64224 | HERPUD2 | P4T-E | Human | Esophagus | ESCC | 3.73e-11 | 3.24e-01 | 0.1323 |
| 64224 | HERPUD2 | P5T-E | Human | Esophagus | ESCC | 2.49e-10 | 1.54e-01 | 0.1327 |
| 64224 | HERPUD2 | P8T-E | Human | Esophagus | ESCC | 4.72e-22 | 3.89e-01 | 0.0889 |
| 64224 | HERPUD2 | P9T-E | Human | Esophagus | ESCC | 2.72e-17 | 4.66e-01 | 0.1131 |
| 64224 | HERPUD2 | P10T-E | Human | Esophagus | ESCC | 7.38e-18 | 3.60e-01 | 0.116 |
| 64224 | HERPUD2 | P11T-E | Human | Esophagus | ESCC | 5.22e-22 | 7.98e-01 | 0.1426 |
| 64224 | HERPUD2 | P12T-E | Human | Esophagus | ESCC | 1.85e-29 | 6.52e-01 | 0.1122 |
| 64224 | HERPUD2 | P15T-E | Human | Esophagus | ESCC | 4.05e-25 | 5.14e-01 | 0.1149 |
| 64224 | HERPUD2 | P16T-E | Human | Esophagus | ESCC | 5.14e-22 | 4.06e-01 | 0.1153 |
| 64224 | HERPUD2 | P17T-E | Human | Esophagus | ESCC | 1.33e-06 | 4.10e-01 | 0.1278 |
| 64224 | HERPUD2 | P19T-E | Human | Esophagus | ESCC | 3.45e-04 | 4.05e-01 | 0.1662 |
| 64224 | HERPUD2 | P20T-E | Human | Esophagus | ESCC | 6.51e-26 | 4.66e-01 | 0.1124 |
| 64224 | HERPUD2 | P21T-E | Human | Esophagus | ESCC | 1.56e-20 | 3.64e-01 | 0.1617 |
| 64224 | HERPUD2 | P22T-E | Human | Esophagus | ESCC | 6.86e-22 | 3.72e-01 | 0.1236 |
| Page: 1 2 3 4 5 |
| Tissue | Expression Dynamics | Abbreviation |
| Esophagus | 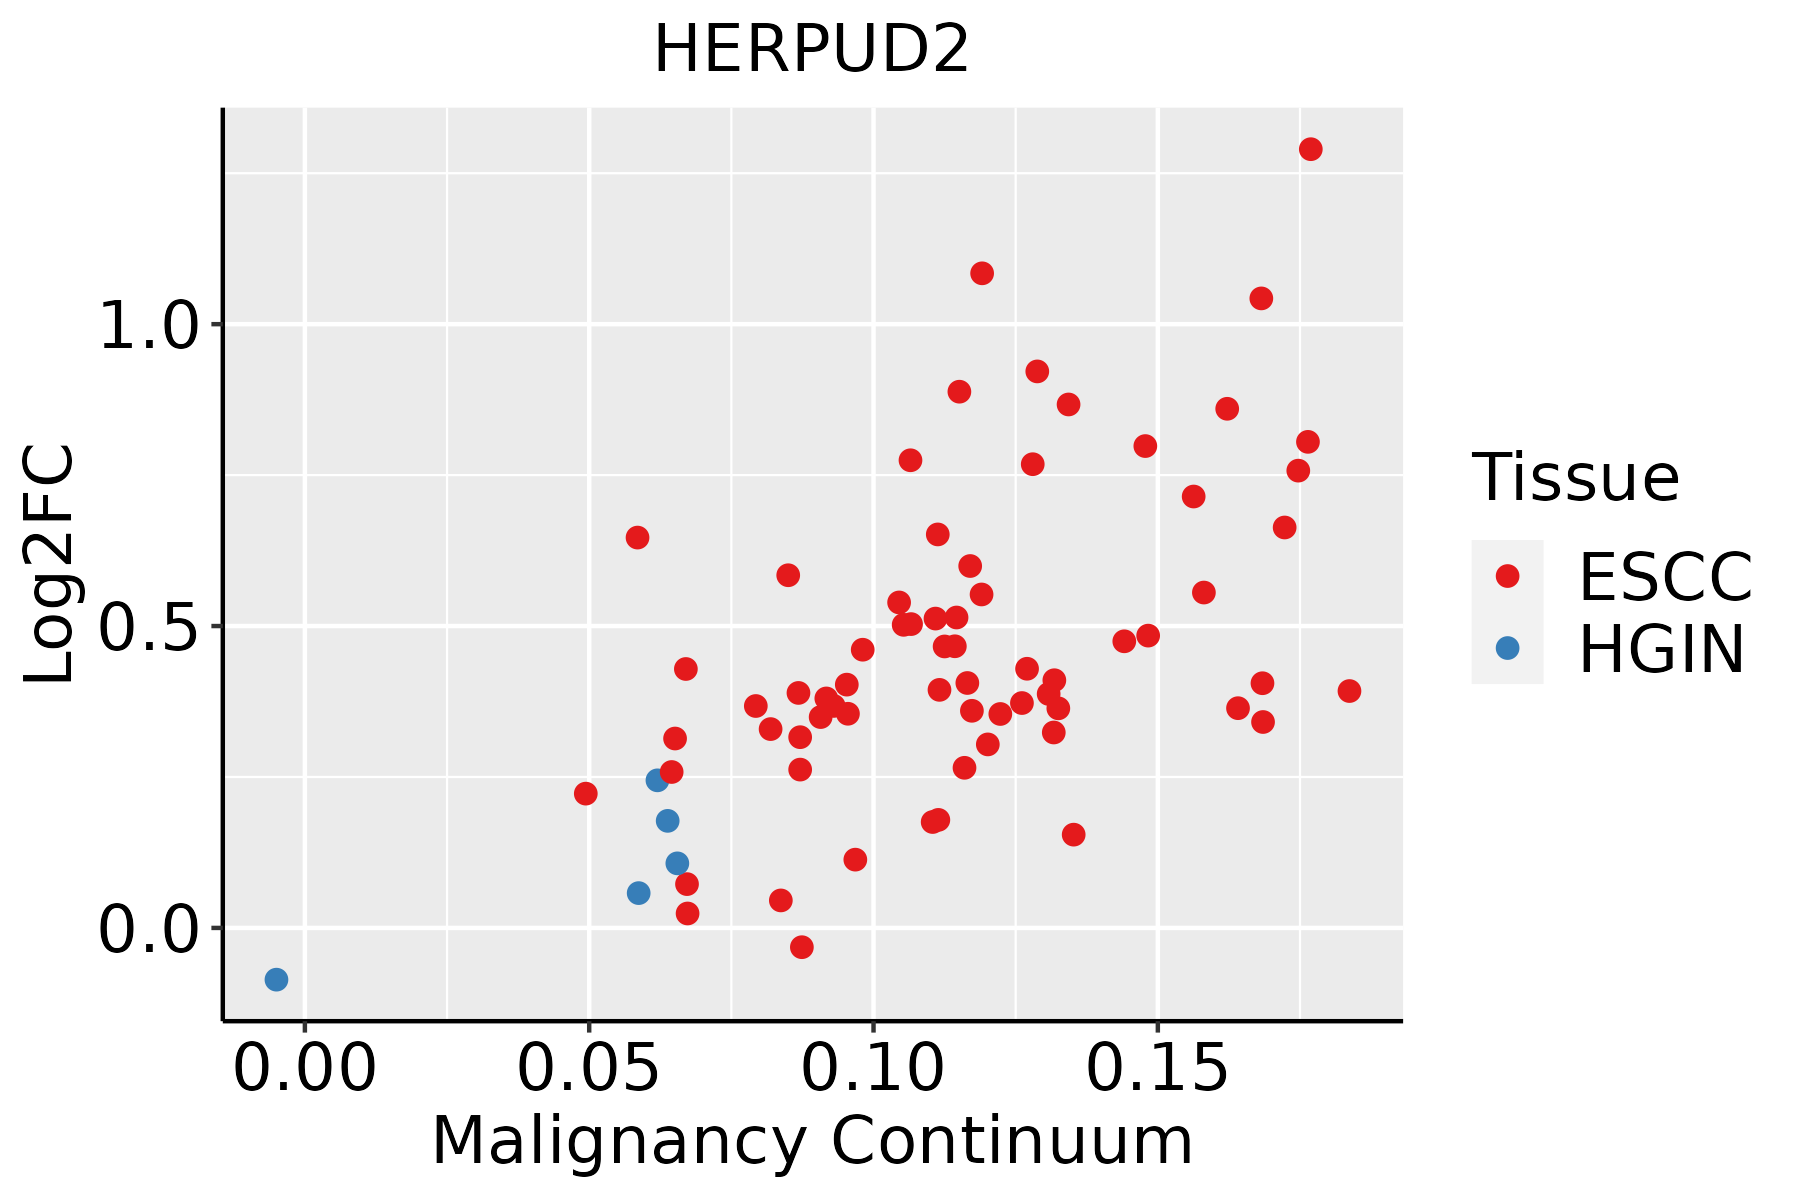 | ESCC: Esophageal squamous cell carcinoma |
| HGIN: High-grade intraepithelial neoplasias | ||
| LGIN: Low-grade intraepithelial neoplasias | ||
| Liver |  | HCC: Hepatocellular carcinoma |
| NAFLD: Non-alcoholic fatty liver disease | ||
| Oral Cavity |  | EOLP: Erosive Oral lichen planus |
| LP: leukoplakia | ||
| NEOLP: Non-erosive oral lichen planus | ||
| OSCC: Oral squamous cell carcinoma | ||
| Thyroid |  | ATC: Anaplastic thyroid cancer |
| HT: Hashimoto's thyroiditis | ||
| PTC: Papillary thyroid cancer |
| ∗log2FC in expression of this searched gene in stem-like cells from each diseased tissue sample relative to stem-like cells in normal samples in each tissue plotted against the malignancy continuum. Samples are colored based on if they are from different disease stage. |
Top |
Malignant transformation related pathway analysis |
| Find out the enriched GO biological processes and KEGG pathways involved in transition from healthy to precancer to cancer |
| Tissue | Disease Stage | Enriched GO biological Processes |
| Colorectum | AD |  |
| Colorectum | SER |  |
| Colorectum | MSS |  |
| Colorectum | MSI-H |  |
| Colorectum | FAP |  |
| ∗Top 15 enriched GO BP terms are showed in the bar plot of each disease state in each tissue. Each row represents a significant GO biological process which is colored according to the -log10(p.adjust). |
| Page: 1 2 3 4 5 6 7 8 9 |
| GO ID | Tissue | Disease Stage | Description | Gene Ratio | Bg Ratio | pvalue | p.adjust | Count |
| GO:0034976111 | Esophagus | ESCC | response to endoplasmic reticulum stress | 192/8552 | 256/18723 | 7.15e-22 | 1.30e-19 | 192 |
| GO:0035966111 | Esophagus | ESCC | response to topologically incorrect protein | 125/8552 | 159/18723 | 1.44e-17 | 1.27e-15 | 125 |
| GO:0006986111 | Esophagus | ESCC | response to unfolded protein | 107/8552 | 137/18723 | 7.01e-15 | 3.87e-13 | 107 |
| GO:0035967111 | Esophagus | ESCC | cellular response to topologically incorrect protein | 90/8552 | 116/18723 | 1.94e-12 | 8.11e-11 | 90 |
| GO:0034620111 | Esophagus | ESCC | cellular response to unfolded protein | 74/8552 | 96/18723 | 3.10e-10 | 8.66e-09 | 74 |
| GO:003096818 | Esophagus | ESCC | endoplasmic reticulum unfolded protein response | 59/8552 | 74/18723 | 1.90e-09 | 4.36e-08 | 59 |
| GO:003497612 | Liver | HCC | response to endoplasmic reticulum stress | 189/7958 | 256/18723 | 1.43e-24 | 4.06e-22 | 189 |
| GO:003596612 | Liver | HCC | response to topologically incorrect protein | 123/7958 | 159/18723 | 2.60e-19 | 3.44e-17 | 123 |
| GO:000698612 | Liver | HCC | response to unfolded protein | 103/7958 | 137/18723 | 6.50e-15 | 4.48e-13 | 103 |
| GO:003596712 | Liver | HCC | cellular response to topologically incorrect protein | 89/7958 | 116/18723 | 5.61e-14 | 3.39e-12 | 89 |
| GO:003462012 | Liver | HCC | cellular response to unfolded protein | 71/7958 | 96/18723 | 3.70e-10 | 1.22e-08 | 71 |
| GO:003096811 | Liver | HCC | endoplasmic reticulum unfolded protein response | 56/7958 | 74/18723 | 6.47e-09 | 1.67e-07 | 56 |
| GO:003497620 | Oral cavity | OSCC | response to endoplasmic reticulum stress | 178/7305 | 256/18723 | 2.59e-23 | 6.06e-21 | 178 |
| GO:003596620 | Oral cavity | OSCC | response to topologically incorrect protein | 117/7305 | 159/18723 | 6.93e-19 | 8.60e-17 | 117 |
| GO:000698620 | Oral cavity | OSCC | response to unfolded protein | 103/7305 | 137/18723 | 6.47e-18 | 6.50e-16 | 103 |
| GO:003596720 | Oral cavity | OSCC | cellular response to topologically incorrect protein | 83/7305 | 116/18723 | 1.09e-12 | 4.84e-11 | 83 |
| GO:003462019 | Oral cavity | OSCC | cellular response to unfolded protein | 71/7305 | 96/18723 | 3.45e-12 | 1.35e-10 | 71 |
| GO:003096815 | Oral cavity | OSCC | endoplasmic reticulum unfolded protein response | 55/7305 | 74/18723 | 6.91e-10 | 1.75e-08 | 55 |
| GO:0034976113 | Thyroid | PTC | response to endoplasmic reticulum stress | 161/5968 | 256/18723 | 1.14e-24 | 3.27e-22 | 161 |
| GO:0035966113 | Thyroid | PTC | response to topologically incorrect protein | 101/5968 | 159/18723 | 2.00e-16 | 1.66e-14 | 101 |
| Page: 1 2 |
| Pathway ID | Tissue | Disease Stage | Description | Gene Ratio | Bg Ratio | pvalue | p.adjust | qvalue | Count |
| Page: 1 |
Top |
Cell-cell communication analysis |
| Identification of potential cell-cell interactions between two cell types and their ligand-receptor pairs for different disease states |
| Ligand | Receptor | LRpair | Pathway | Tissue | Disease Stage |
| Page: 1 |
Top |
Single-cell gene regulatory network inference analysis |
| Find out the significant the regulons (TFs) and the target genes of each regulon across cell types for different disease states |
| TF | Cell Type | Tissue | Disease Stage | Target Gene | RSS | Regulon Activity |
| ∗The dot plots of a searched regulon are shown for all cell subpopulations in each disease state of each tissue based on the regulon specific score inferred using pySCENIC and by calculating the average expression. |
| Page: 1 |
Top |
Somatic mutation of malignant transformation related genes |
| Annotation of somatic variants for genes involved in malignant transformation |
| Hugo Symbol | Variant Class | Variant Classification | dbSNP RS | HGVSc | HGVSp | HGVSp Short | SWISSPROT | BIOTYPE | SIFT | PolyPhen | Tumor Sample Barcode | Tissue | Histology | Sex | Age | Stage | Therapy Types | Drugs | Outcome |
| HERPUD2 | SNV | Missense_Mutation | rs771583826 | c.152N>T | p.Thr51Met | p.T51M | Q9BSE4 | protein_coding | deleterious(0.03) | probably_damaging(0.945) | TCGA-C8-A278-01 | Breast | breast invasive carcinoma | Female | <65 | III/IV | Hormone Therapy | tamoxiphen | SD |
| HERPUD2 | insertion | Nonsense_Mutation | novel | c.129_130insTGAAAATACAAAAATTAGCTGGGCGTG | p.Asn43_Val44insTer | p.N43_V44ins* | Q9BSE4 | protein_coding | TCGA-A8-A08H-01 | Breast | breast invasive carcinoma | Female | >=65 | I/II | Unknown | Unknown | SD | ||
| HERPUD2 | SNV | Missense_Mutation | novel | c.759N>A | p.Met253Ile | p.M253I | Q9BSE4 | protein_coding | tolerated(0.29) | benign(0) | TCGA-C5-A8XK-01 | Cervix | cervical & endocervical cancer | Female | <65 | I/II | Chemotherapy | cisplatin | SD |
| HERPUD2 | SNV | Missense_Mutation | c.865N>T | p.Leu289Phe | p.L289F | Q9BSE4 | protein_coding | tolerated(0.28) | probably_damaging(0.944) | TCGA-EK-A3GK-01 | Cervix | cervical & endocervical cancer | Female | <65 | I/II | Unknown | Unknown | SD | |
| HERPUD2 | SNV | Missense_Mutation | c.143N>C | p.Lys48Thr | p.K48T | Q9BSE4 | protein_coding | deleterious(0) | possibly_damaging(0.836) | TCGA-AA-A010-01 | Colorectum | colon adenocarcinoma | Female | <65 | I/II | Chemotherapy | folinic | CR | |
| HERPUD2 | SNV | Missense_Mutation | c.902N>A | p.Arg301Gln | p.R301Q | Q9BSE4 | protein_coding | deleterious(0) | probably_damaging(0.998) | TCGA-D5-6530-01 | Colorectum | colon adenocarcinoma | Male | <65 | I/II | Unknown | Unknown | SD | |
| HERPUD2 | SNV | Missense_Mutation | c.821G>A | p.Arg274Gln | p.R274Q | Q9BSE4 | protein_coding | deleterious(0) | probably_damaging(0.998) | TCGA-AG-A011-01 | Colorectum | rectum adenocarcinoma | Male | >=65 | I/II | Unknown | Unknown | SD | |
| HERPUD2 | SNV | Missense_Mutation | c.266G>A | p.Arg89Gln | p.R89Q | Q9BSE4 | protein_coding | tolerated(0.08) | benign(0.045) | TCGA-A5-A0G1-01 | Endometrium | uterine corpus endometrioid carcinoma | Female | >=65 | I/II | Unknown | Unknown | SD | |
| HERPUD2 | SNV | Missense_Mutation | novel | c.1081C>T | p.Leu361Phe | p.L361F | Q9BSE4 | protein_coding | tolerated(0.16) | benign(0.1) | TCGA-A5-A0G2-01 | Endometrium | uterine corpus endometrioid carcinoma | Female | <65 | III/IV | Unknown | Unknown | SD |
| HERPUD2 | SNV | Missense_Mutation | novel | c.460G>A | p.Ala154Thr | p.A154T | Q9BSE4 | protein_coding | tolerated(0.54) | benign(0.024) | TCGA-A5-A0G2-01 | Endometrium | uterine corpus endometrioid carcinoma | Female | <65 | III/IV | Unknown | Unknown | SD |
| Page: 1 2 3 4 5 |
Top |
Related drugs of malignant transformation related genes |
| Identification of chemicals and drugs interact with genes involved in malignant transfromation |
| (DGIdb 4.0) |
| Entrez ID | Symbol | Category | Interaction Types | Drug Claim Name | Drug Name | PMIDs |
| Page: 1 |

Copyright 2023-Present -The University of Texas Health Science Center at Houston |