
|
|||||
|
 | |
| |
| |
| |
| |
| |
|
Gene: HERC6 |
Gene summary for HERC6 |
| Gene information | Species | Human | Gene symbol | HERC6 | Gene ID | 55008 |
| Gene name | HECT and RLD domain containing E3 ubiquitin protein ligase family member 6 | |
| Gene Alias | HERC6 | |
| Cytomap | 4q22.1 | |
| Gene Type | protein-coding | GO ID | GO:0006464 | UniProtAcc | Q8IVU3 |
Top |
Malignant transformation analysis |
| Identification of the aberrant gene expression in precancerous and cancerous lesions by comparing the gene expression of stem-like cells in diseased tissues with normal stem cells |
| Entrez ID | Symbol | Replicates | Species | Organ | Tissue | Adj P-value | Log2FC | Malignancy |
| 55008 | HERC6 | HTA11_2951_2000001011 | Human | Colorectum | AD | 2.35e-03 | 3.36e-01 | 0.0216 |
| 55008 | HERC6 | HTA11_1938_2000001011 | Human | Colorectum | AD | 2.41e-05 | 2.45e-01 | -0.0811 |
| 55008 | HERC6 | HTA11_347_2000001011 | Human | Colorectum | AD | 2.44e-02 | 1.20e-01 | -0.1954 |
| 55008 | HERC6 | HTA11_2112_2000001011 | Human | Colorectum | SER | 1.76e-05 | 3.71e-01 | -0.2196 |
| 55008 | HERC6 | HTA11_696_2000001011 | Human | Colorectum | AD | 8.57e-08 | 3.01e-01 | -0.1464 |
| 55008 | HERC6 | HTA11_1391_2000001011 | Human | Colorectum | AD | 1.31e-06 | 2.15e-01 | -0.059 |
| 55008 | HERC6 | LZE20T | Human | Esophagus | ESCC | 5.60e-04 | 1.55e-01 | 0.0662 |
| 55008 | HERC6 | LZE24T | Human | Esophagus | ESCC | 4.42e-18 | 5.41e-01 | 0.0596 |
| 55008 | HERC6 | P1T-E | Human | Esophagus | ESCC | 1.91e-04 | 3.95e-01 | 0.0875 |
| 55008 | HERC6 | P2T-E | Human | Esophagus | ESCC | 1.97e-24 | 5.68e-01 | 0.1177 |
| 55008 | HERC6 | P4T-E | Human | Esophagus | ESCC | 1.96e-04 | 1.36e-01 | 0.1323 |
| 55008 | HERC6 | P8T-E | Human | Esophagus | ESCC | 2.78e-14 | 3.01e-01 | 0.0889 |
| 55008 | HERC6 | P9T-E | Human | Esophagus | ESCC | 7.75e-10 | 2.33e-01 | 0.1131 |
| 55008 | HERC6 | P11T-E | Human | Esophagus | ESCC | 8.56e-25 | 8.07e-01 | 0.1426 |
| 55008 | HERC6 | P15T-E | Human | Esophagus | ESCC | 3.10e-08 | 2.64e-01 | 0.1149 |
| 55008 | HERC6 | P17T-E | Human | Esophagus | ESCC | 1.30e-09 | 4.76e-01 | 0.1278 |
| 55008 | HERC6 | P20T-E | Human | Esophagus | ESCC | 1.10e-05 | 2.12e-01 | 0.1124 |
| 55008 | HERC6 | P21T-E | Human | Esophagus | ESCC | 6.54e-06 | 2.45e-01 | 0.1617 |
| 55008 | HERC6 | P22T-E | Human | Esophagus | ESCC | 5.30e-04 | 5.16e-02 | 0.1236 |
| 55008 | HERC6 | P23T-E | Human | Esophagus | ESCC | 1.61e-08 | 2.29e-01 | 0.108 |
| Page: 1 2 3 4 |
| Tissue | Expression Dynamics | Abbreviation |
| Colorectum (GSE201348) |  | FAP: Familial adenomatous polyposis |
| CRC: Colorectal cancer | ||
| Colorectum (HTA11) |  | AD: Adenomas |
| SER: Sessile serrated lesions | ||
| MSI-H: Microsatellite-high colorectal cancer | ||
| MSS: Microsatellite stable colorectal cancer | ||
| Esophagus | 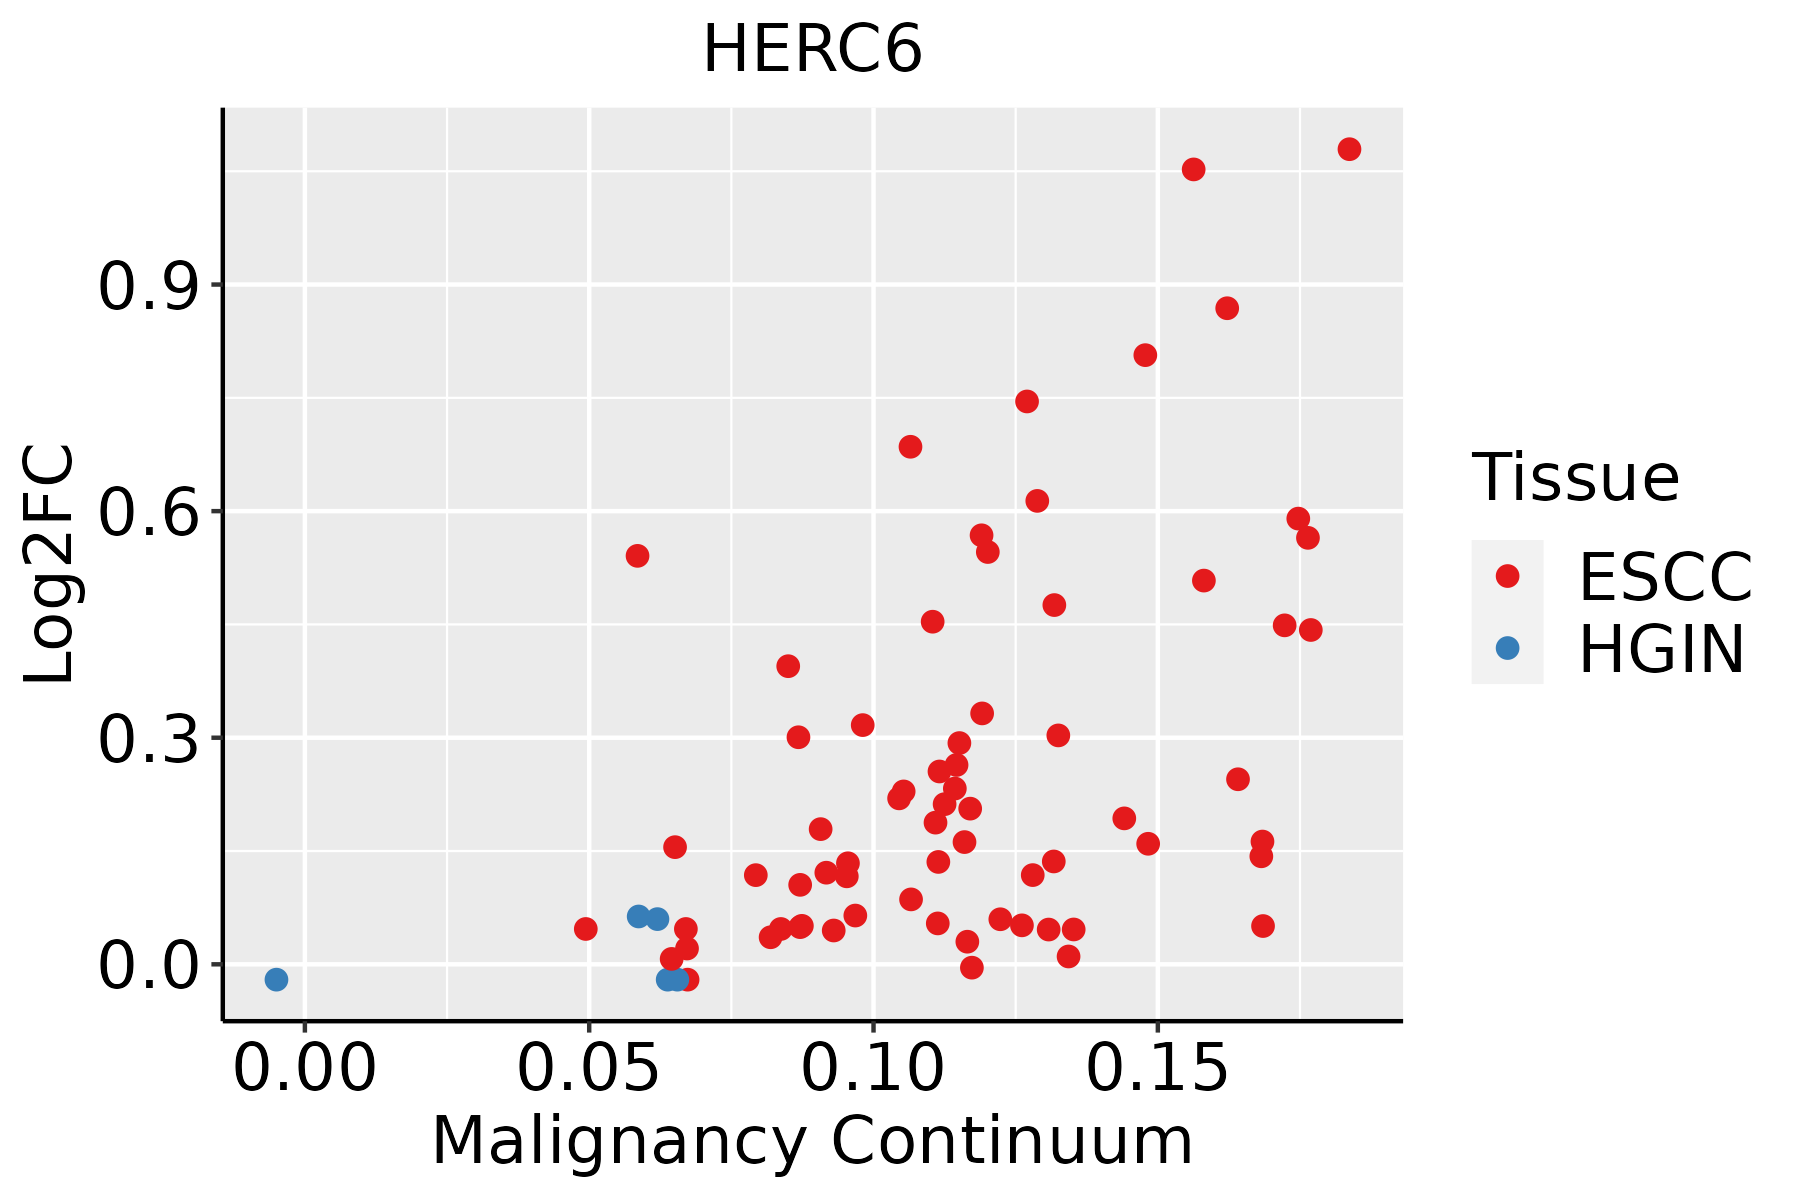 | ESCC: Esophageal squamous cell carcinoma |
| HGIN: High-grade intraepithelial neoplasias | ||
| LGIN: Low-grade intraepithelial neoplasias | ||
| Oral Cavity | 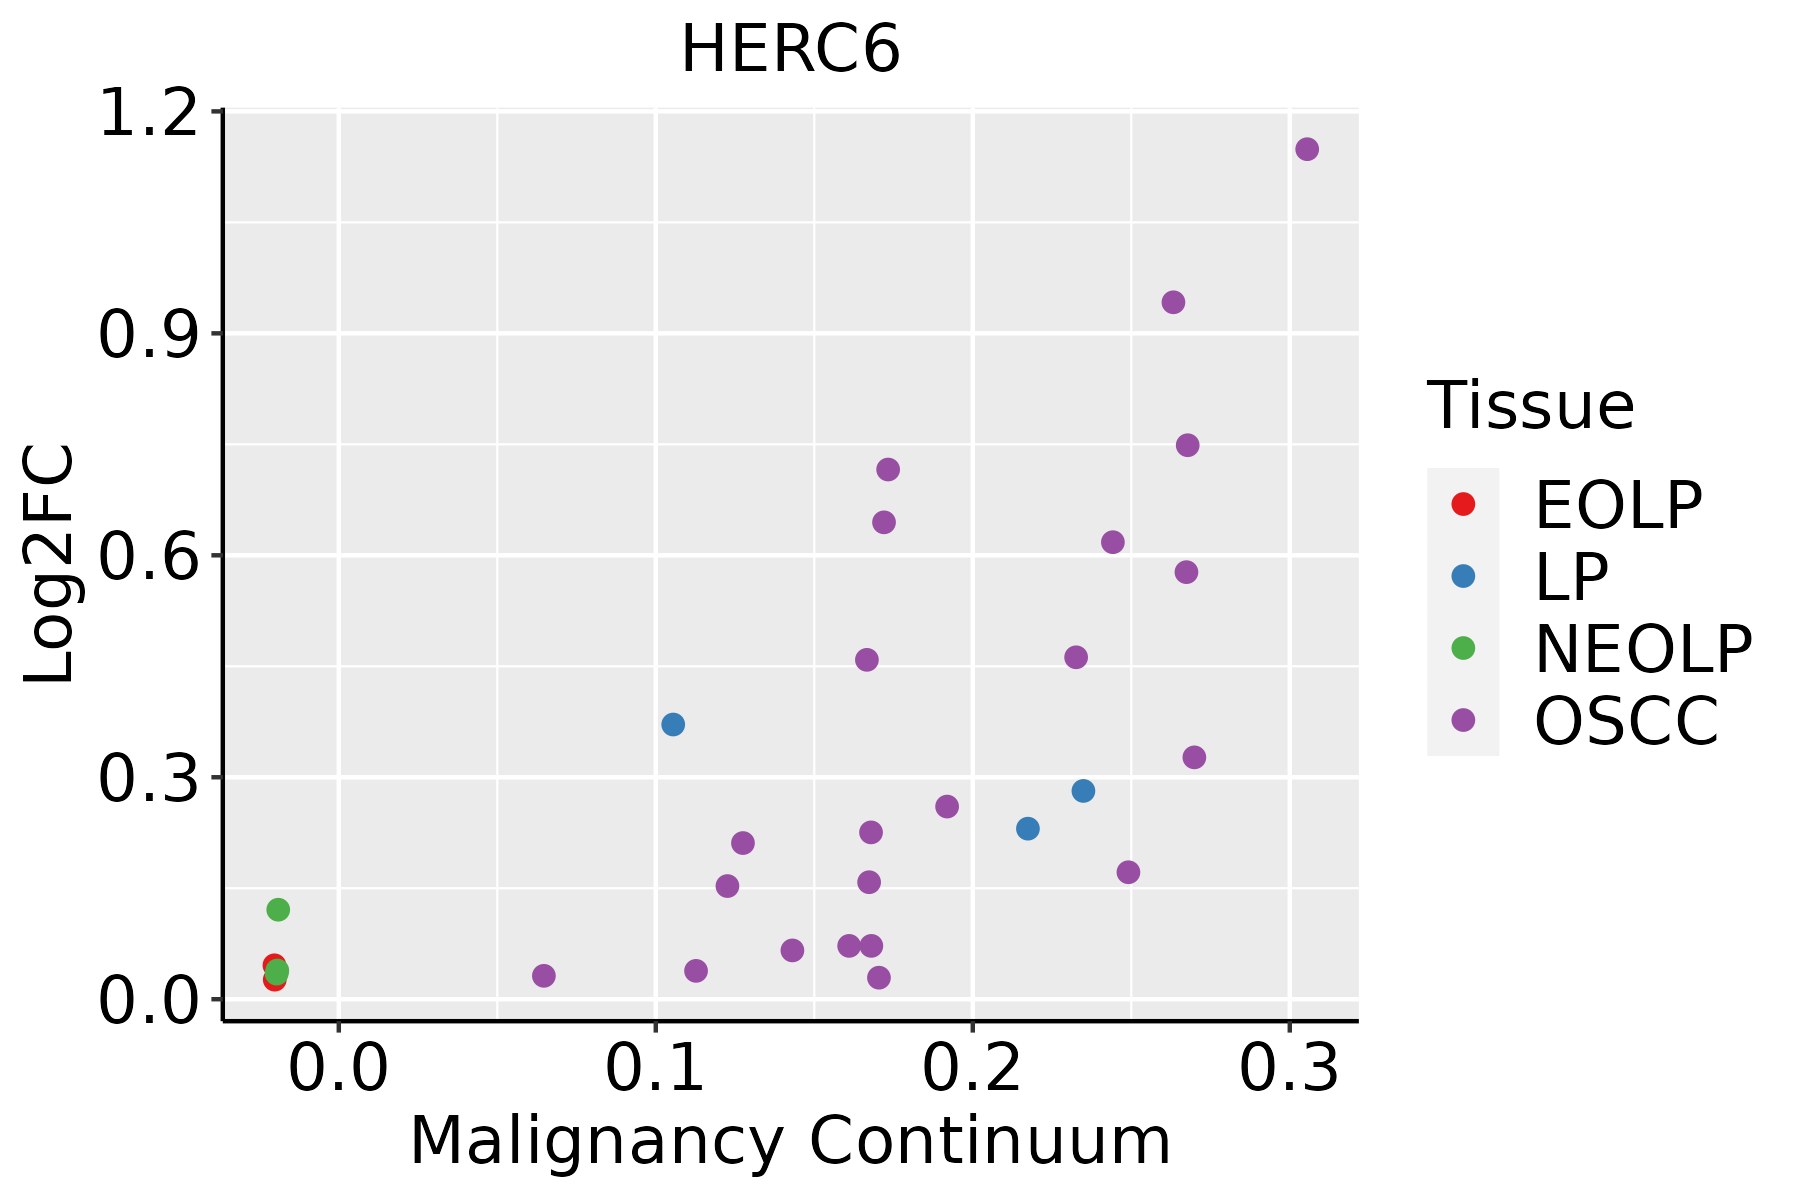 | EOLP: Erosive Oral lichen planus |
| LP: leukoplakia | ||
| NEOLP: Non-erosive oral lichen planus | ||
| OSCC: Oral squamous cell carcinoma | ||
| Skin | 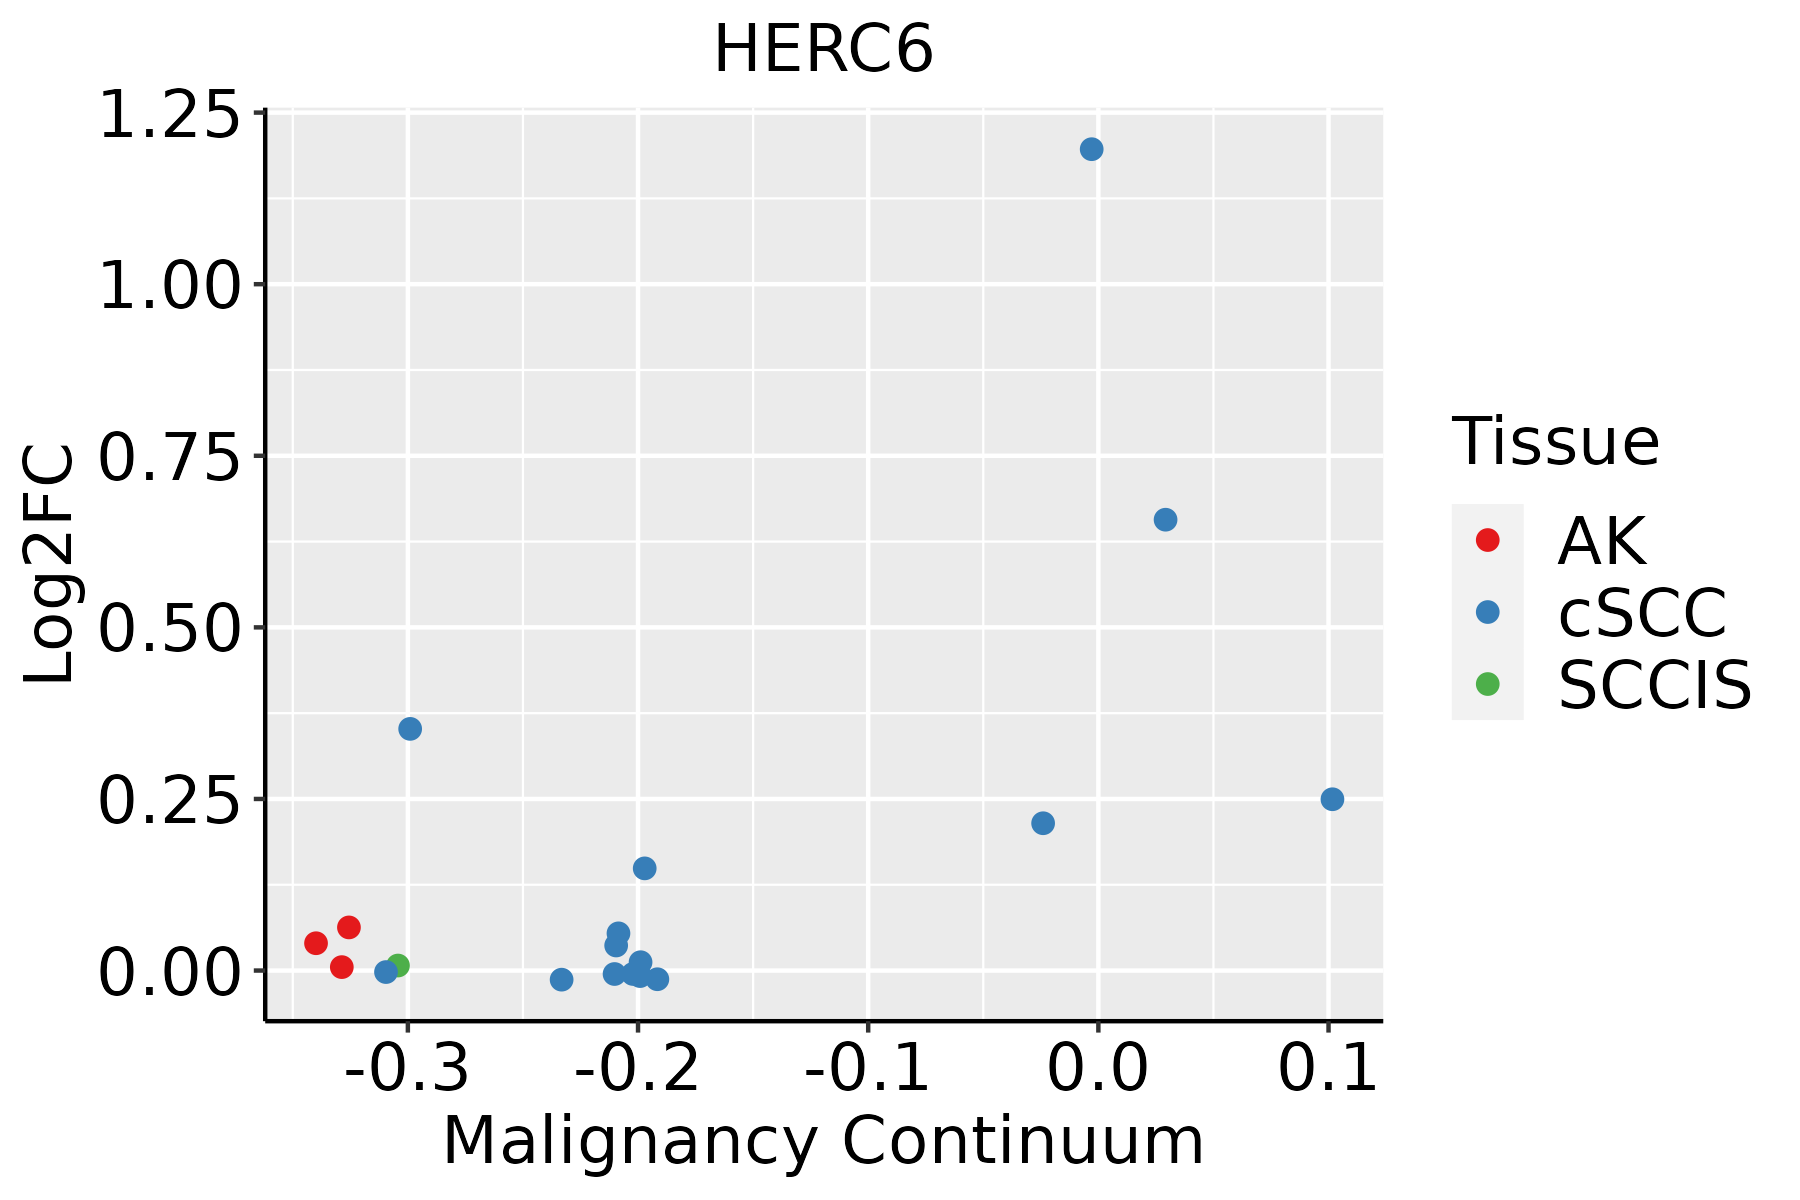 | AK: Actinic keratosis |
| cSCC: Cutaneous squamous cell carcinoma | ||
| SCCIS:squamous cell carcinoma in situ |
| ∗log2FC in expression of this searched gene in stem-like cells from each diseased tissue sample relative to stem-like cells in normal samples in each tissue plotted against the malignancy continuum. Samples are colored based on if they are from different disease stage. |
Top |
Malignant transformation related pathway analysis |
| Find out the enriched GO biological processes and KEGG pathways involved in transition from healthy to precancer to cancer |
| Tissue | Disease Stage | Enriched GO biological Processes |
| Colorectum | AD |  |
| Colorectum | SER |  |
| Colorectum | MSS |  |
| Colorectum | MSI-H |  |
| Colorectum | FAP |  |
| ∗Top 15 enriched GO BP terms are showed in the bar plot of each disease state in each tissue. Each row represents a significant GO biological process which is colored according to the -log10(p.adjust). |
| Page: 1 2 3 4 5 6 7 8 9 |
| GO ID | Tissue | Disease Stage | Description | Gene Ratio | Bg Ratio | pvalue | p.adjust | Count |
| Page: 1 |
| Pathway ID | Tissue | Disease Stage | Description | Gene Ratio | Bg Ratio | pvalue | p.adjust | qvalue | Count |
| Page: 1 |
Top |
Cell-cell communication analysis |
| Identification of potential cell-cell interactions between two cell types and their ligand-receptor pairs for different disease states |
| Ligand | Receptor | LRpair | Pathway | Tissue | Disease Stage |
| Page: 1 |
Top |
Single-cell gene regulatory network inference analysis |
| Find out the significant the regulons (TFs) and the target genes of each regulon across cell types for different disease states |
| TF | Cell Type | Tissue | Disease Stage | Target Gene | RSS | Regulon Activity |
| ∗The dot plots of a searched regulon are shown for all cell subpopulations in each disease state of each tissue based on the regulon specific score inferred using pySCENIC and by calculating the average expression. |
| Page: 1 |
Top |
Somatic mutation of malignant transformation related genes |
| Annotation of somatic variants for genes involved in malignant transformation |
| Hugo Symbol | Variant Class | Variant Classification | dbSNP RS | HGVSc | HGVSp | HGVSp Short | SWISSPROT | BIOTYPE | SIFT | PolyPhen | Tumor Sample Barcode | Tissue | Histology | Sex | Age | Stage | Therapy Types | Drugs | Outcome |
| HERC6 | SNV | Missense_Mutation | rs200315029 | c.631N>A | p.Gly211Arg | p.G211R | Q8IVU3 | protein_coding | tolerated(0.05) | probably_damaging(0.999) | TCGA-A2-A4RW-01 | Breast | breast invasive carcinoma | Female | <65 | III/IV | Unknown | Unknown | SD |
| HERC6 | SNV | Missense_Mutation | c.452C>T | p.Ser151Leu | p.S151L | Q8IVU3 | protein_coding | deleterious(0) | probably_damaging(1) | TCGA-AN-A046-01 | Breast | breast invasive carcinoma | Female | >=65 | I/II | Unknown | Unknown | SD | |
| HERC6 | SNV | Missense_Mutation | rs369219414 | c.869C>T | p.Ser290Leu | p.S290L | Q8IVU3 | protein_coding | deleterious(0) | probably_damaging(1) | TCGA-AN-A046-01 | Breast | breast invasive carcinoma | Female | >=65 | I/II | Unknown | Unknown | SD |
| HERC6 | SNV | Missense_Mutation | rs560103087 | c.1886C>T | p.Ser629Leu | p.S629L | Q8IVU3 | protein_coding | tolerated(1) | benign(0) | TCGA-AN-A046-01 | Breast | breast invasive carcinoma | Female | >=65 | I/II | Unknown | Unknown | SD |
| HERC6 | SNV | Missense_Mutation | novel | c.679C>A | p.Pro227Thr | p.P227T | Q8IVU3 | protein_coding | deleterious(0) | probably_damaging(0.995) | TCGA-AN-A0FX-01 | Breast | breast invasive carcinoma | Female | <65 | I/II | Unknown | Unknown | SD |
| HERC6 | SNV | Missense_Mutation | novel | c.1621G>A | p.Ala541Thr | p.A541T | Q8IVU3 | protein_coding | tolerated(0.13) | benign(0.05) | TCGA-AR-A2LL-01 | Breast | breast invasive carcinoma | Female | >=65 | I/II | Hormone Therapy | tamoxiphen | SD |
| HERC6 | SNV | Missense_Mutation | c.329N>A | p.Gly110Glu | p.G110E | Q8IVU3 | protein_coding | tolerated(0.07) | probably_damaging(0.979) | TCGA-B6-A0WV-01 | Breast | breast invasive carcinoma | Female | >=65 | I/II | Unknown | Unknown | SD | |
| HERC6 | SNV | Missense_Mutation | novel | c.1714N>T | p.Val572Leu | p.V572L | Q8IVU3 | protein_coding | deleterious(0.01) | possibly_damaging(0.708) | TCGA-BH-A0DL-01 | Breast | breast invasive carcinoma | Female | <65 | I/II | Chemotherapy | cytoxan | CR |
| HERC6 | SNV | Missense_Mutation | c.1597N>T | p.Pro533Ser | p.P533S | Q8IVU3 | protein_coding | tolerated(0.44) | benign(0) | TCGA-BH-A0EE-01 | Breast | breast invasive carcinoma | Female | >=65 | I/II | Chemotherapy | docetaxel | SD | |
| HERC6 | SNV | Missense_Mutation | c.1322G>A | p.Arg441Lys | p.R441K | Q8IVU3 | protein_coding | tolerated(0.09) | benign(0.007) | TCGA-C8-A26Y-01 | Breast | breast invasive carcinoma | Female | >=65 | I/II | Unknown | Unknown | SD |
| Page: 1 2 3 4 5 6 7 8 9 10 11 12 13 |
Top |
Related drugs of malignant transformation related genes |
| Identification of chemicals and drugs interact with genes involved in malignant transfromation |
| (DGIdb 4.0) |
| Entrez ID | Symbol | Category | Interaction Types | Drug Claim Name | Drug Name | PMIDs |
| Page: 1 |

Copyright 2023-Present -The University of Texas Health Science Center at Houston |