Schematic overview of the cellular and molecular mechanisms involved in the cancer progression, including the proposed cellular and molecular mechanisms in cancer cells trajectory. AT1: alveolar type 1 cells; AT2: alveolar type 2 cells; AAH: atypical adenomatous hyperplasia; AIS: adenocarcinoma in situ; MIA: minimally invasive adenocarcinoma; IA: invasive adenocarcinoma; EMT: epithelial-mesenchymal transition

Home

Download

Statistics

Help

Contact

Center for Computational Systems Medicine
leaf

Gene summary

leaf

Malignant transformation analysis

leaf

Malignant transformation related pathway analysis

leaf

Cell-cell communication analysis

leaf

Single-cell gene regulatory network inference analysis

leaf

Somatic mutation of malignant transformation related genes

leaf

Related drugs of malignant transformation related genes

Gene: HERC5

Gene summary for HERC5

check button Gene summary.

Gene informationSpeciesHuman
Gene symbol

HERC5

Gene ID

51191

Gene nameHECT and RLD domain containing E3 ubiquitin protein ligase 5
Gene AliasCEB1
Cytomap4q22.1
Gene Typeprotein-coding
GO ID

GO:0000079

UniProtAcc

B4DXV3


Top

Malignant transformation analysis

check button Identification of the aberrant gene expression in precancerous and cancerous lesions by comparing the gene expression of stem-like cells in diseased tissues with normal stem cells
check button Malignant transformation involving gene list.
Entrez IDSymbolReplicatesSpeciesOrganTissueAdj P-valueLog2FCMalignancy
51191HERC5LZE20THumanEsophagusESCC1.64e-021.67e-010.0662
51191HERC5LZE24THumanEsophagusESCC2.04e-062.06e-010.0596
51191HERC5P2T-EHumanEsophagusESCC3.35e-408.00e-010.1177
51191HERC5P5T-EHumanEsophagusESCC2.03e-091.68e-010.1327
51191HERC5P8T-EHumanEsophagusESCC7.90e-039.30e-020.0889
51191HERC5P11T-EHumanEsophagusESCC9.20e-145.19e-010.1426
51191HERC5P15T-EHumanEsophagusESCC4.23e-062.05e-010.1149
51191HERC5P16T-EHumanEsophagusESCC1.88e-041.17e-010.1153
51191HERC5P17T-EHumanEsophagusESCC3.80e-022.49e-010.1278
51191HERC5P20T-EHumanEsophagusESCC2.70e-033.33e-010.1124
51191HERC5P21T-EHumanEsophagusESCC1.96e-051.80e-010.1617
51191HERC5P22T-EHumanEsophagusESCC4.17e-051.04e-010.1236
51191HERC5P23T-EHumanEsophagusESCC2.10e-093.30e-010.108
51191HERC5P24T-EHumanEsophagusESCC1.88e-113.15e-010.1287
51191HERC5P26T-EHumanEsophagusESCC5.30e-214.48e-010.1276
51191HERC5P27T-EHumanEsophagusESCC2.03e-092.16e-010.1055
51191HERC5P28T-EHumanEsophagusESCC3.60e-132.48e-010.1149
51191HERC5P31T-EHumanEsophagusESCC1.43e-428.55e-010.1251
51191HERC5P36T-EHumanEsophagusESCC4.88e-073.09e-010.1187
51191HERC5P37T-EHumanEsophagusESCC7.56e-111.84e-010.1371
Page: 1 2 3 4 

check button Transcriptomic changes along malignancy continuum.
TissueExpression DynamicsAbbreviation
EsophagusThe image shows the transcriptomic changes along malignancy continuum.log2FC in expression of this searched gene in stem-like cells from each diseased tissue sample relative to stem-like cells in normal samples in each tissue plotted against the malignancy continuum. Samples are colored based on if they are from different disease stage.
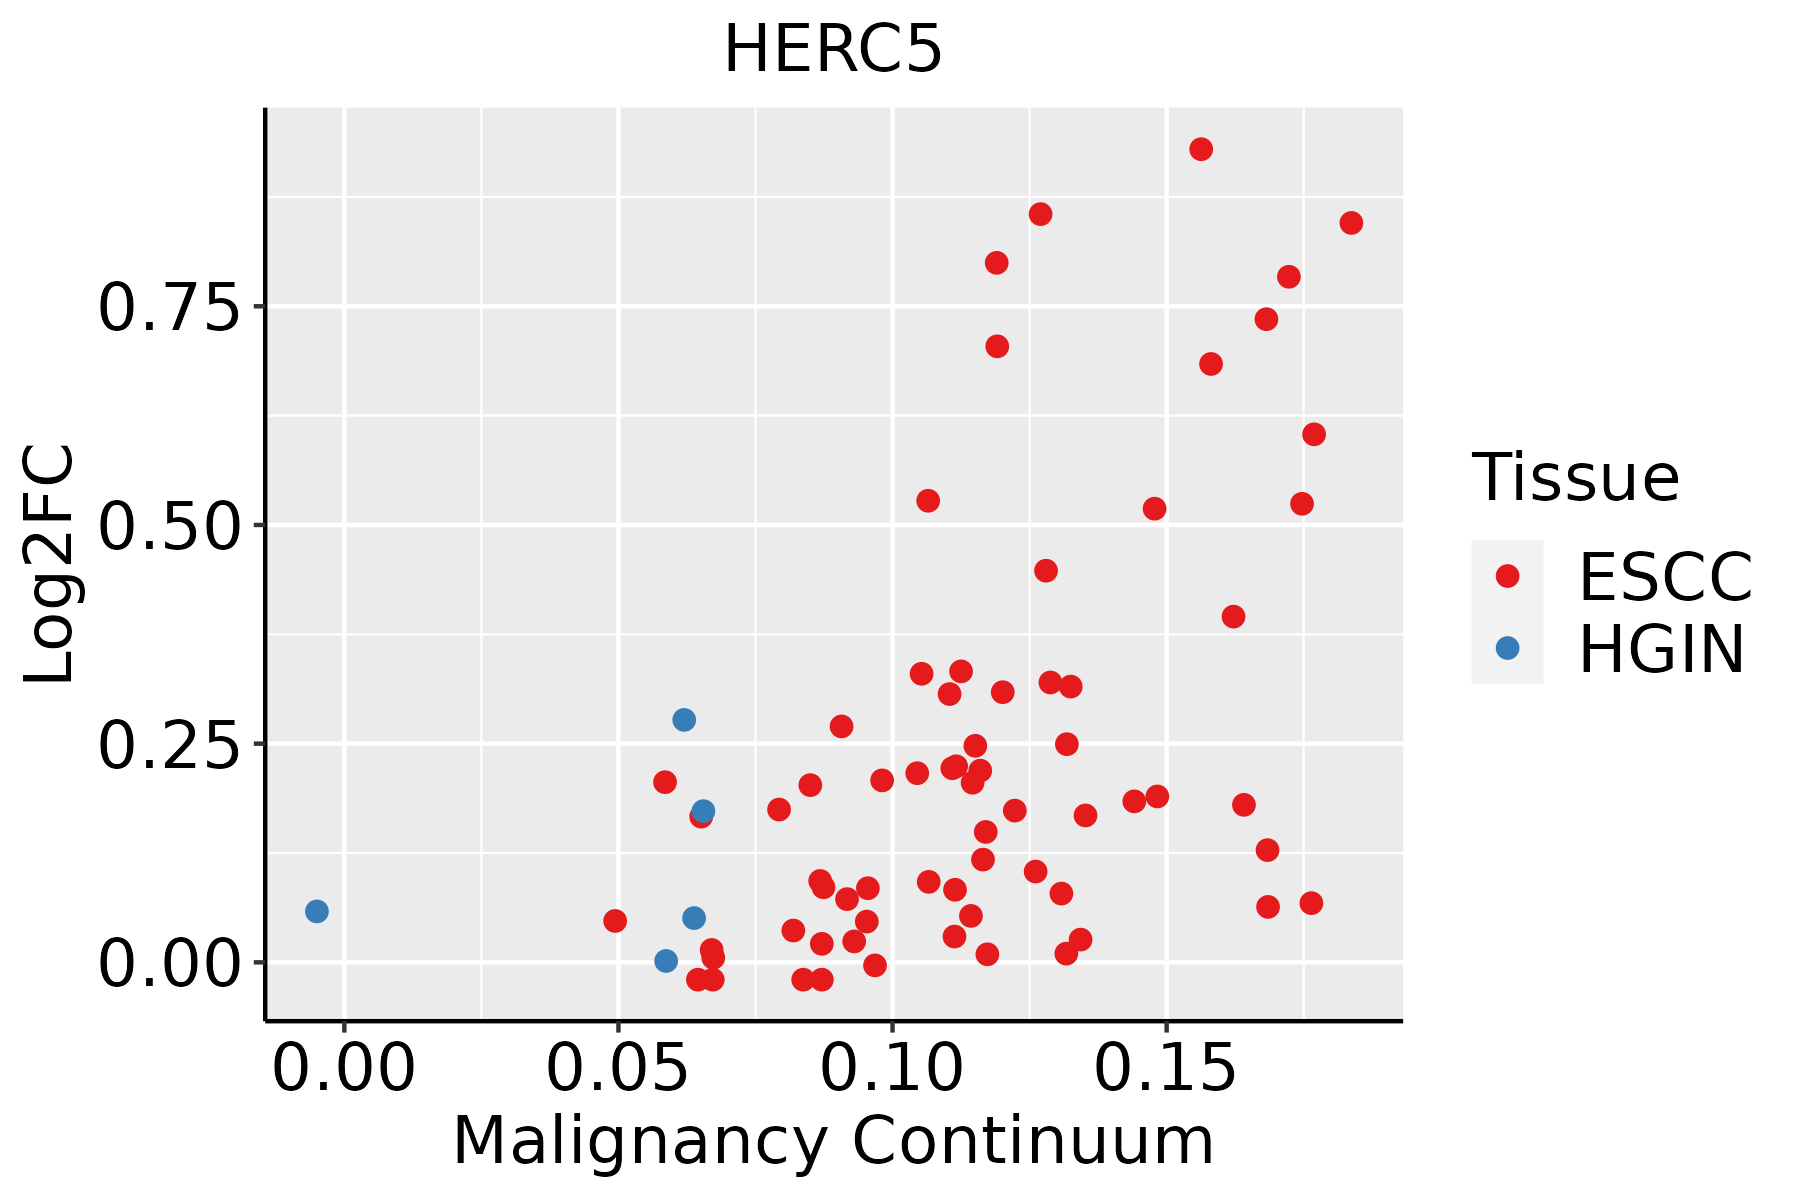
ESCC: Esophageal squamous cell carcinoma
HGIN: High-grade intraepithelial neoplasias
LGIN: Low-grade intraepithelial neoplasias
LiverThe image shows the transcriptomic changes along malignancy continuum.log2FC in expression of this searched gene in stem-like cells from each diseased tissue sample relative to stem-like cells in normal samples in each tissue plotted against the malignancy continuum. Samples are colored based on if they are from different disease stage.
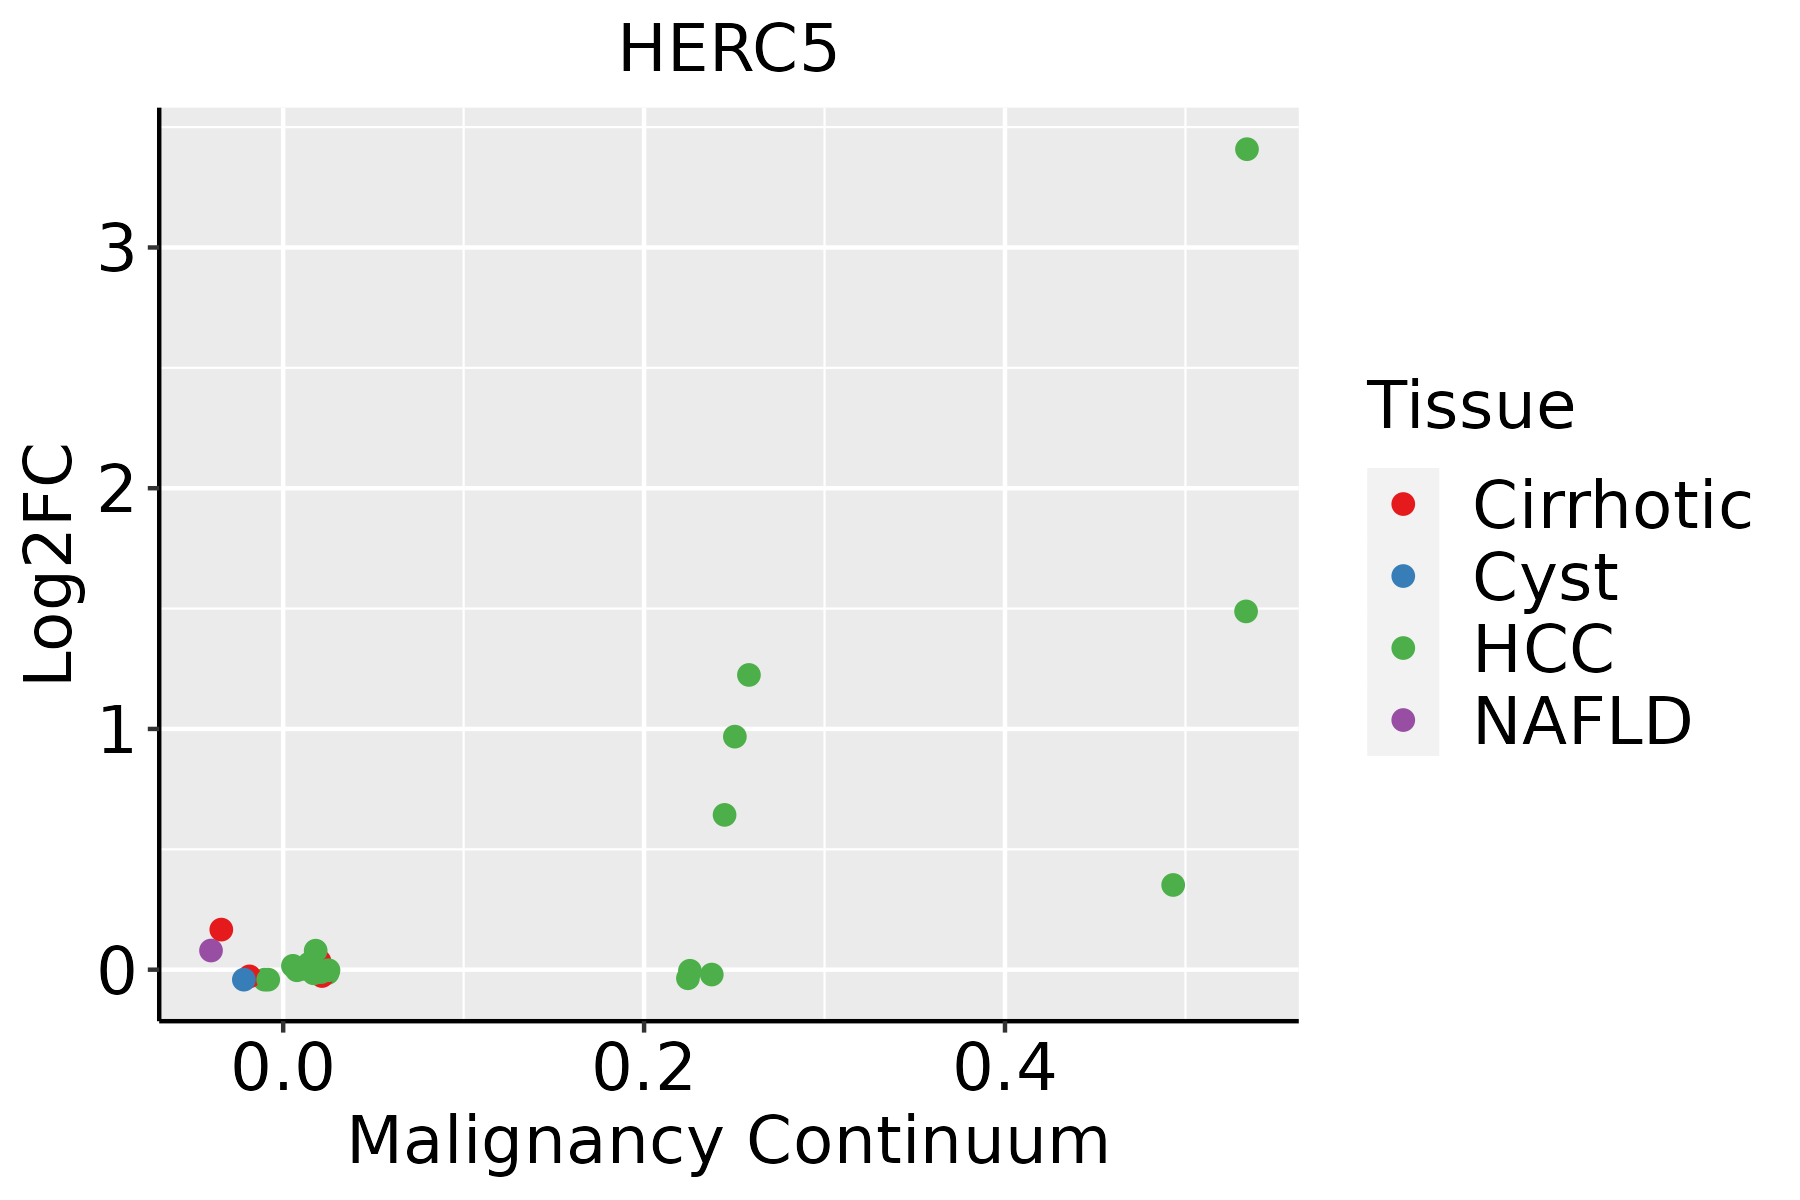
HCC: Hepatocellular carcinoma
NAFLD: Non-alcoholic fatty liver disease
Oral CavityThe image shows the transcriptomic changes along malignancy continuum.log2FC in expression of this searched gene in stem-like cells from each diseased tissue sample relative to stem-like cells in normal samples in each tissue plotted against the malignancy continuum. Samples are colored based on if they are from different disease stage.
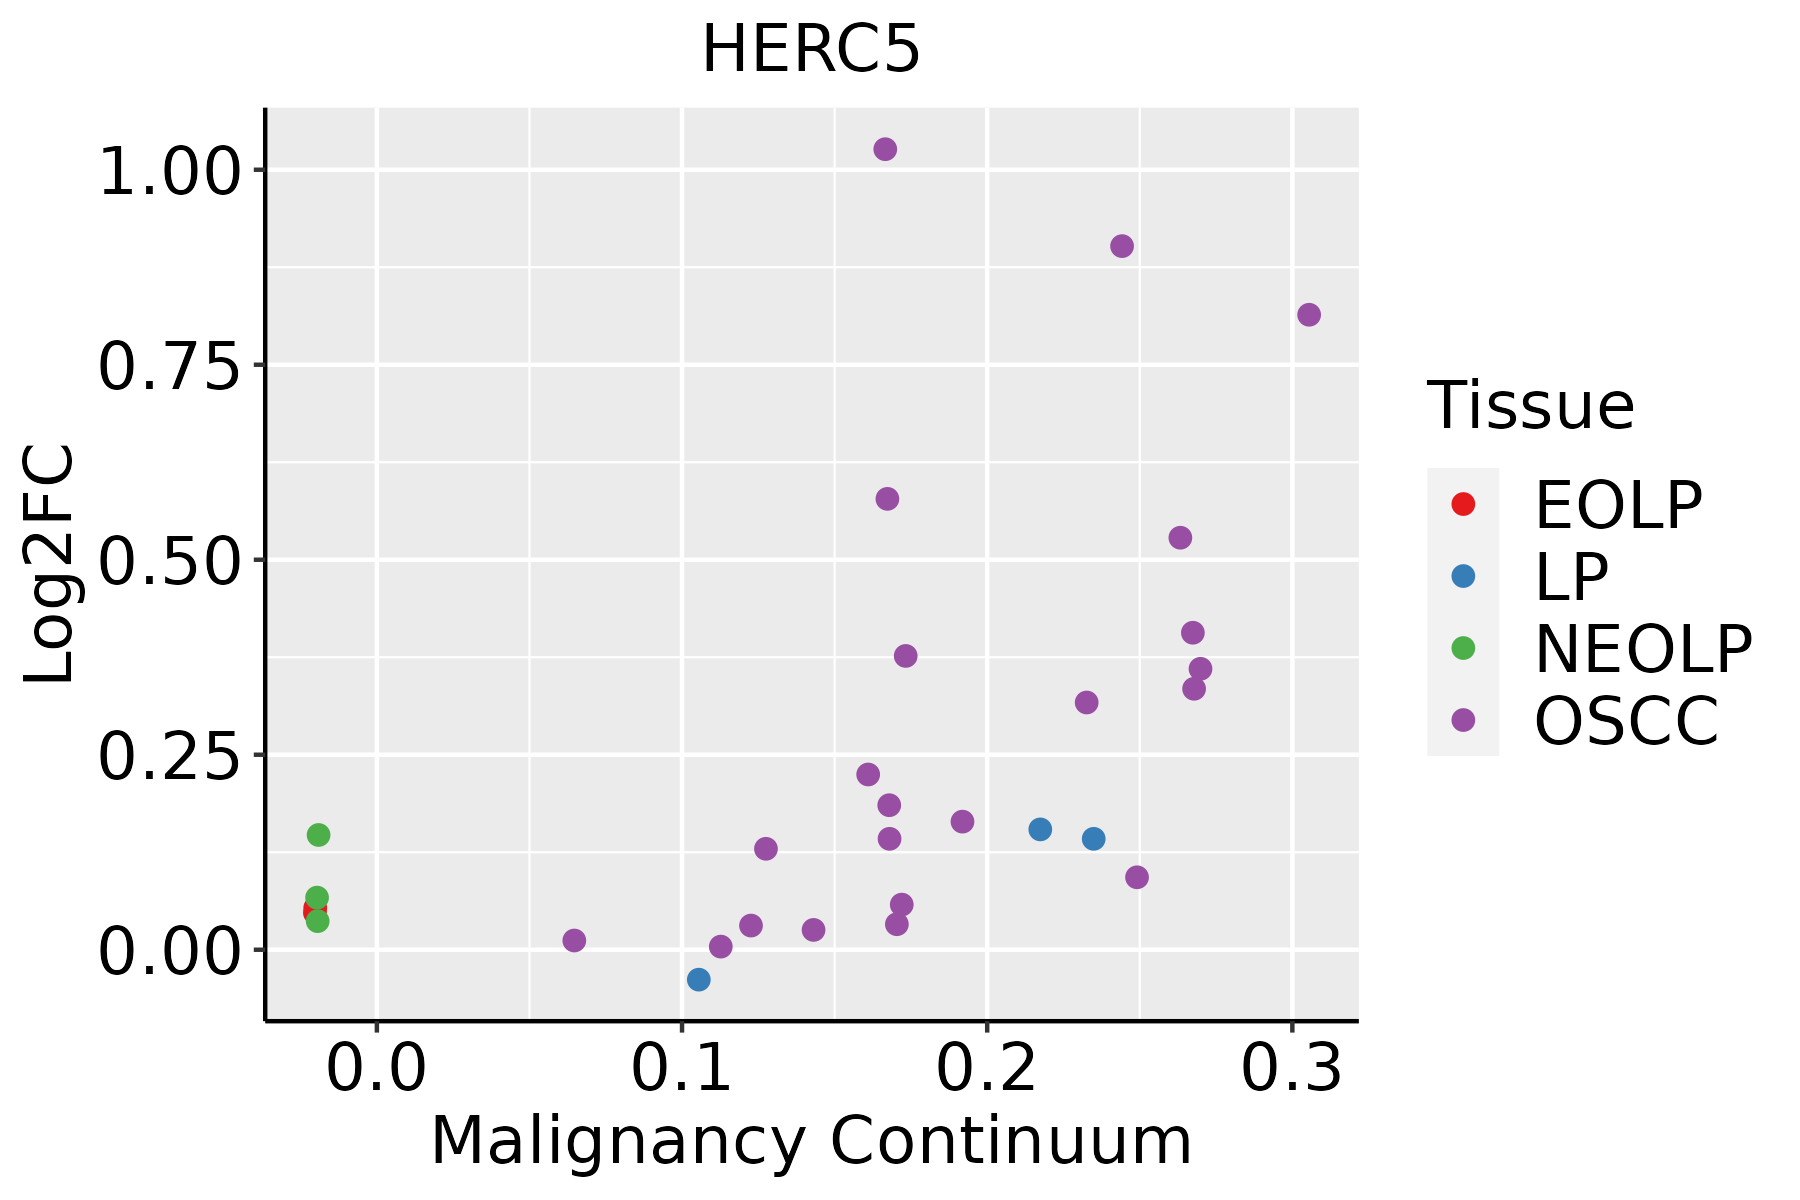
EOLP: Erosive Oral lichen planus
LP: leukoplakia
NEOLP: Non-erosive oral lichen planus
OSCC: Oral squamous cell carcinoma
ThyroidThe image shows the transcriptomic changes along malignancy continuum.log2FC in expression of this searched gene in stem-like cells from each diseased tissue sample relative to stem-like cells in normal samples in each tissue plotted against the malignancy continuum. Samples are colored based on if they are from different disease stage.
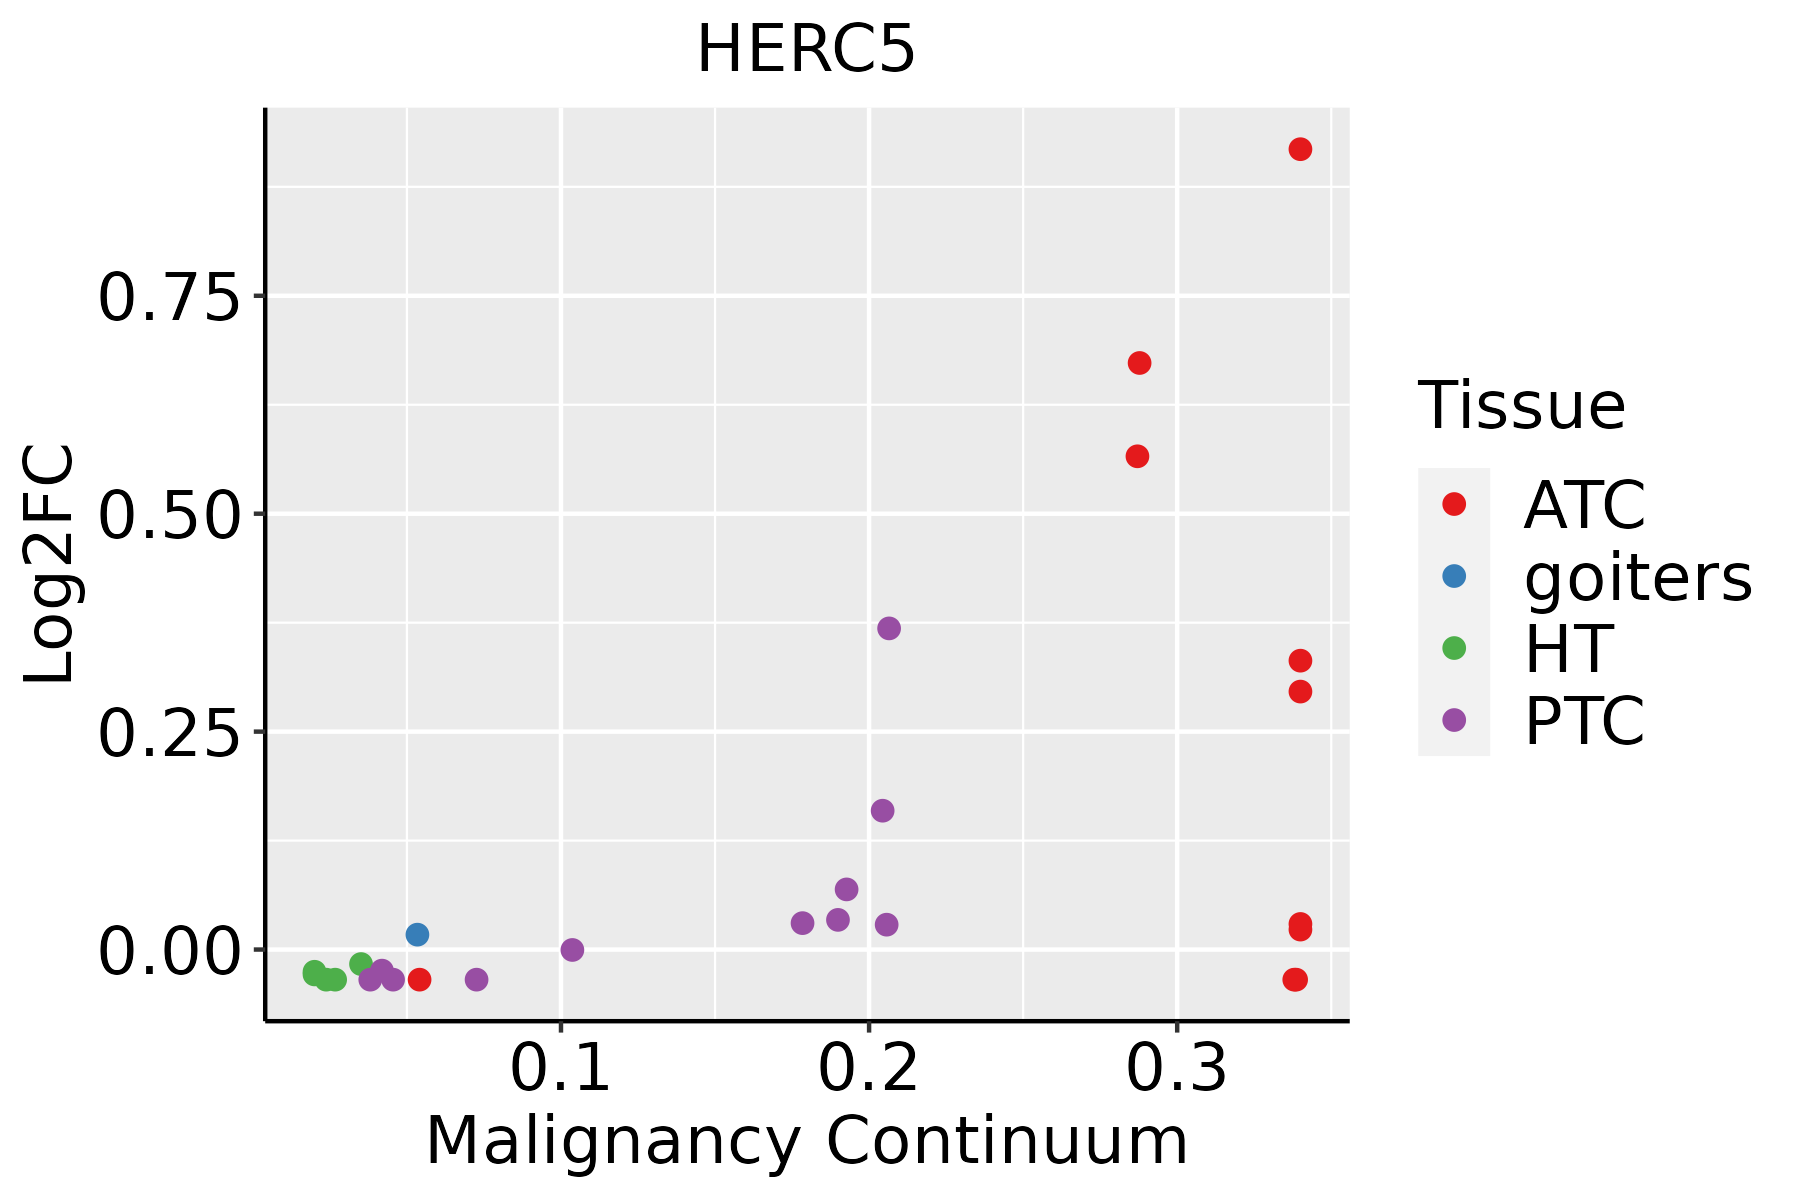
ATC: Anaplastic thyroid cancer
HT: Hashimoto's thyroiditis
PTC: Papillary thyroid cancer
∗log2FC in expression of this searched gene in stem-like cells from each diseased tissue sample relative to stem-like cells in normal samples in each tissue plotted against the malignancy continuum. Samples are colored based on if they are from different disease stage.

Top

Malignant transformation related pathway analysis

check buttonFind out the enriched GO biological processes and KEGG pathways involved in transition from healthy to precancer to cancer
check button Figure of enriched GO biological processes.
TissueDisease StageEnriched GO biological Processes
ColorectumADGO analysis - Figure of enriched GO biological processes: Top 15 enriched GO BP terms are showed in the bar plot of each disease state in each tissue. Each row represents a significant GO biological process which is colored according to the -log10(p.adjust).
ColorectumSERGO analysis - Figure of enriched GO biological processes: Top 15 enriched GO BP terms are showed in the bar plot of each disease state in each tissue. Each row represents a significant GO biological process which is colored according to the -log10(p.adjust).
ColorectumMSSGO analysis - Figure of enriched GO biological processes: Top 15 enriched GO BP terms are showed in the bar plot of each disease state in each tissue. Each row represents a significant GO biological process which is colored according to the -log10(p.adjust).
ColorectumMSI-HGO analysis - Figure of enriched GO biological processes: Top 15 enriched GO BP terms are showed in the bar plot of each disease state in each tissue. Each row represents a significant GO biological process which is colored according to the -log10(p.adjust).
ColorectumFAPGO analysis - Figure of enriched GO biological processes: Top 15 enriched GO BP terms are showed in the bar plot of each disease state in each tissue. Each row represents a significant GO biological process which is colored according to the -log10(p.adjust).
∗Top 15 enriched GO BP terms are showed in the bar plot of each disease state in each tissue. Each row represents a significant GO biological process which is colored according to the -log10(p.adjust).
Page: 1 2 3 4 5 6 7 8 9 

check button Enriched GO biological processes.
GO IDTissueDisease StageDescriptionGene RatioBg Ratiopvaluep.adjustCount
GO:000961518EsophagusESCCresponse to virus238/8552367/187236.65e-143.32e-12238
GO:007190016EsophagusESCCregulation of protein serine/threonine kinase activity227/8552359/187231.12e-114.10e-10227
GO:00516075EsophagusESCCdefense response to virus171/8552265/187233.91e-101.05e-08171
GO:01405465EsophagusESCCdefense response to symbiont171/8552265/187233.91e-101.05e-08171
GO:19040294EsophagusESCCregulation of cyclin-dependent protein kinase activity69/855298/187236.04e-077.91e-0669
GO:00000794EsophagusESCCregulation of cyclin-dependent protein serine/threonine kinase activity66/855294/187231.24e-061.53e-0566
GO:00028318EsophagusESCCregulation of response to biotic stimulus191/8552327/187232.12e-062.45e-05191
GO:00506884EsophagusESCCregulation of defense response to virus45/855269/187238.26e-044.27e-0345
GO:000961511LiverHCCresponse to virus210/7958367/187237.32e-091.86e-07210
GO:00516071LiverHCCdefense response to virus151/7958265/187231.27e-061.85e-05151
GO:01405461LiverHCCdefense response to symbiont151/7958265/187231.27e-061.85e-05151
GO:007190021LiverHCCregulation of protein serine/threonine kinase activity189/7958359/187235.97e-055.47e-04189
GO:00028312LiverHCCregulation of response to biotic stimulus173/7958327/187238.55e-057.48e-04173
GO:0000079LiverHCCregulation of cyclin-dependent protein serine/threonine kinase activity55/795894/187231.25e-036.91e-0355
GO:1904029LiverHCCregulation of cyclin-dependent protein kinase activity57/795898/187231.26e-036.92e-0357
GO:0050688LiverHCCregulation of defense response to virus41/795869/187233.38e-031.54e-0241
GO:000961515Oral cavityOSCCresponse to virus215/7305367/187231.63e-149.41e-13215
GO:007190010Oral cavityOSCCregulation of protein serine/threonine kinase activity201/7305359/187233.90e-111.27e-09201
GO:00516074Oral cavityOSCCdefense response to virus154/7305265/187231.96e-105.63e-09154
GO:01405464Oral cavityOSCCdefense response to symbiont154/7305265/187231.96e-105.63e-09154
Page: 1 2 

check button Enriched KEGG pathways.
Pathway IDTissueDisease StageDescriptionGene RatioBg Ratiopvaluep.adjustqvalueCount
Page: 1 

Top

Cell-cell communication analysis

check buttonIdentification of potential cell-cell interactions between two cell types and their ligand-receptor pairs for different disease states
LigandReceptorLRpairPathwayTissueDisease Stage
Page: 1 

Top

Single-cell gene regulatory network inference analysis

check buttonFind out the significant the regulons (TFs) and the target genes of each regulon across cell types for different disease states
TFCell TypeTissueDisease StageTarget GeneRSSRegulon Activity
∗The dot plots of a searched regulon are shown for all cell subpopulations in each disease state of each tissue based on the regulon specific score inferred using pySCENIC and by calculating the average expression.
Page: 1 

Top

Somatic mutation of malignant transformation related genes

check buttonAnnotation of somatic variants for genes involved in malignant transformation
Hugo SymbolVariant ClassVariant ClassificationdbSNP RSHGVScHGVSpHGVSp ShortSWISSPROTBIOTYPESIFTPolyPhenTumor Sample BarcodeTissueHistologySexAgeStageTherapy TypesDrugsOutcome
HERC5SNVMissense_Mutationrs145240865c.1219N>Tp.Arg407Trpp.R407WQ9UII4protein_codingdeleterious(0)benign(0.251)TCGA-A8-A06U-01Breastbreast invasive carcinomaFemale>=65I/IIUnknownUnknownSD
HERC5SNVMissense_Mutationc.2113N>Cp.Asp705Hisp.D705HQ9UII4protein_codingdeleterious(0)probably_damaging(0.958)TCGA-AC-A23H-01Breastbreast invasive carcinomaFemale>=65I/IIUnknownUnknownPD
HERC5SNVMissense_Mutationrs760663348c.3017N>Cp.Met1006Thrp.M1006TQ9UII4protein_codingdeleterious(0)benign(0.355)TCGA-AC-A3EH-01Breastbreast invasive carcinomaFemale>=65III/IVUnknownUnknownSD
HERC5SNVMissense_Mutationc.1042N>Ap.Glu348Lysp.E348KQ9UII4protein_codingtolerated(0.14)benign(0.017)TCGA-BH-A0HP-01Breastbreast invasive carcinomaFemale>=65III/IVChemotherapydoxorubicinSD
HERC5SNVMissense_Mutationnovelc.1497N>Tp.Met499Ilep.M499IQ9UII4protein_codingdeleterious(0)possibly_damaging(0.542)TCGA-PL-A8LZ-01Breastbreast invasive carcinomaFemale<65III/IVChemotherapypaclitaxelSD
HERC5insertionNonsense_Mutationnovelc.836_837insCAAAGGTACAATATTGTGATATTATACTAGGTp.Thr280LysfsTer6p.T280Kfs*6Q9UII4protein_codingTCGA-A8-A079-01Breastbreast invasive carcinomaFemale>=65III/IVChemotherapy5-fluorouracilSD
HERC5deletionFrame_Shift_Delnovelc.1335delNp.Asn446IlefsTer10p.N446Ifs*10Q9UII4protein_codingTCGA-EW-A2FV-01Breastbreast invasive carcinomaFemale<65III/IVChemotherapydocetaxelSD
HERC5SNVMissense_Mutationrs751293985c.3043N>Ap.Glu1015Lysp.E1015KQ9UII4protein_codingdeleterious(0.02)benign(0.065)TCGA-C5-A7CL-01Cervixcervical & endocervical cancerFemale<65III/IVChemotherapycisplatinPD
HERC5SNVMissense_Mutationrs766394501c.1571N>Tp.Ser524Leup.S524LQ9UII4protein_codingtolerated(0.24)benign(0.003)TCGA-EA-A3HS-01Cervixcervical & endocervical cancerFemale<65I/IIUnknownUnknownSD
HERC5SNVMissense_Mutationnovelc.1887C>Gp.Phe629Leup.F629LQ9UII4protein_codingtolerated(0.09)benign(0.052)TCGA-EA-A3HU-01Cervixcervical & endocervical cancerFemale<65I/IIUnknownUnknownSD
Page: 1 2 3 4 5 6 7 8 9 10 11 12 

Top

Related drugs of malignant transformation related genes

check buttonIdentification of chemicals and drugs interact with genes involved in malignant transfromation
(DGIdb 4.0)
Entrez IDSymbolCategoryInteraction TypesDrug Claim NameDrug NamePMIDs
Page: 1