Schematic overview of the cellular and molecular mechanisms involved in the cancer progression, including the proposed cellular and molecular mechanisms in cancer cells trajectory. AT1: alveolar type 1 cells; AT2: alveolar type 2 cells; AAH: atypical adenomatous hyperplasia; AIS: adenocarcinoma in situ; MIA: minimally invasive adenocarcinoma; IA: invasive adenocarcinoma; EMT: epithelial-mesenchymal transition

Home

Download

Statistics

Help

Contact

Center for Computational Systems Medicine
leaf

Gene summary

leaf

Malignant transformation analysis

leaf

Malignant transformation related pathway analysis

leaf

Cell-cell communication analysis

leaf

Single-cell gene regulatory network inference analysis

leaf

Somatic mutation of malignant transformation related genes

leaf

Related drugs of malignant transformation related genes

Gene: HERC4

Gene summary for HERC4

check button Gene summary.

Gene informationSpeciesHuman
Gene symbol

HERC4

Gene ID

26091

Gene nameHECT and RLD domain containing E3 ubiquitin protein ligase 4
Gene AliasHERC4
Cytomap10q21.3
Gene Typeprotein-coding
GO ID

GO:0000003

UniProtAcc

Q5GLZ8


Top

Malignant transformation analysis

check button Identification of the aberrant gene expression in precancerous and cancerous lesions by comparing the gene expression of stem-like cells in diseased tissues with normal stem cells
check button Malignant transformation involving gene list.
Entrez IDSymbolReplicatesSpeciesOrganTissueAdj P-valueLog2FCMalignancy
26091HERC4CCI_1HumanCervixCC2.81e-027.78e-010.528
26091HERC4CCI_2HumanCervixCC3.77e-121.46e+000.5249
26091HERC4CCI_3HumanCervixCC4.98e-035.54e-010.516
26091HERC4sample3HumanCervixCC7.36e-031.91e-010.1387
26091HERC4HTA11_3410_2000001011HumanColorectumAD6.46e-26-6.42e-010.0155
26091HERC4HTA11_347_2000001011HumanColorectumAD9.28e-044.56e-01-0.1954
26091HERC4HTA11_3361_2000001011HumanColorectumAD1.45e-06-5.19e-01-0.1207
26091HERC4HTA11_5212_2000001011HumanColorectumAD1.07e-03-5.58e-01-0.2061
26091HERC4HTA11_866_3004761011HumanColorectumAD9.39e-10-5.28e-010.096
26091HERC4HTA11_9408_2000001011HumanColorectumAD2.02e-02-7.52e-010.0451
26091HERC4HTA11_8622_2000001021HumanColorectumSER2.35e-02-4.81e-010.0528
26091HERC4HTA11_7696_3000711011HumanColorectumAD1.04e-11-4.21e-010.0674
26091HERC4HTA11_99999970781_79442HumanColorectumMSS1.49e-05-3.09e-010.294
26091HERC4HTA11_99999974143_84620HumanColorectumMSS3.01e-24-6.25e-010.3005
26091HERC4F007HumanColorectumFAP3.93e-03-2.42e-010.1176
26091HERC4A001-C-207HumanColorectumFAP3.64e-03-2.21e-010.1278
26091HERC4A015-C-203HumanColorectumFAP3.61e-34-6.42e-01-0.1294
26091HERC4A015-C-204HumanColorectumFAP8.21e-08-3.27e-01-0.0228
26091HERC4A014-C-040HumanColorectumFAP4.67e-09-5.74e-01-0.1184
26091HERC4A002-C-201HumanColorectumFAP2.60e-22-5.16e-010.0324
Page: 1 2 3 4 5 6 7 8 9 10 11 

check button Transcriptomic changes along malignancy continuum.
TissueExpression DynamicsAbbreviation
CervixThe image shows the transcriptomic changes along malignancy continuum.log2FC in expression of this searched gene in stem-like cells from each diseased tissue sample relative to stem-like cells in normal samples in each tissue plotted against the malignancy continuum. Samples are colored based on if they are from different disease stage.CC: Cervix cancer
HSIL_HPV: HPV-infected high-grade squamous intraepithelial lesions
N_HPV: HPV-infected normal cervix
Colorectum (GSE201348)The image shows the transcriptomic changes along malignancy continuum.log2FC in expression of this searched gene in stem-like cells from each diseased tissue sample relative to stem-like cells in normal samples in each tissue plotted against the malignancy continuum. Samples are colored based on if they are from different disease stage.FAP: Familial adenomatous polyposis
CRC: Colorectal cancer
Colorectum (HTA11)The image shows the transcriptomic changes along malignancy continuum.log2FC in expression of this searched gene in stem-like cells from each diseased tissue sample relative to stem-like cells in normal samples in each tissue plotted against the malignancy continuum. Samples are colored based on if they are from different disease stage.AD: Adenomas
SER: Sessile serrated lesions
MSI-H: Microsatellite-high colorectal cancer
MSS: Microsatellite stable colorectal cancer
EndometriumThe image shows the transcriptomic changes along malignancy continuum.log2FC in expression of this searched gene in stem-like cells from each diseased tissue sample relative to stem-like cells in normal samples in each tissue plotted against the malignancy continuum. Samples are colored based on if they are from different disease stage.
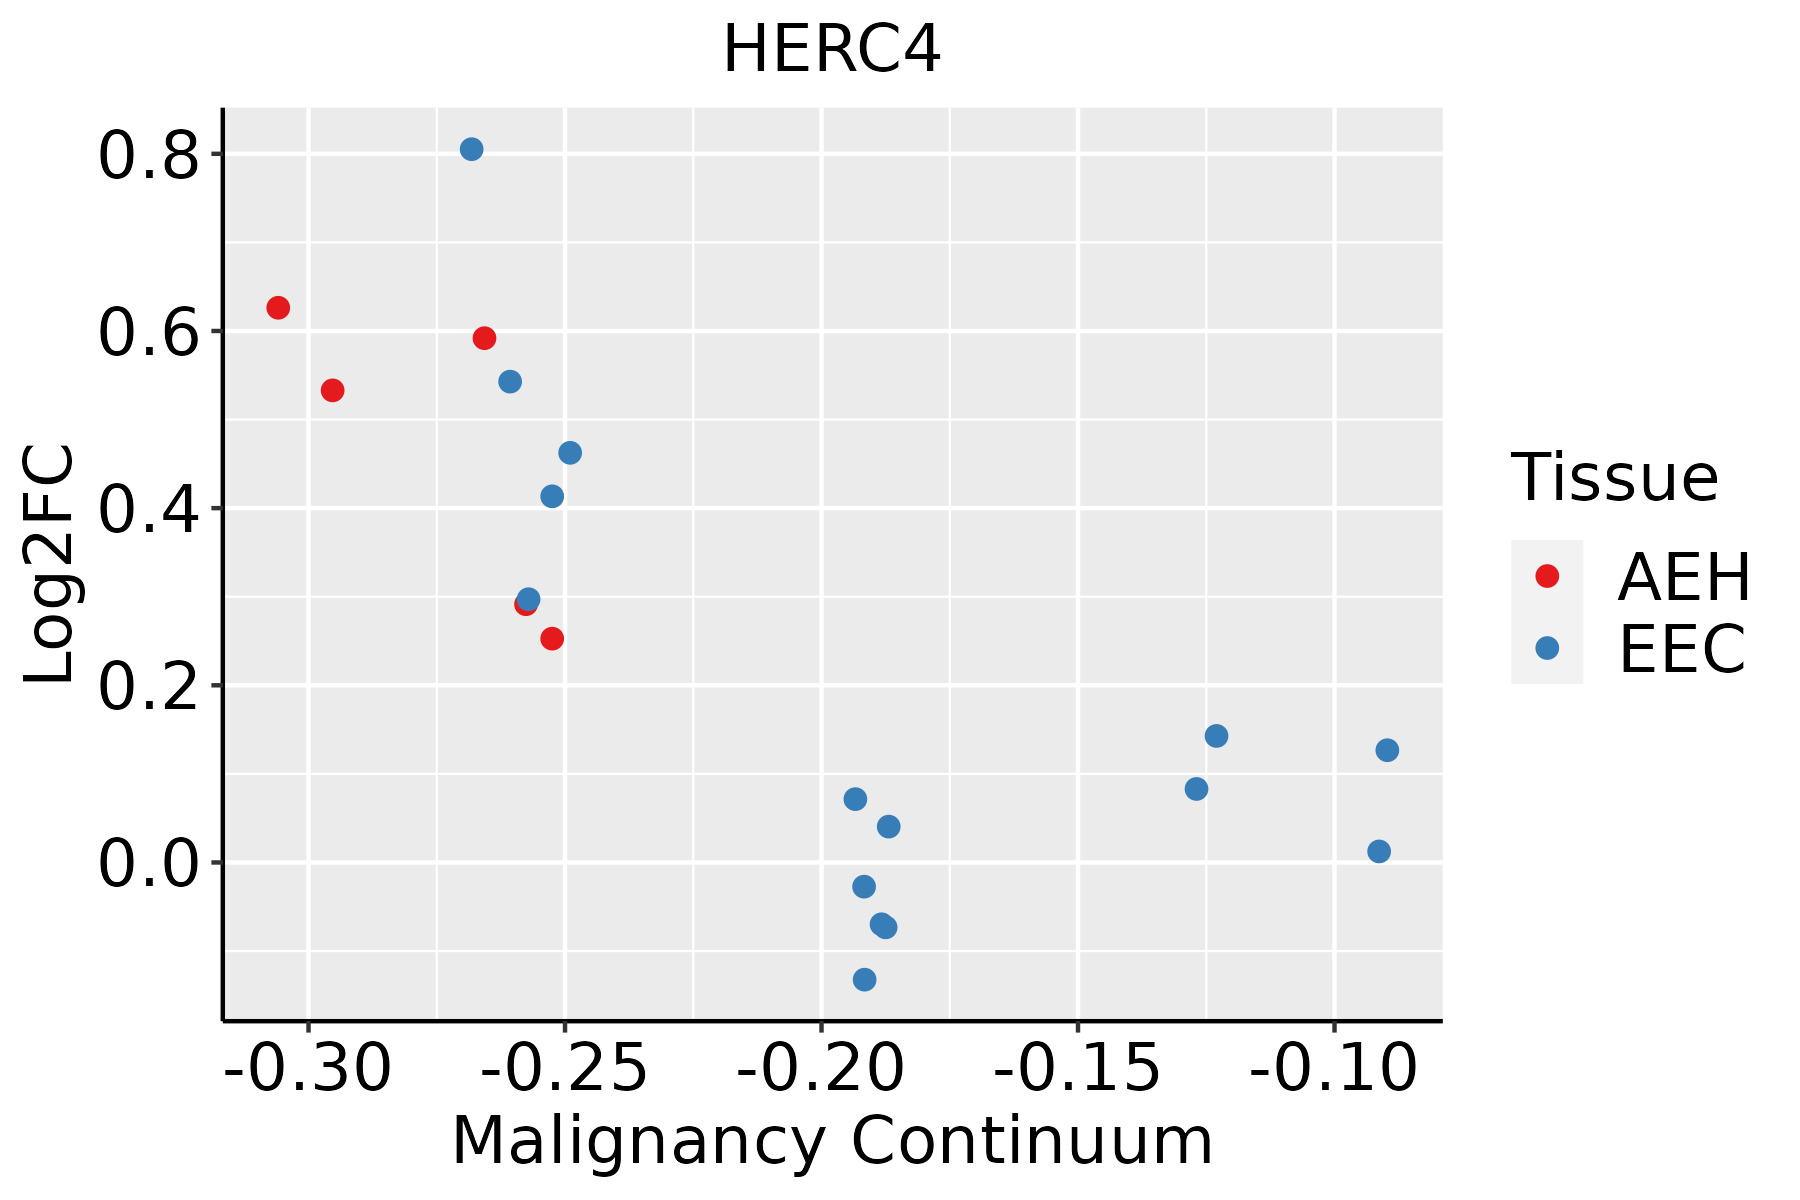
AEH: Atypical endometrial hyperplasia
EEC: Endometrioid Cancer
EsophagusThe image shows the transcriptomic changes along malignancy continuum.log2FC in expression of this searched gene in stem-like cells from each diseased tissue sample relative to stem-like cells in normal samples in each tissue plotted against the malignancy continuum. Samples are colored based on if they are from different disease stage.
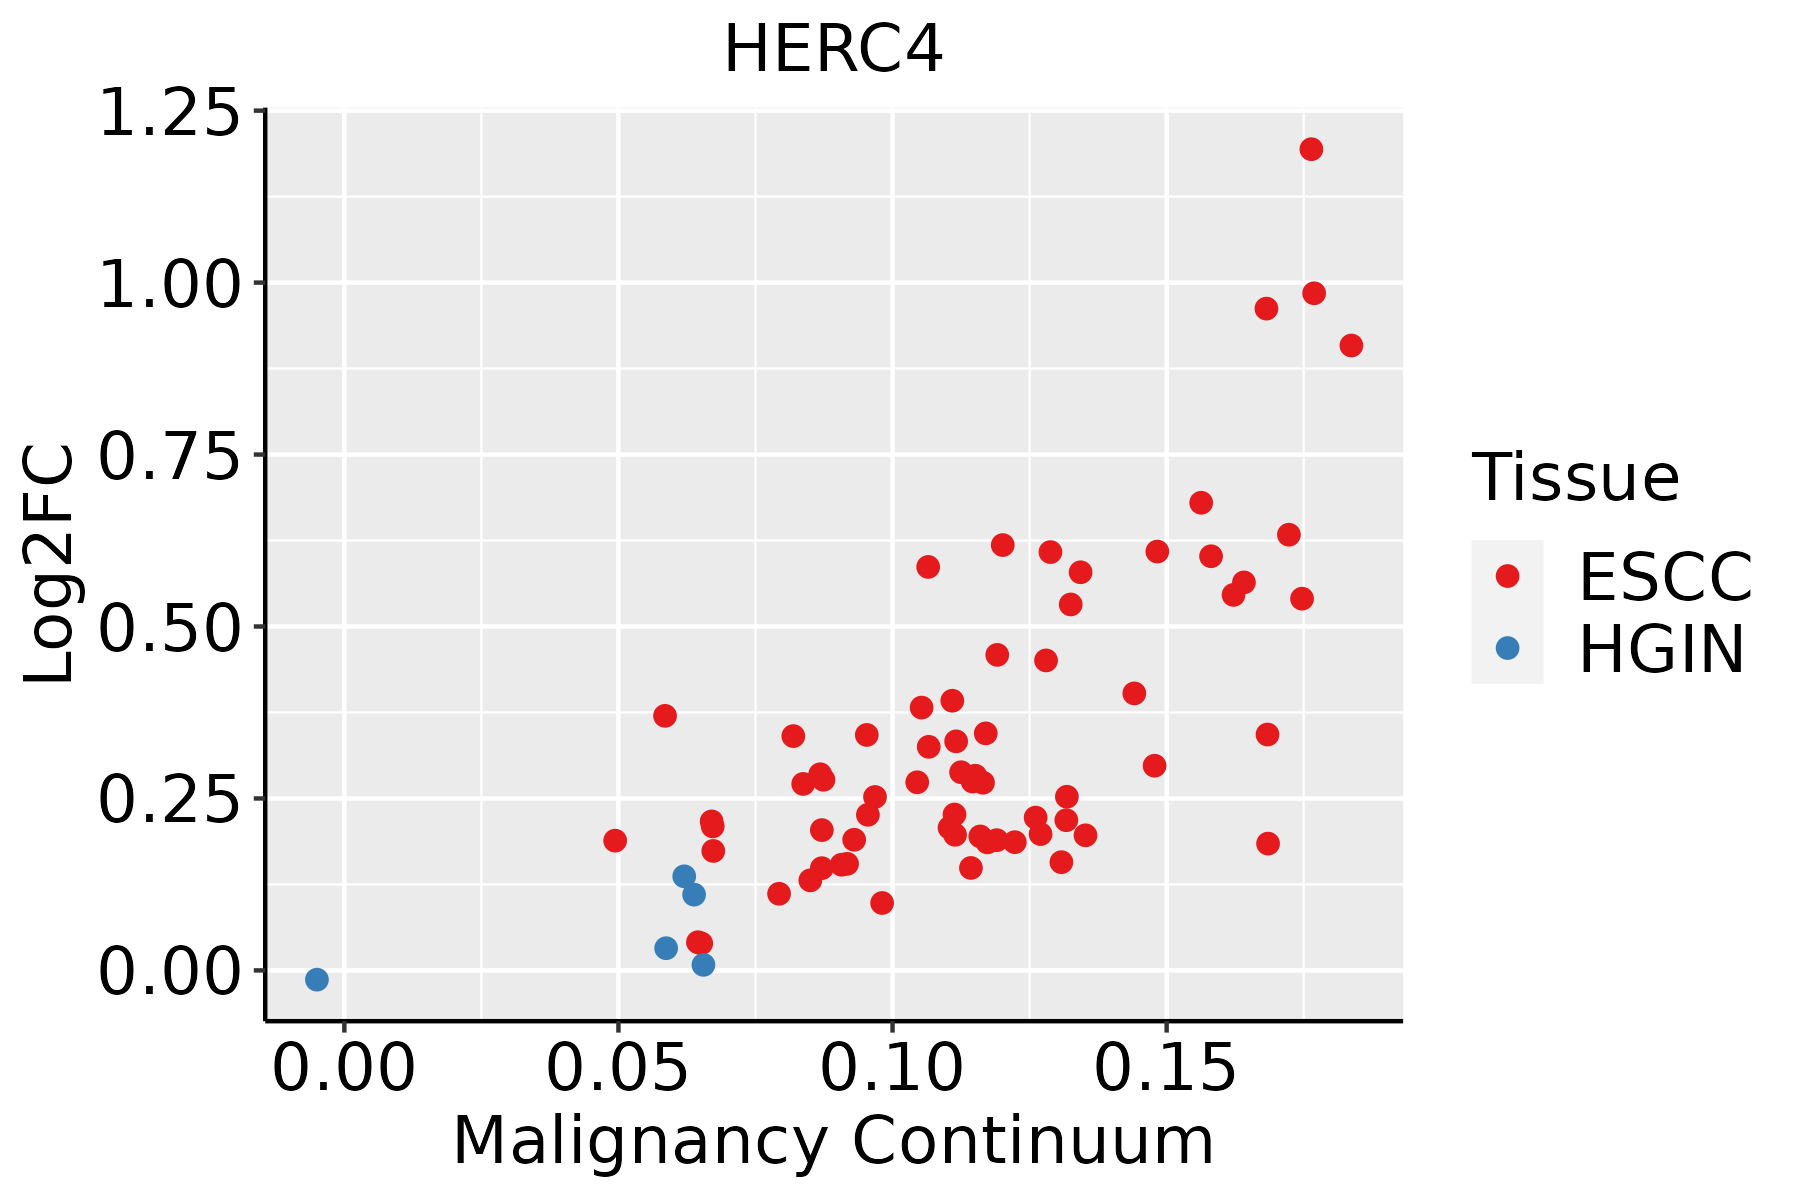
ESCC: Esophageal squamous cell carcinoma
HGIN: High-grade intraepithelial neoplasias
LGIN: Low-grade intraepithelial neoplasias
GCThe image shows the transcriptomic changes along malignancy continuum.log2FC in expression of this searched gene in stem-like cells from each diseased tissue sample relative to stem-like cells in normal samples in each tissue plotted against the malignancy continuum. Samples are colored based on if they are from different disease stage.
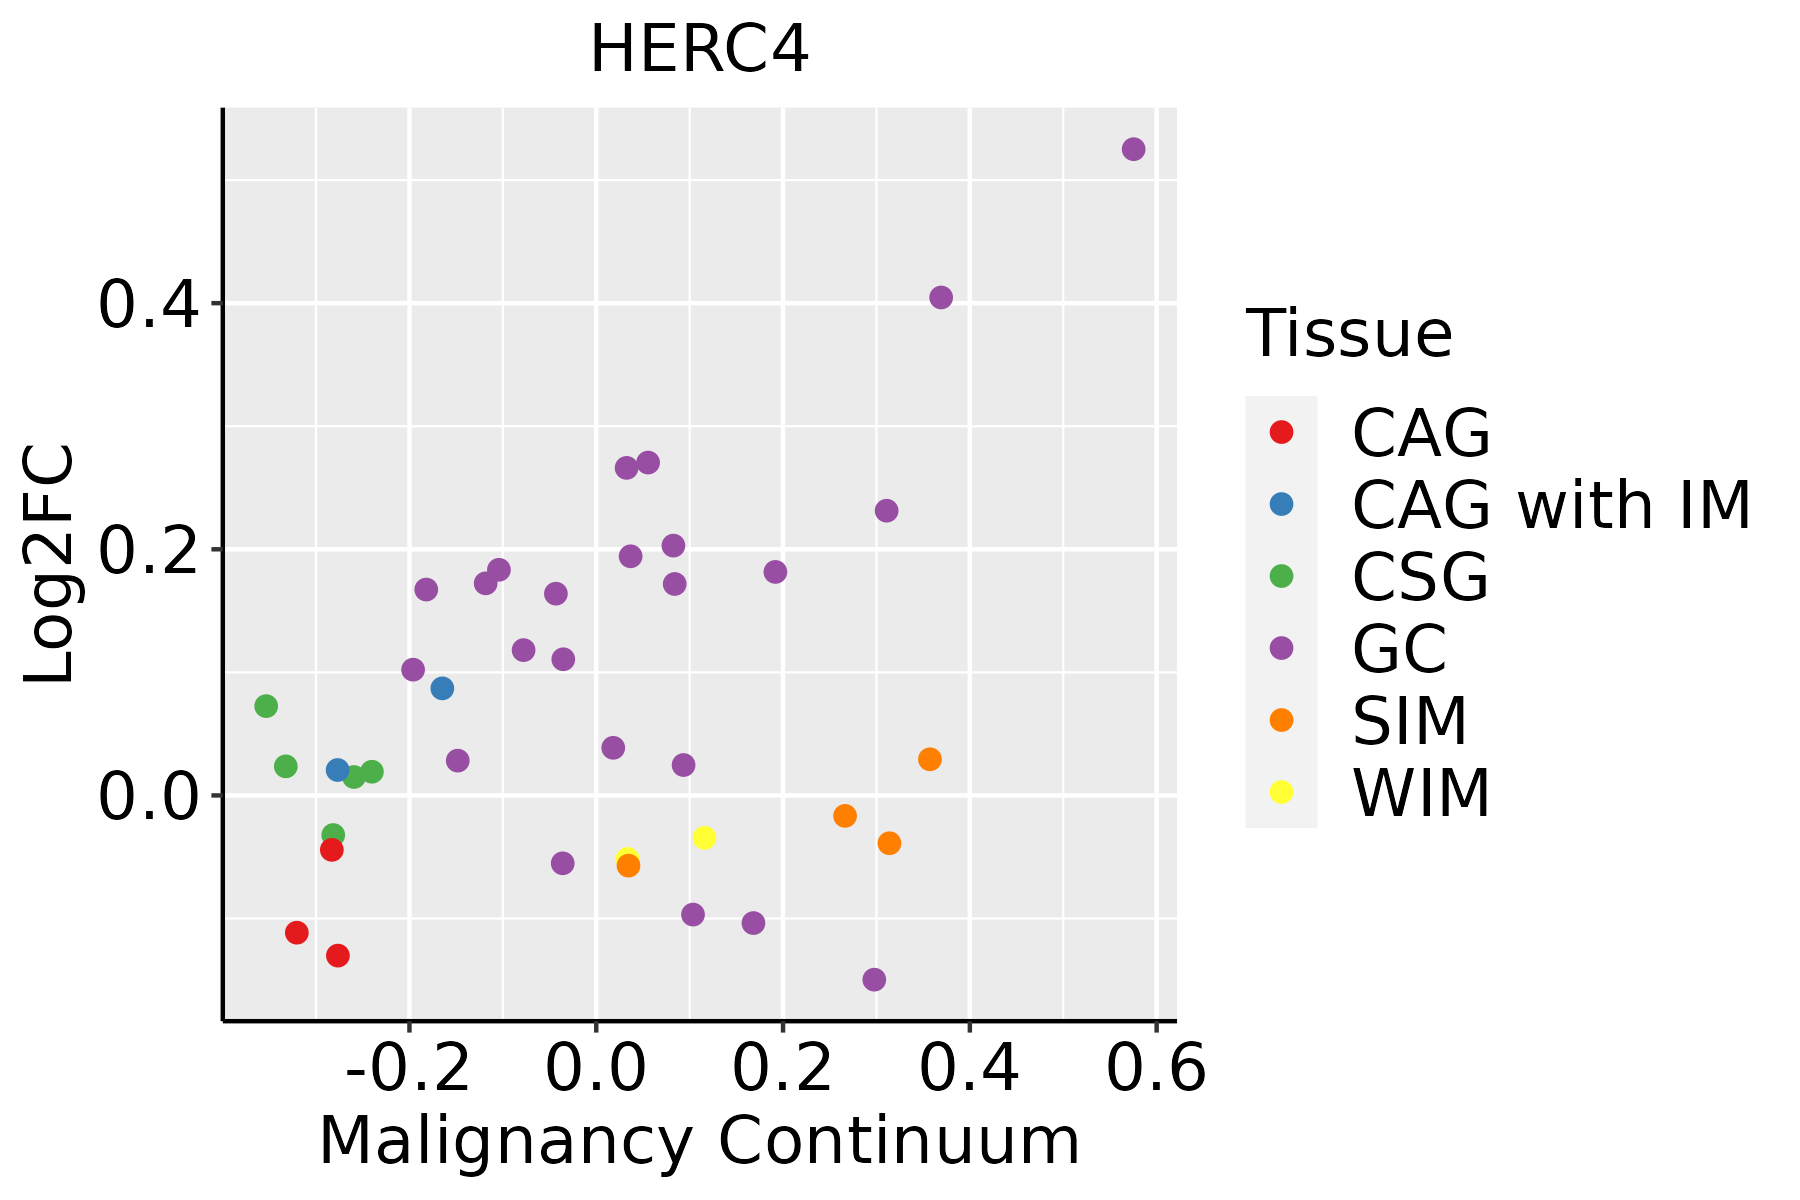
CAG: Chronic atrophic gastritis
CAG with IM: Chronic atrophic gastritis with intestinal metaplasia
CSG: Chronic superficial gastritis
GC: Gastric cancer
SIM: Severe intestinal metaplasia
WIM: Wild intestinal metaplasia
LiverThe image shows the transcriptomic changes along malignancy continuum.log2FC in expression of this searched gene in stem-like cells from each diseased tissue sample relative to stem-like cells in normal samples in each tissue plotted against the malignancy continuum. Samples are colored based on if they are from different disease stage.
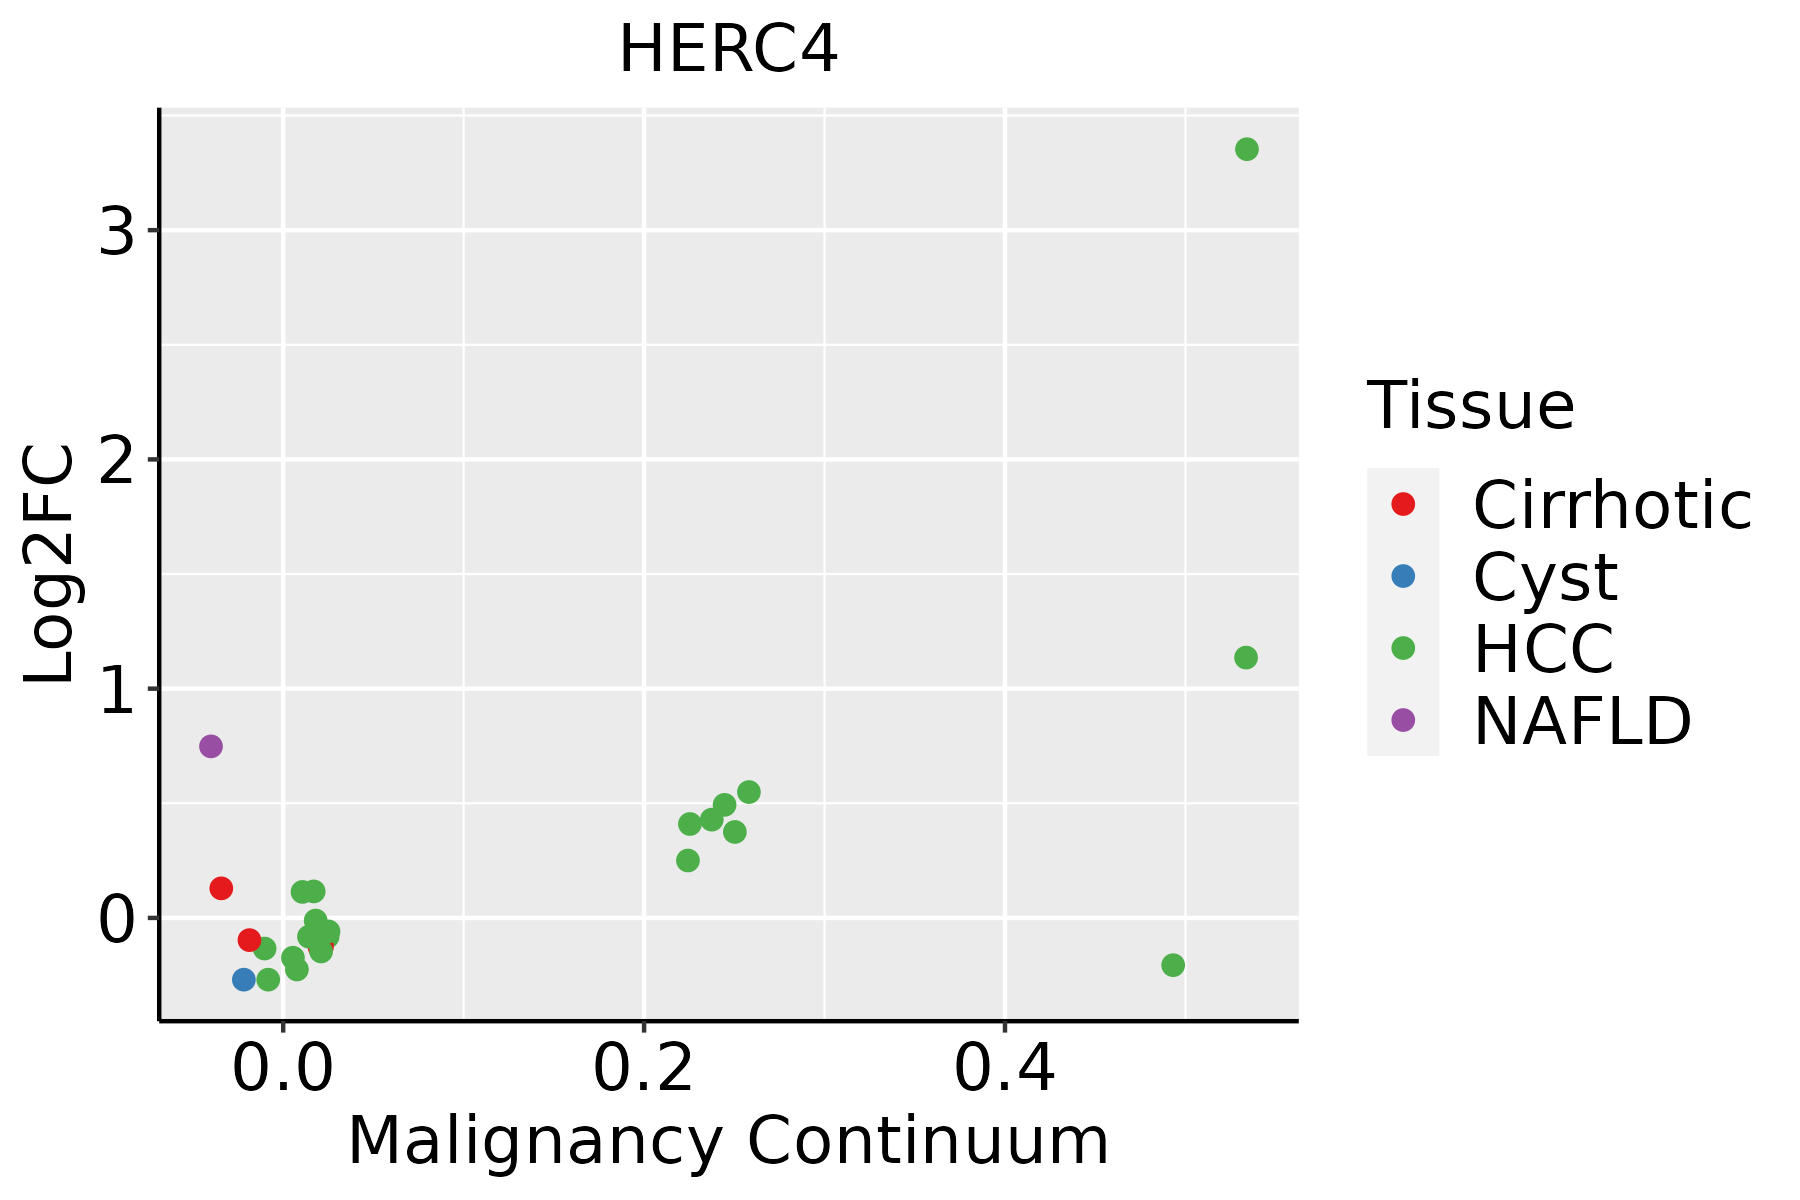
HCC: Hepatocellular carcinoma
NAFLD: Non-alcoholic fatty liver disease
LungThe image shows the transcriptomic changes along malignancy continuum.log2FC in expression of this searched gene in stem-like cells from each diseased tissue sample relative to stem-like cells in normal samples in each tissue plotted against the malignancy continuum. Samples are colored based on if they are from different disease stage.
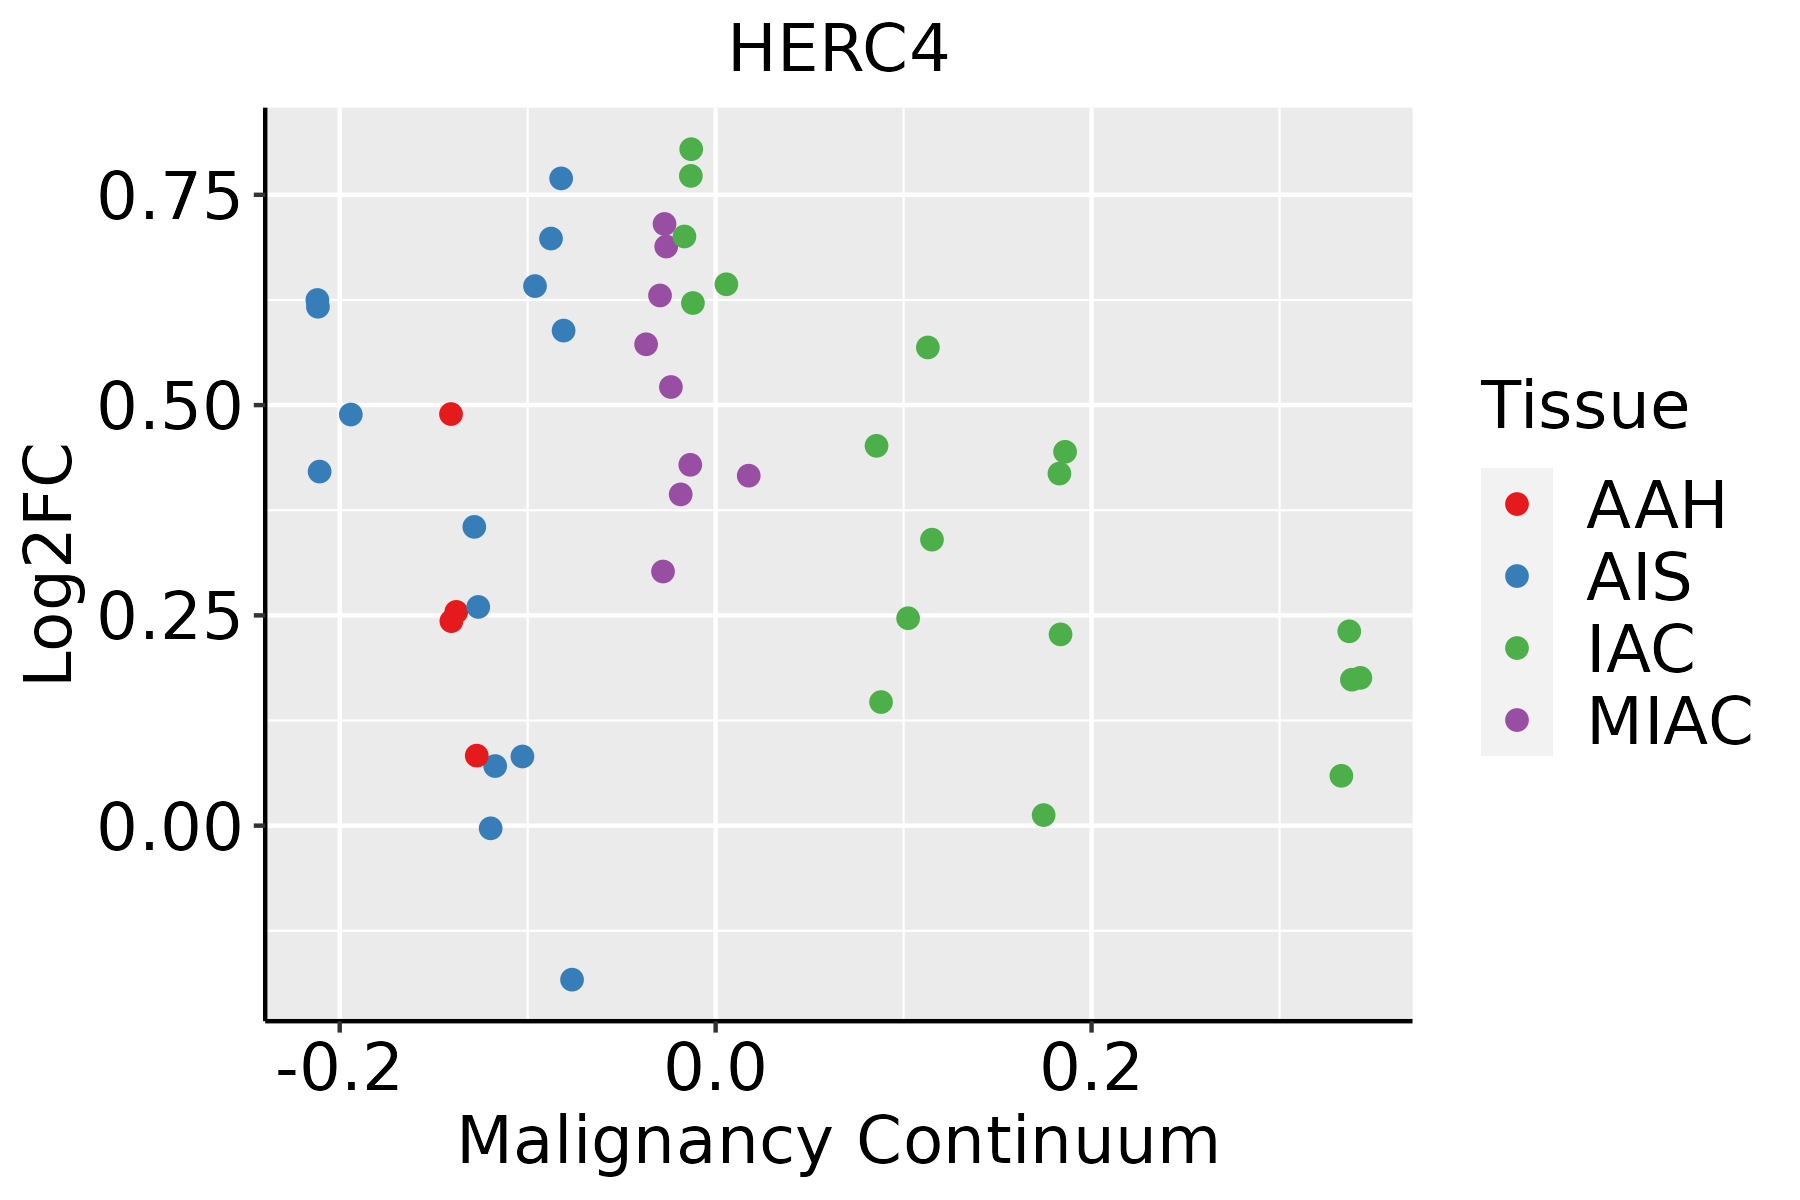
AAH: Atypical adenomatous hyperplasia
AIS: Adenocarcinoma in situ
IAC: Invasive lung adenocarcinoma
MIA: Minimally invasive adenocarcinoma
Oral CavityThe image shows the transcriptomic changes along malignancy continuum.log2FC in expression of this searched gene in stem-like cells from each diseased tissue sample relative to stem-like cells in normal samples in each tissue plotted against the malignancy continuum. Samples are colored based on if they are from different disease stage.EOLP: Erosive Oral lichen planus
LP: leukoplakia
NEOLP: Non-erosive oral lichen planus
OSCC: Oral squamous cell carcinoma
ProstateThe image shows the transcriptomic changes along malignancy continuum.log2FC in expression of this searched gene in stem-like cells from each diseased tissue sample relative to stem-like cells in normal samples in each tissue plotted against the malignancy continuum. Samples are colored based on if they are from different disease stage.
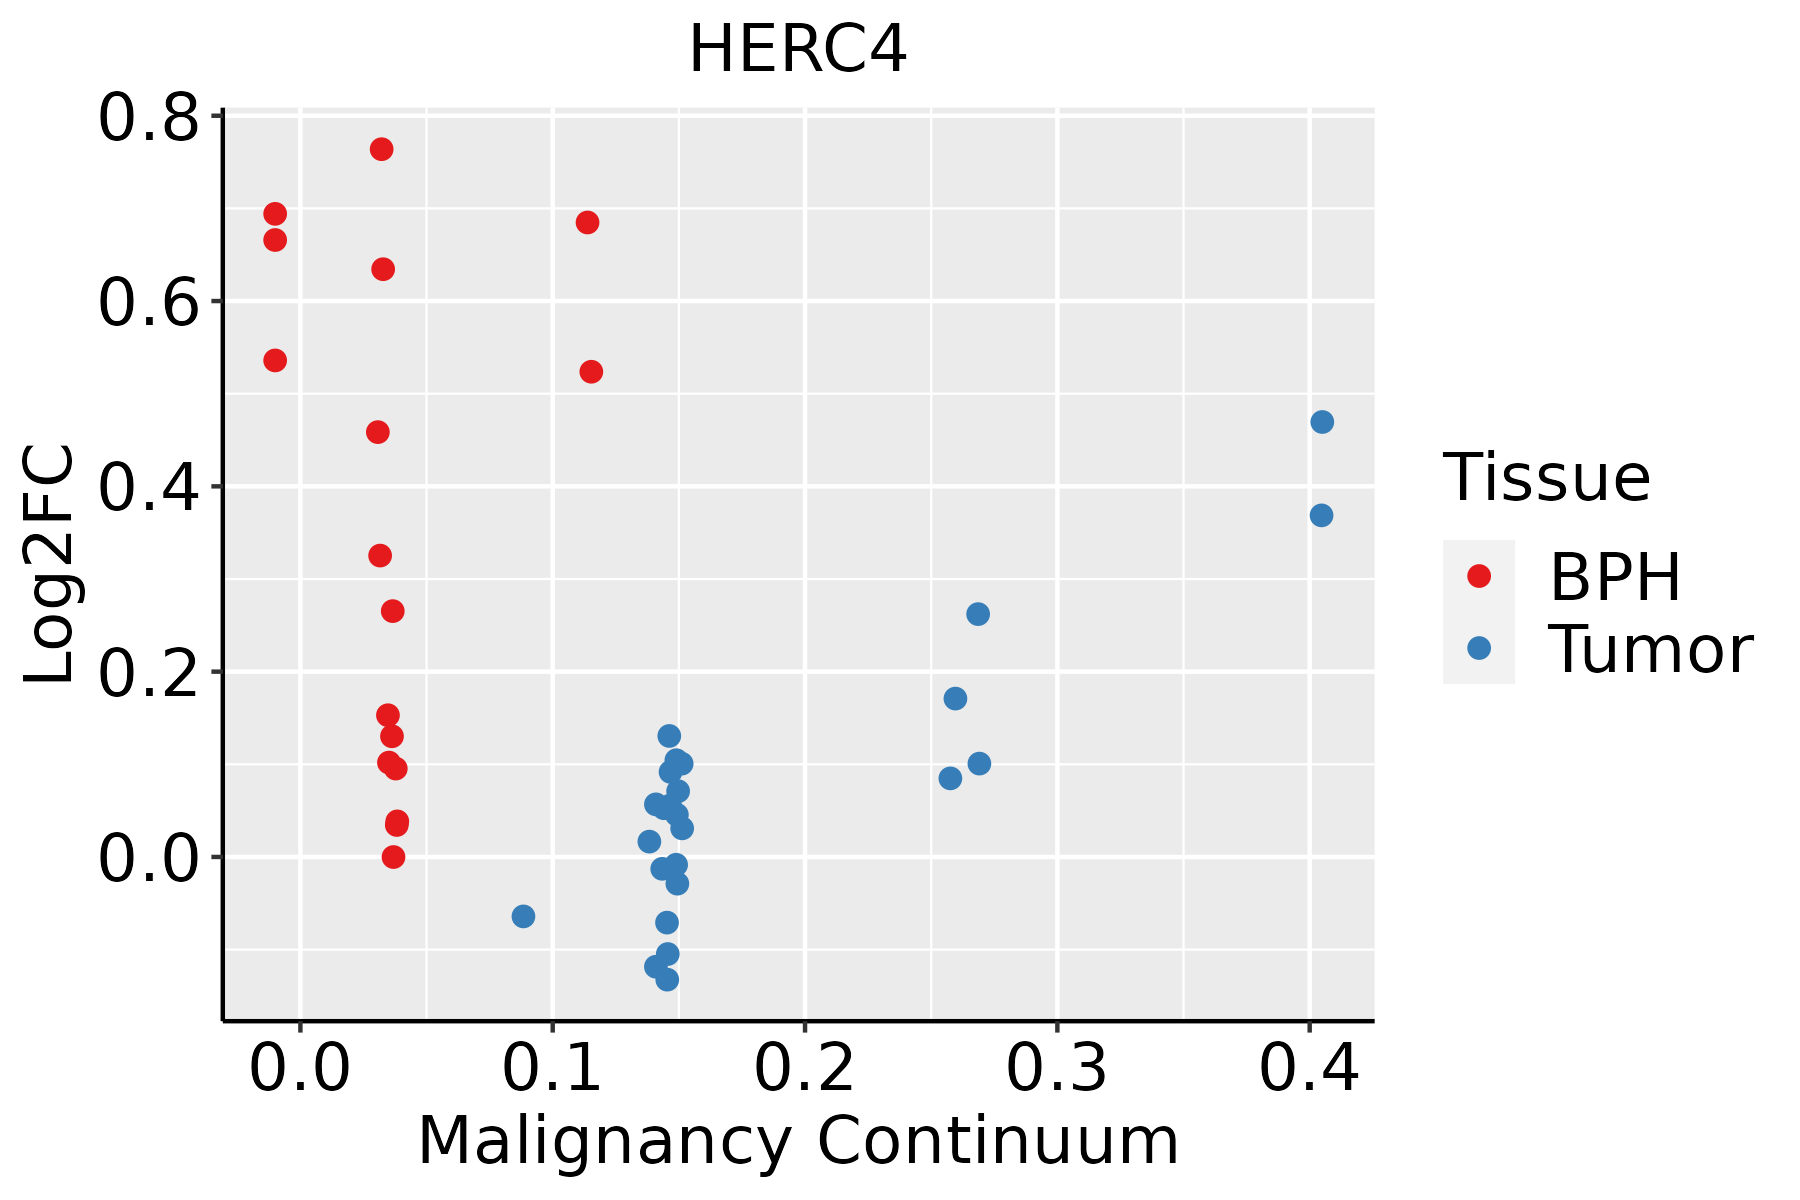
BPH: Benign Prostatic Hyperplasia
SkinThe image shows the transcriptomic changes along malignancy continuum.log2FC in expression of this searched gene in stem-like cells from each diseased tissue sample relative to stem-like cells in normal samples in each tissue plotted against the malignancy continuum. Samples are colored based on if they are from different disease stage.AK: Actinic keratosis
cSCC: Cutaneous squamous cell carcinoma
SCCIS:squamous cell carcinoma in situ
ThyroidThe image shows the transcriptomic changes along malignancy continuum.log2FC in expression of this searched gene in stem-like cells from each diseased tissue sample relative to stem-like cells in normal samples in each tissue plotted against the malignancy continuum. Samples are colored based on if they are from different disease stage.
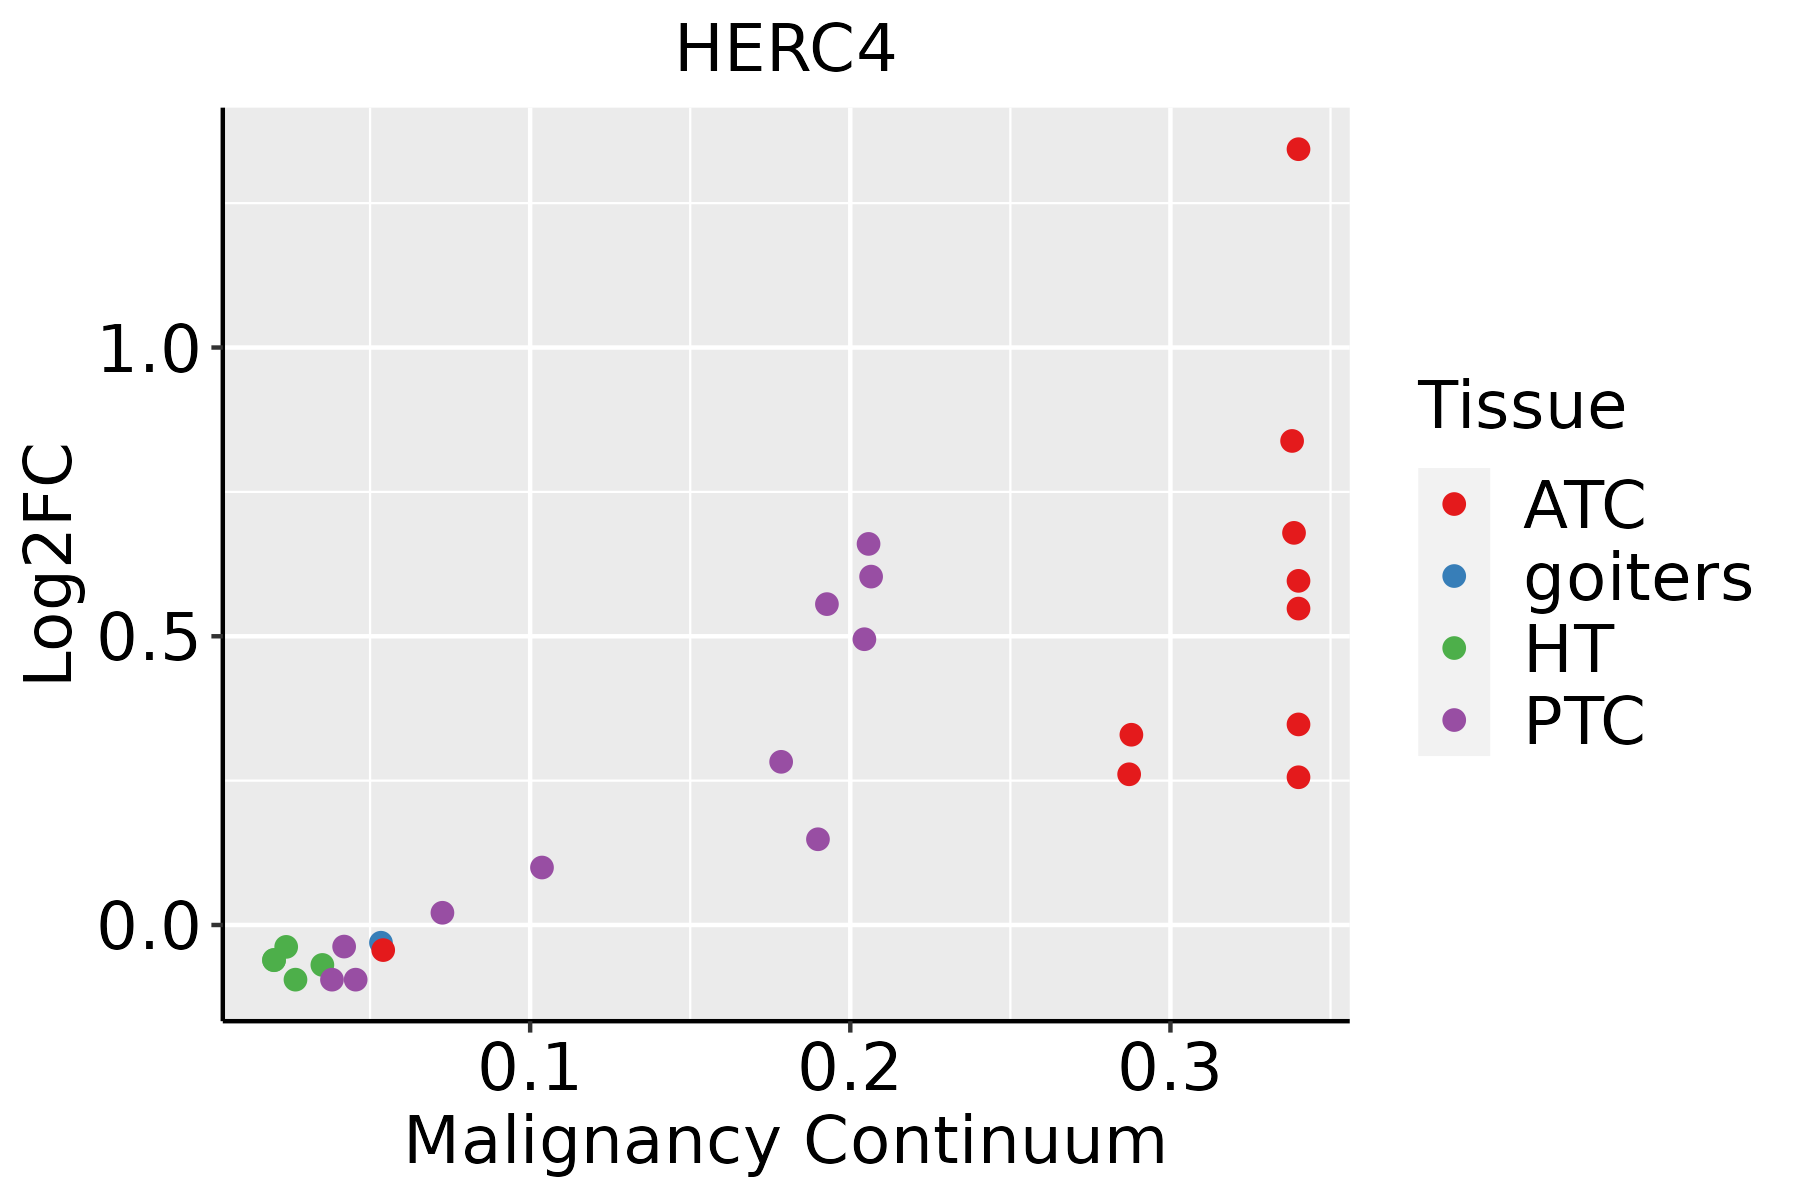
ATC: Anaplastic thyroid cancer
HT: Hashimoto's thyroiditis
PTC: Papillary thyroid cancer
∗log2FC in expression of this searched gene in stem-like cells from each diseased tissue sample relative to stem-like cells in normal samples in each tissue plotted against the malignancy continuum. Samples are colored based on if they are from different disease stage.

Top

Malignant transformation related pathway analysis

check buttonFind out the enriched GO biological processes and KEGG pathways involved in transition from healthy to precancer to cancer
check button Figure of enriched GO biological processes.
TissueDisease StageEnriched GO biological Processes
ColorectumADGO analysis - Figure of enriched GO biological processes: Top 15 enriched GO BP terms are showed in the bar plot of each disease state in each tissue. Each row represents a significant GO biological process which is colored according to the -log10(p.adjust).
ColorectumSERGO analysis - Figure of enriched GO biological processes: Top 15 enriched GO BP terms are showed in the bar plot of each disease state in each tissue. Each row represents a significant GO biological process which is colored according to the -log10(p.adjust).
ColorectumMSSGO analysis - Figure of enriched GO biological processes: Top 15 enriched GO BP terms are showed in the bar plot of each disease state in each tissue. Each row represents a significant GO biological process which is colored according to the -log10(p.adjust).
ColorectumMSI-HGO analysis - Figure of enriched GO biological processes: Top 15 enriched GO BP terms are showed in the bar plot of each disease state in each tissue. Each row represents a significant GO biological process which is colored according to the -log10(p.adjust).
ColorectumFAPGO analysis - Figure of enriched GO biological processes: Top 15 enriched GO BP terms are showed in the bar plot of each disease state in each tissue. Each row represents a significant GO biological process which is colored according to the -log10(p.adjust).
∗Top 15 enriched GO BP terms are showed in the bar plot of each disease state in each tissue. Each row represents a significant GO biological process which is colored according to the -log10(p.adjust).
Page: 1 2 3 4 5 6 7 8 9 

check button Enriched GO biological processes.
GO IDTissueDisease StageDescriptionGene RatioBg Ratiopvaluep.adjustCount
GO:0045879ThyroidPTCnegative regulation of smoothened signaling pathway17/596832/187231.02e-024.11e-0217
GO:00458791ThyroidATCnegative regulation of smoothened signaling pathway20/629332/187237.67e-044.24e-0320
GO:0008589ThyroidATCregulation of smoothened signaling pathway40/629381/187232.36e-031.10e-0240
GO:0007224ThyroidATCsmoothened signaling pathway60/6293138/187239.75e-033.57e-0260
Page: 1 

check button Enriched KEGG pathways.
Pathway IDTissueDisease StageDescriptionGene RatioBg Ratiopvaluep.adjustqvalueCount
hsa0412014CervixCCUbiquitin mediated proteolysis49/1267142/84654.26e-097.68e-084.54e-0849
hsa0412015CervixCCUbiquitin mediated proteolysis49/1267142/84654.26e-097.68e-084.54e-0849
hsa04120ColorectumADUbiquitin mediated proteolysis58/2092142/84651.46e-051.53e-049.76e-0558
hsa041201ColorectumADUbiquitin mediated proteolysis58/2092142/84651.46e-051.53e-049.76e-0558
hsa041202ColorectumSERUbiquitin mediated proteolysis39/1580142/84656.18e-033.66e-022.66e-0239
hsa041203ColorectumSERUbiquitin mediated proteolysis39/1580142/84656.18e-033.66e-022.66e-0239
hsa041204ColorectumMSSUbiquitin mediated proteolysis55/1875142/84655.02e-066.00e-053.68e-0555
hsa041205ColorectumMSSUbiquitin mediated proteolysis55/1875142/84655.02e-066.00e-053.68e-0555
hsa041206ColorectumFAPUbiquitin mediated proteolysis51/1404142/84651.55e-085.84e-073.55e-0751
hsa041207ColorectumFAPUbiquitin mediated proteolysis51/1404142/84651.55e-085.84e-073.55e-0751
hsa041208ColorectumCRCUbiquitin mediated proteolysis42/1091142/84659.98e-086.67e-064.52e-0642
hsa041209ColorectumCRCUbiquitin mediated proteolysis42/1091142/84659.98e-086.67e-064.52e-0642
hsa0412016EndometriumAEHUbiquitin mediated proteolysis41/1197142/84653.42e-064.27e-053.13e-0541
hsa0412017EndometriumAEHUbiquitin mediated proteolysis41/1197142/84653.42e-064.27e-053.13e-0541
hsa0412023EndometriumEECUbiquitin mediated proteolysis41/1237142/84657.86e-069.58e-057.14e-0541
hsa0412033EndometriumEECUbiquitin mediated proteolysis41/1237142/84657.86e-069.58e-057.14e-0541
hsa0412027EsophagusESCCUbiquitin mediated proteolysis122/4205142/84656.53e-207.29e-183.74e-18122
hsa0412036EsophagusESCCUbiquitin mediated proteolysis122/4205142/84656.53e-207.29e-183.74e-18122
hsa0412010LiverNAFLDUbiquitin mediated proteolysis44/1043142/84652.59e-091.70e-071.37e-0744
hsa0412011LiverNAFLDUbiquitin mediated proteolysis44/1043142/84652.59e-091.70e-071.37e-0744
Page: 1 2 

Top

Cell-cell communication analysis

check buttonIdentification of potential cell-cell interactions between two cell types and their ligand-receptor pairs for different disease states
LigandReceptorLRpairPathwayTissueDisease Stage
Page: 1 

Top

Single-cell gene regulatory network inference analysis

check buttonFind out the significant the regulons (TFs) and the target genes of each regulon across cell types for different disease states
TFCell TypeTissueDisease StageTarget GeneRSSRegulon Activity
∗The dot plots of a searched regulon are shown for all cell subpopulations in each disease state of each tissue based on the regulon specific score inferred using pySCENIC and by calculating the average expression.
Page: 1 

Top

Somatic mutation of malignant transformation related genes

check buttonAnnotation of somatic variants for genes involved in malignant transformation
Hugo SymbolVariant ClassVariant ClassificationdbSNP RSHGVScHGVSpHGVSp ShortSWISSPROTBIOTYPESIFTPolyPhenTumor Sample BarcodeTissueHistologySexAgeStageTherapy TypesDrugsOutcome
HERC4SNVMissense_Mutationc.944N>Ap.Arg315Glnp.R315QQ5GLZ8protein_codingtolerated(0.09)possibly_damaging(0.716)TCGA-AN-A046-01Breastbreast invasive carcinomaFemale>=65I/IIUnknownUnknownSD
HERC4SNVMissense_Mutationnovelc.467G>Cp.Ser156Thrp.S156TQ5GLZ8protein_codingdeleterious(0)possibly_damaging(0.646)TCGA-BH-A0EE-01Breastbreast invasive carcinomaFemale>=65I/IIChemotherapydocetaxelSD
HERC4SNVMissense_Mutationc.2440N>Tp.Leu814Phep.L814FQ5GLZ8protein_codingdeleterious(0)probably_damaging(0.998)TCGA-BH-A0HF-01Breastbreast invasive carcinomaFemale>=65I/IIHormone TherapyarimidexSD
HERC4SNVMissense_Mutationc.1423C>Tp.His475Tyrp.H475YQ5GLZ8protein_codingtolerated(0.2)benign(0.211)TCGA-C8-A1HM-01Breastbreast invasive carcinomaFemale>=65I/IIChemotherapydoxorubicinCR
HERC4insertionNonsense_Mutationnovelc.952_953insGATCATGTCATGCATTGTCTTATATCp.Ser318Terp.S318*Q5GLZ8protein_codingTCGA-BH-A0B1-01Breastbreast invasive carcinomaFemale>=65I/IIChemotherapyadriamycinSD
HERC4deletionFrame_Shift_Delnovelc.2265delAp.Glu756AsnfsTer7p.E756Nfs*7Q5GLZ8protein_codingTCGA-D8-A27V-01Breastbreast invasive carcinomaFemale<65I/IIHormone TherapytamoxiphenSD
HERC4SNVMissense_Mutationrs751824179c.2260C>Tp.Arg754Cysp.R754CQ5GLZ8protein_codingdeleterious(0)probably_damaging(0.972)TCGA-2W-A8YY-01Cervixcervical & endocervical cancerFemale<65I/IIChemotherapycisplatinCR
HERC4SNVMissense_Mutationc.1674N>Tp.Lys558Asnp.K558NQ5GLZ8protein_codingdeleterious(0.03)benign(0.25)TCGA-FU-A3HZ-01Cervixcervical & endocervical cancerFemale<65I/IIChemotherapycisplatinCR
HERC4SNVMissense_Mutationc.647N>Ap.Arg216Hisp.R216HQ5GLZ8protein_codingdeleterious(0.01)probably_damaging(0.969)TCGA-A6-2672-01Colorectumcolon adenocarcinomaFemale>=65III/IVUnknownUnknownSD
HERC4SNVMissense_Mutationc.2362N>Gp.Thr788Alap.T788AQ5GLZ8protein_codingtolerated(0.1)possibly_damaging(0.688)TCGA-AA-3811-01Colorectumcolon adenocarcinomaFemale>=65III/IVUnknownUnknownPD
Page: 1 2 3 4 5 6 7 8 9 10 

Top

Related drugs of malignant transformation related genes

check buttonIdentification of chemicals and drugs interact with genes involved in malignant transfromation
(DGIdb 4.0)
Entrez IDSymbolCategoryInteraction TypesDrug Claim NameDrug NamePMIDs
Page: 1