| Tissue | Expression Dynamics | Abbreviation |
| Cervix | 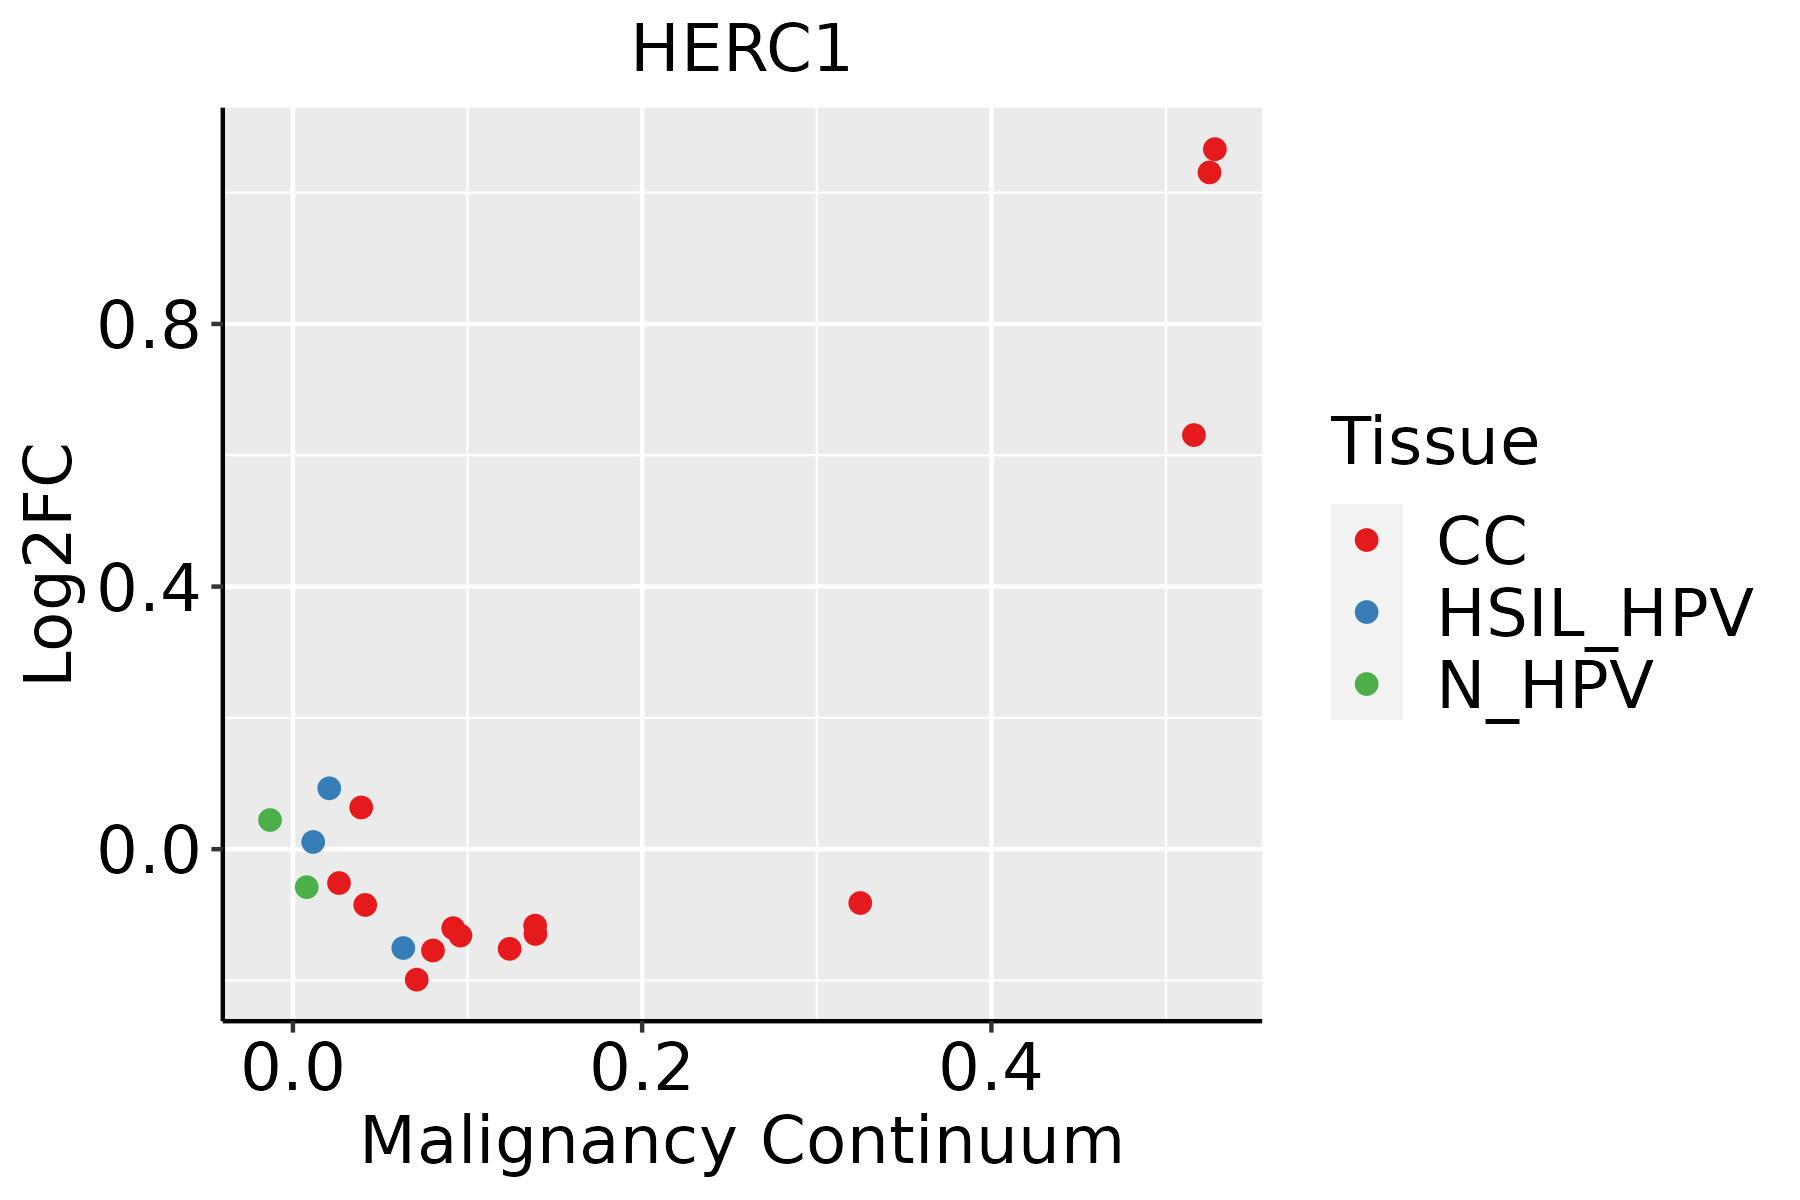 | CC: Cervix cancer |
| HSIL_HPV: HPV-infected high-grade squamous intraepithelial lesions |
| N_HPV: HPV-infected normal cervix |
| Colorectum (GSE201348) |  | FAP: Familial adenomatous polyposis |
| CRC: Colorectal cancer |
| Colorectum (HTA11) |  | AD: Adenomas |
| SER: Sessile serrated lesions |
| MSI-H: Microsatellite-high colorectal cancer |
| MSS: Microsatellite stable colorectal cancer |
| Esophagus | 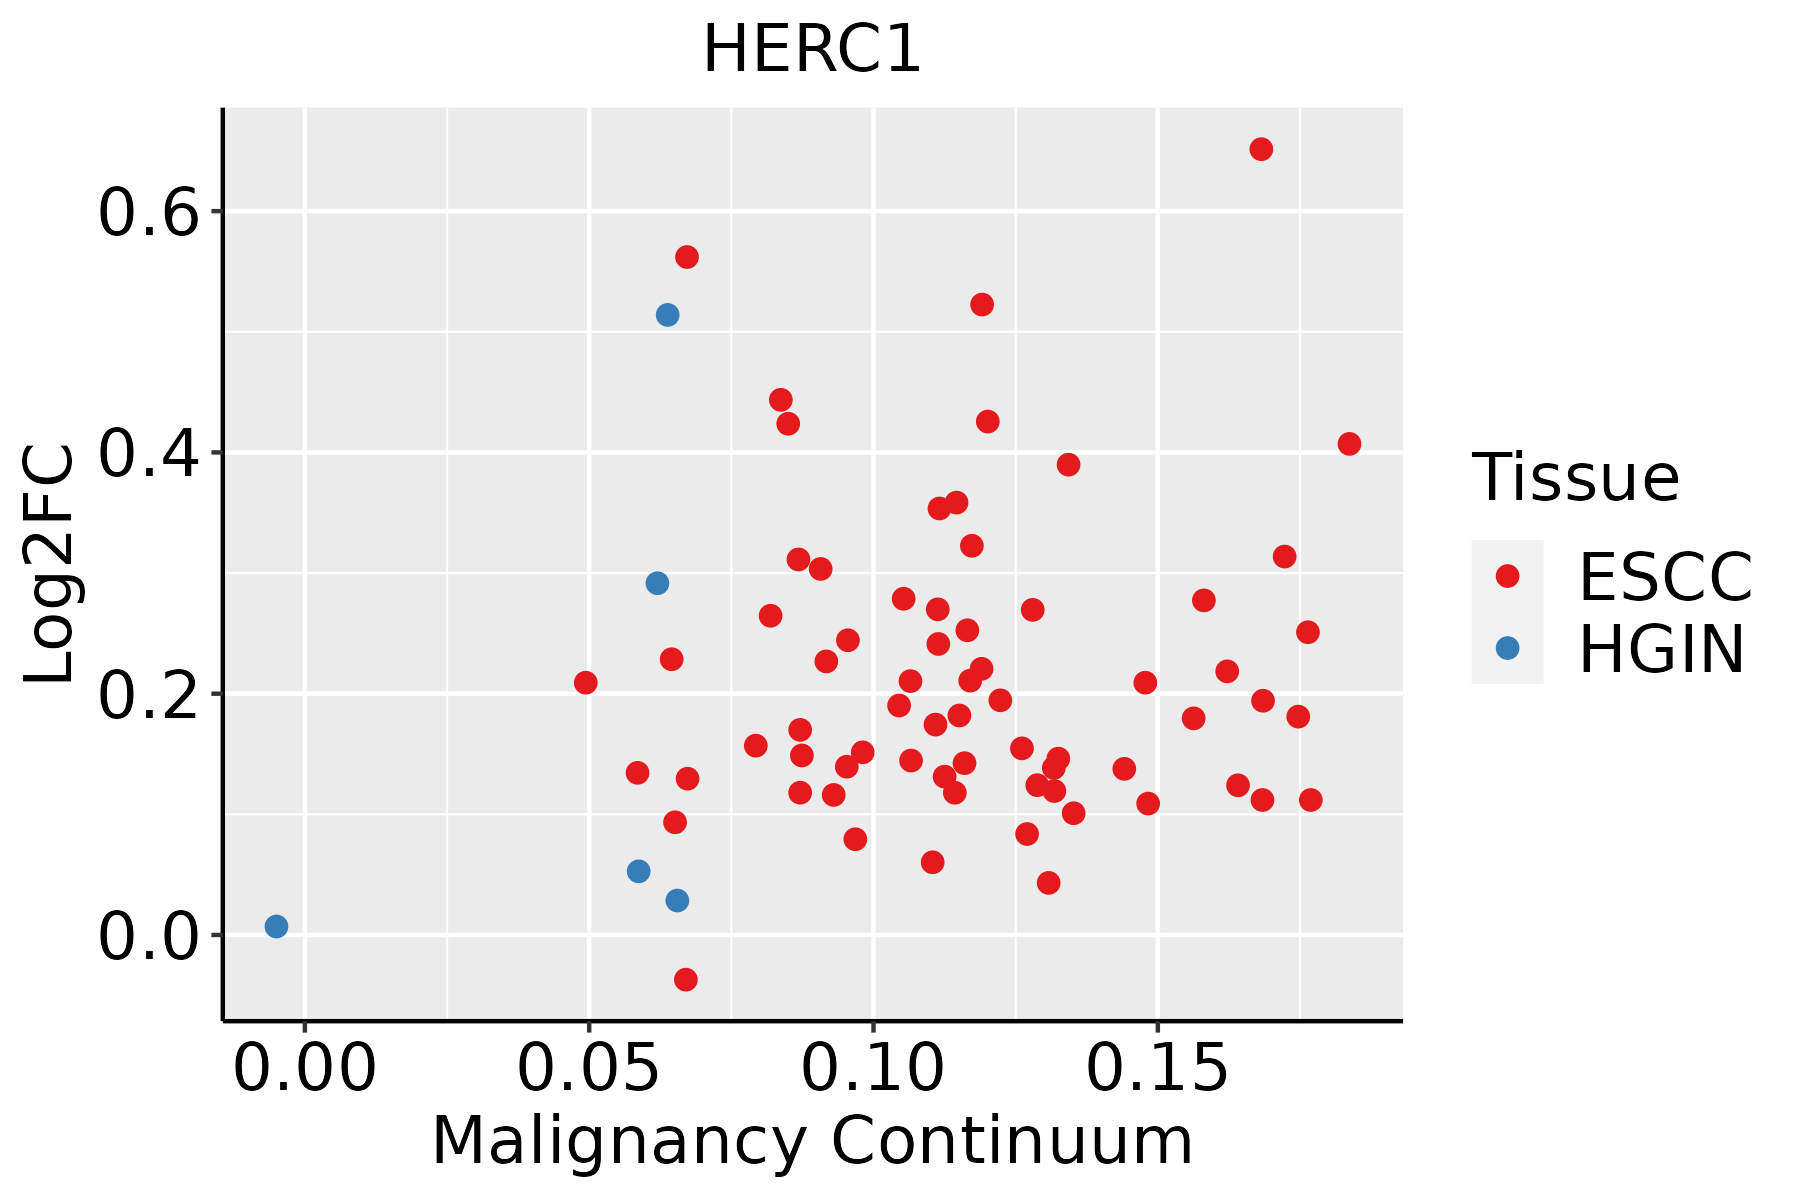 | ESCC: Esophageal squamous cell carcinoma |
| HGIN: High-grade intraepithelial neoplasias |
| LGIN: Low-grade intraepithelial neoplasias |
| Liver | 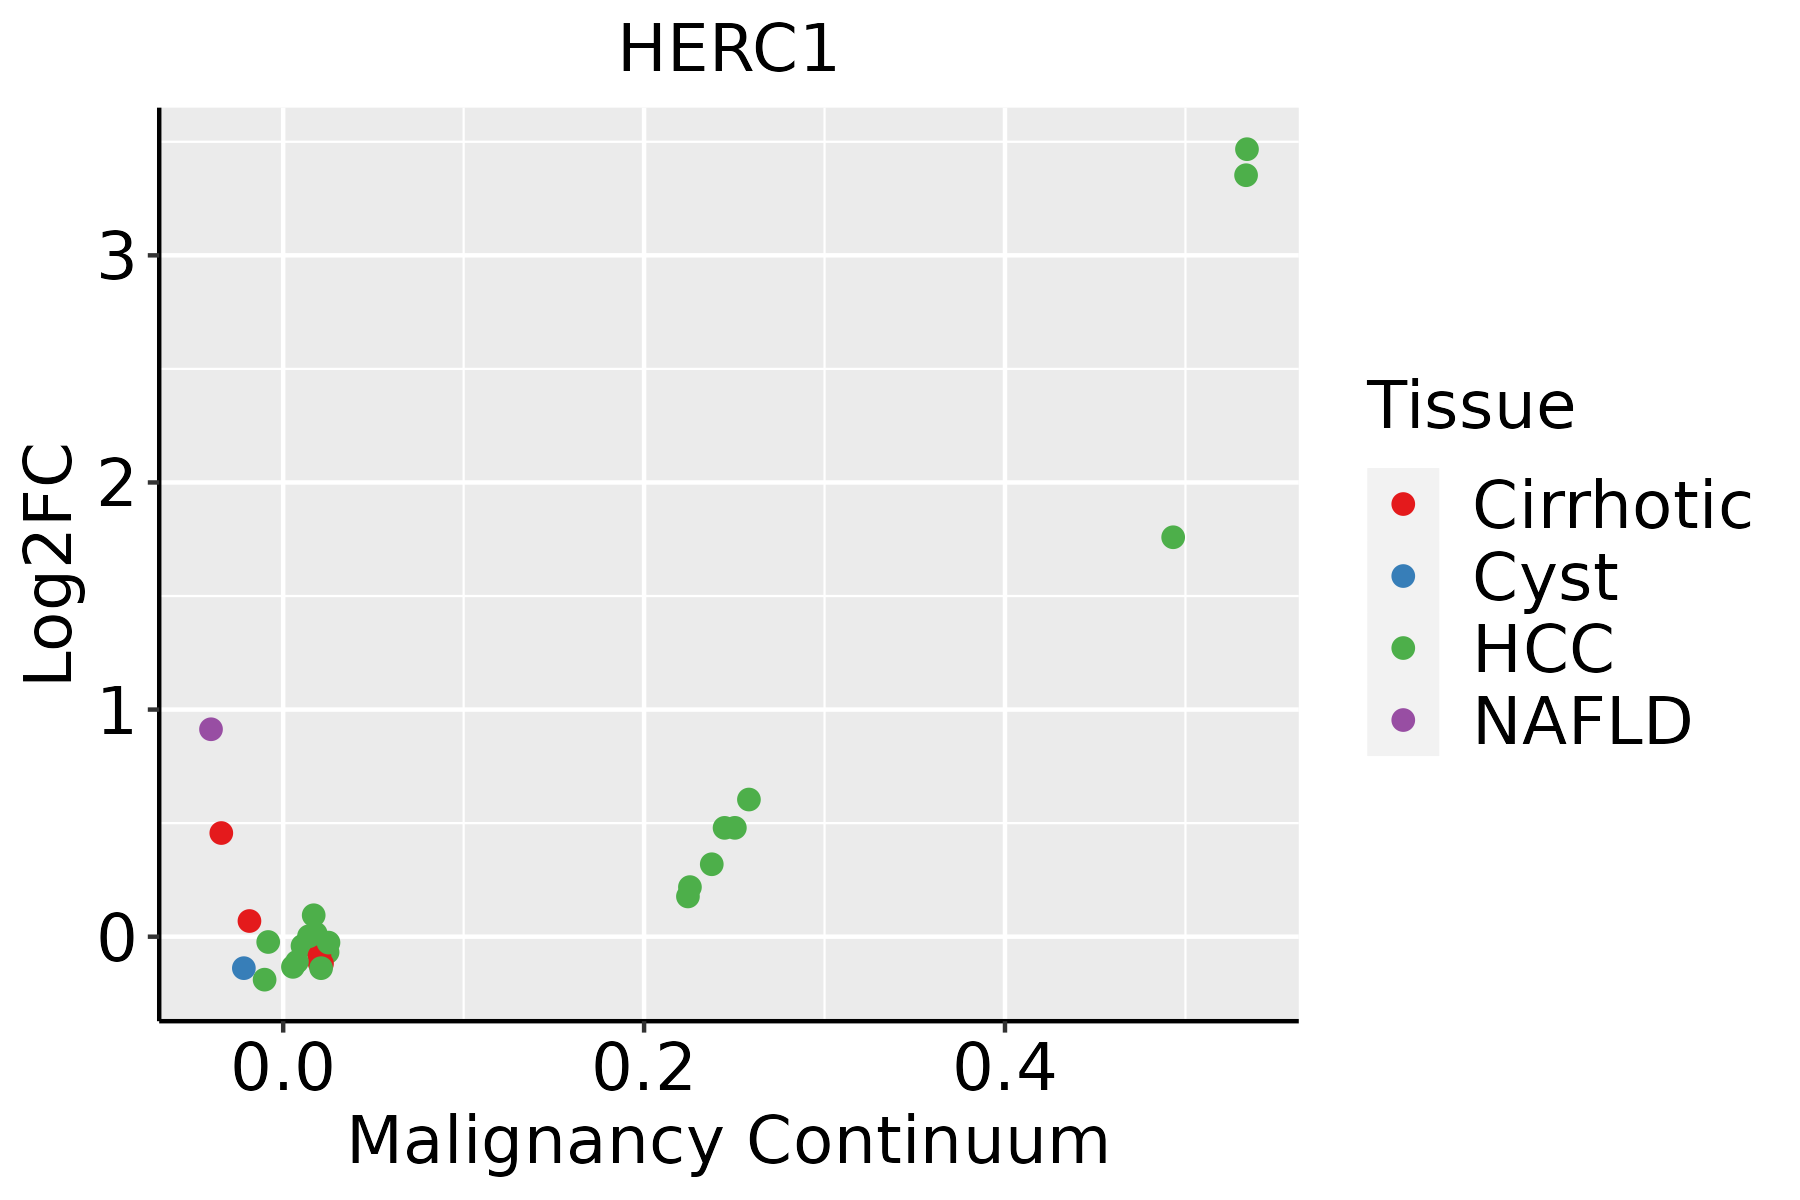 | HCC: Hepatocellular carcinoma |
| NAFLD: Non-alcoholic fatty liver disease |
| Lung |  | AAH: Atypical adenomatous hyperplasia |
| AIS: Adenocarcinoma in situ |
| IAC: Invasive lung adenocarcinoma |
| MIA: Minimally invasive adenocarcinoma |
| Oral Cavity |  | EOLP: Erosive Oral lichen planus |
| LP: leukoplakia |
| NEOLP: Non-erosive oral lichen planus |
| OSCC: Oral squamous cell carcinoma |
| Prostate |  | BPH: Benign Prostatic Hyperplasia |
| Thyroid |  | ATC: Anaplastic thyroid cancer |
| HT: Hashimoto's thyroiditis |
| PTC: Papillary thyroid cancer |
| GO ID | Tissue | Disease Stage | Description | Gene Ratio | Bg Ratio | pvalue | p.adjust | Count |
| GO:003133010 | Cervix | CC | negative regulation of cellular catabolic process | 63/2311 | 262/18723 | 1.10e-07 | 5.68e-06 | 63 |
| GO:000989510 | Cervix | CC | negative regulation of catabolic process | 69/2311 | 320/18723 | 2.15e-06 | 6.55e-05 | 69 |
| GO:00105067 | Cervix | CC | regulation of autophagy | 61/2311 | 317/18723 | 2.61e-04 | 2.87e-03 | 61 |
| GO:0009895 | Colorectum | AD | negative regulation of catabolic process | 124/3918 | 320/18723 | 1.66e-13 | 3.35e-11 | 124 |
| GO:0031330 | Colorectum | AD | negative regulation of cellular catabolic process | 104/3918 | 262/18723 | 2.66e-12 | 3.96e-10 | 104 |
| GO:0010506 | Colorectum | AD | regulation of autophagy | 111/3918 | 317/18723 | 3.57e-09 | 2.35e-07 | 111 |
| GO:0010507 | Colorectum | AD | negative regulation of autophagy | 31/3918 | 85/18723 | 6.91e-04 | 7.05e-03 | 31 |
| GO:00313302 | Colorectum | MSS | negative regulation of cellular catabolic process | 96/3467 | 262/18723 | 2.67e-12 | 4.63e-10 | 96 |
| GO:00098952 | Colorectum | MSS | negative regulation of catabolic process | 110/3467 | 320/18723 | 7.88e-12 | 1.20e-09 | 110 |
| GO:00105062 | Colorectum | MSS | regulation of autophagy | 95/3467 | 317/18723 | 4.36e-07 | 1.71e-05 | 95 |
| GO:00105071 | Colorectum | MSS | negative regulation of autophagy | 26/3467 | 85/18723 | 4.84e-03 | 3.38e-02 | 26 |
| GO:00098954 | Colorectum | FAP | negative regulation of catabolic process | 91/2622 | 320/18723 | 9.66e-12 | 4.96e-09 | 91 |
| GO:00313304 | Colorectum | FAP | negative regulation of cellular catabolic process | 77/2622 | 262/18723 | 6.79e-11 | 2.31e-08 | 77 |
| GO:00105063 | Colorectum | FAP | regulation of autophagy | 80/2622 | 317/18723 | 6.43e-08 | 4.54e-06 | 80 |
| GO:00105072 | Colorectum | FAP | negative regulation of autophagy | 24/2622 | 85/18723 | 4.59e-04 | 5.39e-03 | 24 |
| GO:00098955 | Colorectum | CRC | negative regulation of catabolic process | 75/2078 | 320/18723 | 2.02e-10 | 9.31e-08 | 75 |
| GO:00313305 | Colorectum | CRC | negative regulation of cellular catabolic process | 61/2078 | 262/18723 | 1.27e-08 | 2.54e-06 | 61 |
| GO:00105064 | Colorectum | CRC | regulation of autophagy | 62/2078 | 317/18723 | 6.04e-06 | 2.35e-04 | 62 |
| GO:00105073 | Colorectum | CRC | negative regulation of autophagy | 18/2078 | 85/18723 | 5.04e-03 | 3.87e-02 | 18 |
| GO:0021953 | Colorectum | CRC | central nervous system neuron differentiation | 29/2078 | 162/18723 | 6.36e-03 | 4.62e-02 | 29 |
| Pathway ID | Tissue | Disease Stage | Description | Gene Ratio | Bg Ratio | pvalue | p.adjust | qvalue | Count |
| hsa0412014 | Cervix | CC | Ubiquitin mediated proteolysis | 49/1267 | 142/8465 | 4.26e-09 | 7.68e-08 | 4.54e-08 | 49 |
| hsa0412015 | Cervix | CC | Ubiquitin mediated proteolysis | 49/1267 | 142/8465 | 4.26e-09 | 7.68e-08 | 4.54e-08 | 49 |
| hsa04120 | Colorectum | AD | Ubiquitin mediated proteolysis | 58/2092 | 142/8465 | 1.46e-05 | 1.53e-04 | 9.76e-05 | 58 |
| hsa041201 | Colorectum | AD | Ubiquitin mediated proteolysis | 58/2092 | 142/8465 | 1.46e-05 | 1.53e-04 | 9.76e-05 | 58 |
| hsa041204 | Colorectum | MSS | Ubiquitin mediated proteolysis | 55/1875 | 142/8465 | 5.02e-06 | 6.00e-05 | 3.68e-05 | 55 |
| hsa041205 | Colorectum | MSS | Ubiquitin mediated proteolysis | 55/1875 | 142/8465 | 5.02e-06 | 6.00e-05 | 3.68e-05 | 55 |
| hsa041206 | Colorectum | FAP | Ubiquitin mediated proteolysis | 51/1404 | 142/8465 | 1.55e-08 | 5.84e-07 | 3.55e-07 | 51 |
| hsa041207 | Colorectum | FAP | Ubiquitin mediated proteolysis | 51/1404 | 142/8465 | 1.55e-08 | 5.84e-07 | 3.55e-07 | 51 |
| hsa041208 | Colorectum | CRC | Ubiquitin mediated proteolysis | 42/1091 | 142/8465 | 9.98e-08 | 6.67e-06 | 4.52e-06 | 42 |
| hsa041209 | Colorectum | CRC | Ubiquitin mediated proteolysis | 42/1091 | 142/8465 | 9.98e-08 | 6.67e-06 | 4.52e-06 | 42 |
| hsa0412027 | Esophagus | ESCC | Ubiquitin mediated proteolysis | 122/4205 | 142/8465 | 6.53e-20 | 7.29e-18 | 3.74e-18 | 122 |
| hsa0412036 | Esophagus | ESCC | Ubiquitin mediated proteolysis | 122/4205 | 142/8465 | 6.53e-20 | 7.29e-18 | 3.74e-18 | 122 |
| hsa0412010 | Liver | NAFLD | Ubiquitin mediated proteolysis | 44/1043 | 142/8465 | 2.59e-09 | 1.70e-07 | 1.37e-07 | 44 |
| hsa0412011 | Liver | NAFLD | Ubiquitin mediated proteolysis | 44/1043 | 142/8465 | 2.59e-09 | 1.70e-07 | 1.37e-07 | 44 |
| hsa0412041 | Liver | HCC | Ubiquitin mediated proteolysis | 110/4020 | 142/8465 | 1.67e-13 | 3.74e-12 | 2.08e-12 | 110 |
| hsa0412051 | Liver | HCC | Ubiquitin mediated proteolysis | 110/4020 | 142/8465 | 1.67e-13 | 3.74e-12 | 2.08e-12 | 110 |
| hsa0412012 | Lung | IAC | Ubiquitin mediated proteolysis | 40/1053 | 142/8465 | 3.24e-07 | 1.76e-05 | 1.17e-05 | 40 |
| hsa0412013 | Lung | IAC | Ubiquitin mediated proteolysis | 40/1053 | 142/8465 | 3.24e-07 | 1.76e-05 | 1.17e-05 | 40 |
| hsa0412022 | Lung | AIS | Ubiquitin mediated proteolysis | 41/961 | 142/8465 | 8.01e-09 | 4.33e-07 | 2.77e-07 | 41 |
| hsa0412032 | Lung | AIS | Ubiquitin mediated proteolysis | 41/961 | 142/8465 | 8.01e-09 | 4.33e-07 | 2.77e-07 | 41 |
| Hugo Symbol | Variant Class | Variant Classification | dbSNP RS | HGVSc | HGVSp | HGVSp Short | SWISSPROT | BIOTYPE | SIFT | PolyPhen | Tumor Sample Barcode | Tissue | Histology | Sex | Age | Stage | Therapy Types | Drugs | Outcome |
| HERC1 | SNV | Missense_Mutation | novel | c.11710N>A | p.Pro3904Thr | p.P3904T | Q15751 | protein_coding | deleterious(0.03) | probably_damaging(0.994) | TCGA-A7-A3J0-01 | Breast | breast invasive carcinoma | Female | <65 | I/II | Hormone Therapy | anastrazole | SD |
| HERC1 | SNV | Missense_Mutation | novel | c.1118N>T | p.Glu373Val | p.E373V | Q15751 | protein_coding | tolerated(0.06) | benign(0.376) | TCGA-A8-A06O-01 | Breast | breast invasive carcinoma | Female | <65 | I/II | Hormone Therapy | letrozole | SD |
| HERC1 | SNV | Missense_Mutation | | c.8243N>T | p.Pro2748Leu | p.P2748L | Q15751 | protein_coding | tolerated(0.08) | probably_damaging(0.996) | TCGA-A8-A08B-01 | Breast | breast invasive carcinoma | Female | <65 | I/II | Chemotherapy | 5-fluorouracil | CR |
| HERC1 | SNV | Missense_Mutation | | c.8878G>C | p.Glu2960Gln | p.E2960Q | Q15751 | protein_coding | tolerated(0.05) | probably_damaging(0.979) | TCGA-AC-A23H-01 | Breast | breast invasive carcinoma | Female | >=65 | I/II | Unknown | Unknown | PD |
| HERC1 | SNV | Missense_Mutation | | c.3290G>A | p.Arg1097Lys | p.R1097K | Q15751 | protein_coding | tolerated(0.48) | benign(0.003) | TCGA-AC-A23H-01 | Breast | breast invasive carcinoma | Female | >=65 | I/II | Unknown | Unknown | PD |
| HERC1 | SNV | Missense_Mutation | novel | c.1382N>T | p.Ser461Leu | p.S461L | Q15751 | protein_coding | deleterious(0) | possibly_damaging(0.448) | TCGA-AC-A8OQ-01 | Breast | breast invasive carcinoma | Female | >=65 | I/II | Unknown | Unknown | SD |
| HERC1 | SNV | Missense_Mutation | novel | c.13958C>A | p.Ser4653Tyr | p.S4653Y | Q15751 | protein_coding | deleterious(0) | probably_damaging(0.998) | TCGA-AN-A046-01 | Breast | breast invasive carcinoma | Female | >=65 | I/II | Unknown | Unknown | SD |
| HERC1 | SNV | Missense_Mutation | rs748693076 | c.13771C>T | p.Arg4591Cys | p.R4591C | Q15751 | protein_coding | deleterious(0) | probably_damaging(0.998) | TCGA-AN-A046-01 | Breast | breast invasive carcinoma | Female | >=65 | I/II | Unknown | Unknown | SD |
| HERC1 | SNV | Missense_Mutation | rs774633591 | c.11846C>A | p.Ser3949Tyr | p.S3949Y | Q15751 | protein_coding | deleterious(0) | benign(0.259) | TCGA-AN-A046-01 | Breast | breast invasive carcinoma | Female | >=65 | I/II | Unknown | Unknown | SD |
| HERC1 | SNV | Missense_Mutation | rs757745102 | c.4529C>T | p.Ser1510Leu | p.S1510L | Q15751 | protein_coding | tolerated(0.13) | probably_damaging(0.921) | TCGA-AN-A046-01 | Breast | breast invasive carcinoma | Female | >=65 | I/II | Unknown | Unknown | SD |


