
|
|||||
|
 | |
| |
| |
| |
| |
| |
|
Gene: HEPHL1 |
Gene summary for HEPHL1 |
| Gene information | Species | Human | Gene symbol | HEPHL1 | Gene ID | 341208 |
| Gene name | hephaestin like 1 | |
| Gene Alias | HJDD | |
| Cytomap | 11q21 | |
| Gene Type | protein-coding | GO ID | GO:0000041 | UniProtAcc | Q6MZM0 |
Top |
Malignant transformation analysis |
| Identification of the aberrant gene expression in precancerous and cancerous lesions by comparing the gene expression of stem-like cells in diseased tissues with normal stem cells |
| Entrez ID | Symbol | Replicates | Species | Organ | Tissue | Adj P-value | Log2FC | Malignancy |
| 341208 | HEPHL1 | C04 | Human | Oral cavity | OSCC | 1.86e-30 | 1.57e+00 | 0.2633 |
| 341208 | HEPHL1 | C21 | Human | Oral cavity | OSCC | 1.23e-27 | 1.31e+00 | 0.2678 |
| 341208 | HEPHL1 | C57 | Human | Oral cavity | OSCC | 3.15e-03 | 1.31e-01 | 0.1679 |
| 341208 | HEPHL1 | SYSMH3 | Human | Oral cavity | OSCC | 5.70e-20 | 6.85e-01 | 0.2442 |
| 341208 | HEPHL1 | SYSMH5 | Human | Oral cavity | OSCC | 1.38e-08 | 3.01e-01 | 0.0647 |
| Page: 1 |
| Tissue | Expression Dynamics | Abbreviation |
| Oral Cavity | 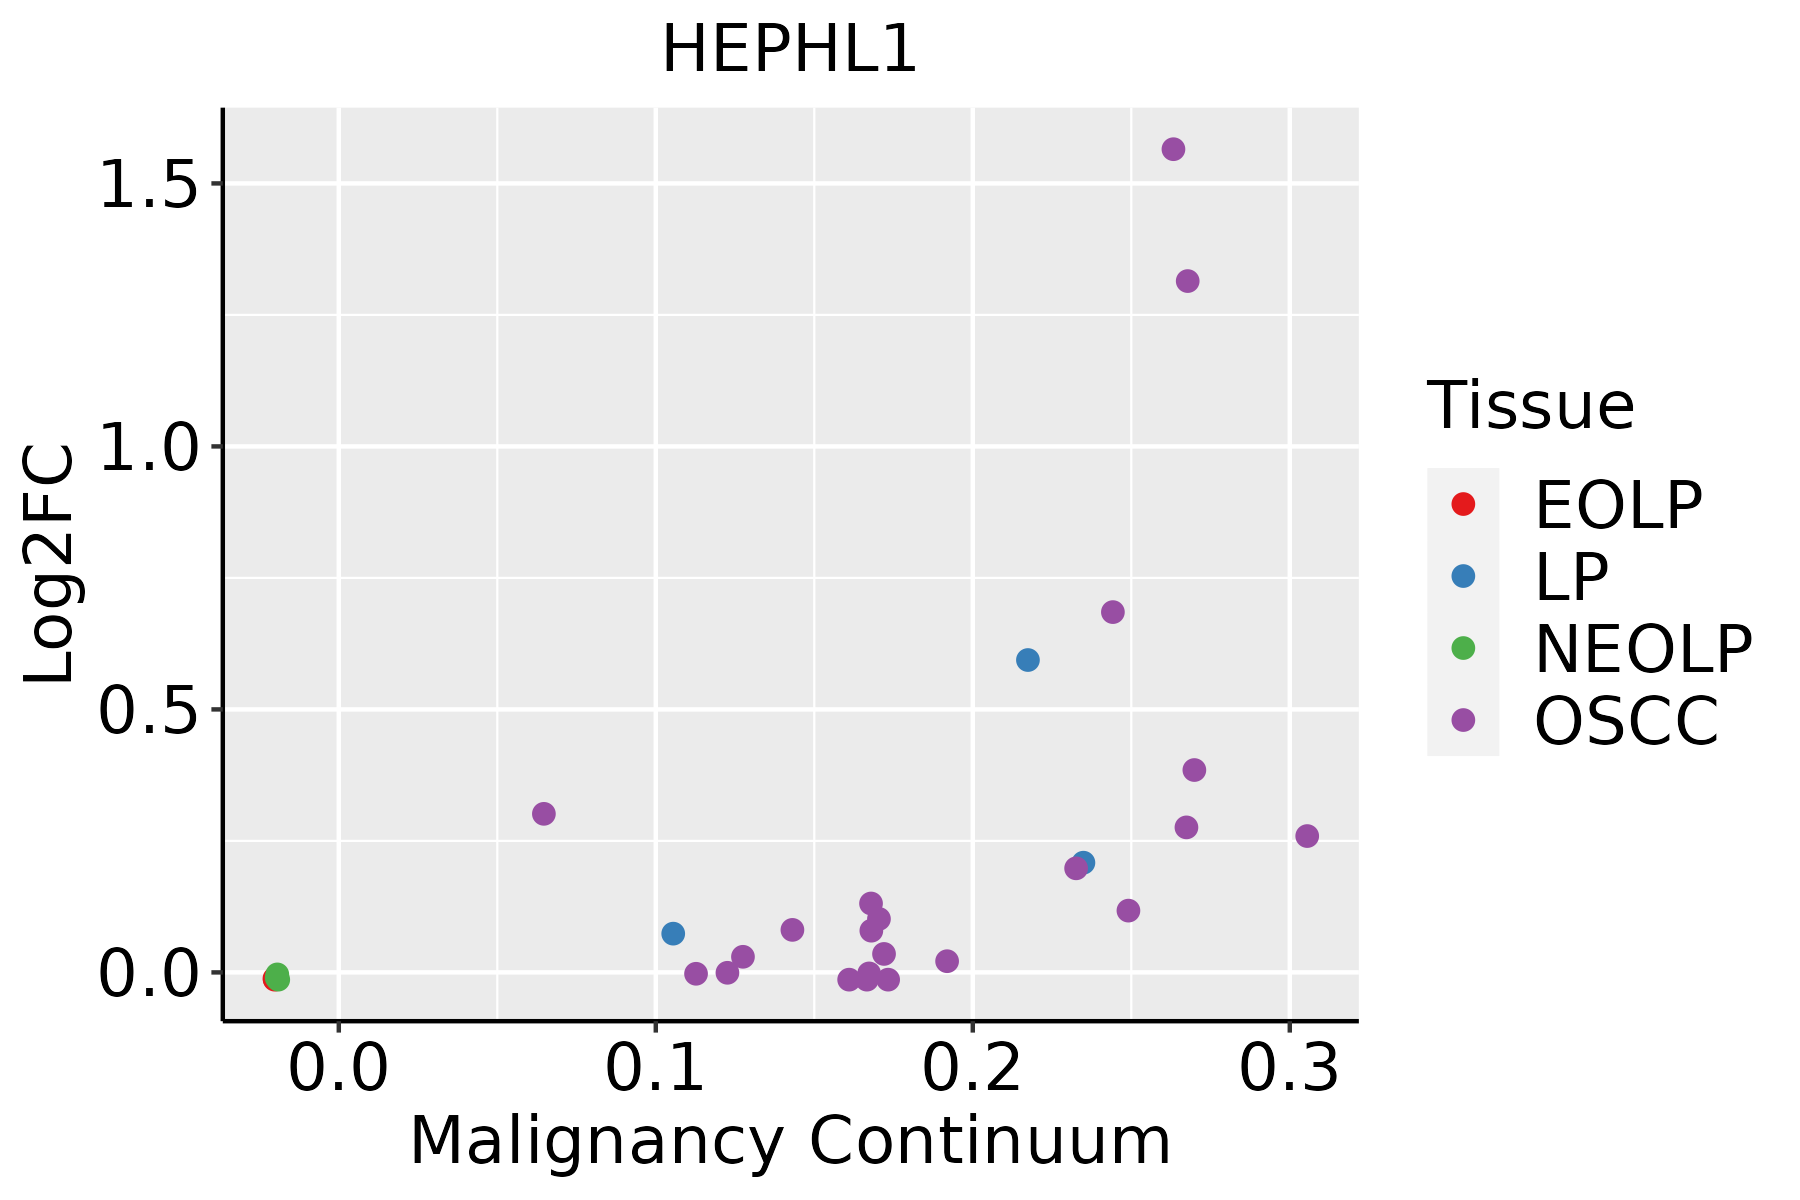 | EOLP: Erosive Oral lichen planus |
| LP: leukoplakia | ||
| NEOLP: Non-erosive oral lichen planus | ||
| OSCC: Oral squamous cell carcinoma |
| ∗log2FC in expression of this searched gene in stem-like cells from each diseased tissue sample relative to stem-like cells in normal samples in each tissue plotted against the malignancy continuum. Samples are colored based on if they are from different disease stage. |
Top |
Malignant transformation related pathway analysis |
| Find out the enriched GO biological processes and KEGG pathways involved in transition from healthy to precancer to cancer |
| Tissue | Disease Stage | Enriched GO biological Processes |
| Colorectum | AD |  |
| Colorectum | SER |  |
| Colorectum | MSS |  |
| Colorectum | MSI-H |  |
| Colorectum | FAP |  |
| ∗Top 15 enriched GO BP terms are showed in the bar plot of each disease state in each tissue. Each row represents a significant GO biological process which is colored according to the -log10(p.adjust). |
| Page: 1 2 3 4 5 6 7 8 9 |
| GO ID | Tissue | Disease Stage | Description | Gene Ratio | Bg Ratio | pvalue | p.adjust | Count |
| GO:005507610 | Oral cavity | OSCC | transition metal ion homeostasis | 81/7305 | 138/18723 | 2.13e-06 | 2.72e-05 | 81 |
| GO:00469168 | Oral cavity | OSCC | cellular transition metal ion homeostasis | 64/7305 | 115/18723 | 2.13e-04 | 1.40e-03 | 64 |
| GO:00550728 | Oral cavity | OSCC | iron ion homeostasis | 46/7305 | 85/18723 | 3.31e-03 | 1.42e-02 | 46 |
| Page: 1 |
| Pathway ID | Tissue | Disease Stage | Description | Gene Ratio | Bg Ratio | pvalue | p.adjust | qvalue | Count |
| Page: 1 |
Top |
Cell-cell communication analysis |
| Identification of potential cell-cell interactions between two cell types and their ligand-receptor pairs for different disease states |
| Ligand | Receptor | LRpair | Pathway | Tissue | Disease Stage |
| Page: 1 |
Top |
Single-cell gene regulatory network inference analysis |
| Find out the significant the regulons (TFs) and the target genes of each regulon across cell types for different disease states |
| TF | Cell Type | Tissue | Disease Stage | Target Gene | RSS | Regulon Activity |
| ∗The dot plots of a searched regulon are shown for all cell subpopulations in each disease state of each tissue based on the regulon specific score inferred using pySCENIC and by calculating the average expression. |
| Page: 1 |
Top |
Somatic mutation of malignant transformation related genes |
| Annotation of somatic variants for genes involved in malignant transformation |
| Hugo Symbol | Variant Class | Variant Classification | dbSNP RS | HGVSc | HGVSp | HGVSp Short | SWISSPROT | BIOTYPE | SIFT | PolyPhen | Tumor Sample Barcode | Tissue | Histology | Sex | Age | Stage | Therapy Types | Drugs | Outcome |
| HEPHL1 | SNV | Missense_Mutation | c.1920N>T | p.Arg640Ser | p.R640S | Q6MZM0 | protein_coding | deleterious(0.01) | benign(0) | TCGA-A1-A0SO-01 | Breast | breast invasive carcinoma | Female | >=65 | I/II | Chemotherapy | SD | ||
| HEPHL1 | SNV | Missense_Mutation | c.647C>T | p.Ser216Leu | p.S216L | Q6MZM0 | protein_coding | tolerated(0.1) | benign(0.003) | TCGA-AC-A23H-01 | Breast | breast invasive carcinoma | Female | >=65 | I/II | Unknown | Unknown | PD | |
| HEPHL1 | SNV | Missense_Mutation | rs761305753 | c.2069N>A | p.Pro690Gln | p.P690Q | Q6MZM0 | protein_coding | deleterious(0) | possibly_damaging(0.894) | TCGA-AC-A3TN-01 | Breast | breast invasive carcinoma | Female | >=65 | I/II | Hormone Therapy | arimidex | SD |
| HEPHL1 | SNV | Missense_Mutation | novel | c.1203N>A | p.Phe401Leu | p.F401L | Q6MZM0 | protein_coding | tolerated(0.11) | benign(0.009) | TCGA-AN-A046-01 | Breast | breast invasive carcinoma | Female | >=65 | I/II | Unknown | Unknown | SD |
| HEPHL1 | SNV | Missense_Mutation | rs761601480 | c.3031A>G | p.Ser1011Gly | p.S1011G | Q6MZM0 | protein_coding | deleterious(0.02) | probably_damaging(0.974) | TCGA-AN-A0AR-01 | Breast | breast invasive carcinoma | Female | <65 | I/II | Unknown | Unknown | SD |
| HEPHL1 | SNV | Missense_Mutation | c.2875N>A | p.Asp959Asn | p.D959N | Q6MZM0 | protein_coding | deleterious(0) | possibly_damaging(0.477) | TCGA-AN-A0FV-01 | Breast | breast invasive carcinoma | Female | <65 | I/II | Unknown | Unknown | SD | |
| HEPHL1 | SNV | Missense_Mutation | novel | c.3104N>C | p.Ile1035Thr | p.I1035T | Q6MZM0 | protein_coding | deleterious(0.02) | possibly_damaging(0.777) | TCGA-AN-A0XN-01 | Breast | breast invasive carcinoma | Female | >=65 | III/IV | Unknown | Unknown | SD |
| HEPHL1 | SNV | Missense_Mutation | novel | c.290N>C | p.Leu97Pro | p.L97P | Q6MZM0 | protein_coding | deleterious(0) | probably_damaging(0.996) | TCGA-AR-A0TU-01 | Breast | breast invasive carcinoma | Female | <65 | I/II | Unspecific | Doxorubicin | SD |
| HEPHL1 | SNV | Missense_Mutation | c.1060N>A | p.Gln354Lys | p.Q354K | Q6MZM0 | protein_coding | tolerated(0.57) | benign(0.03) | TCGA-AR-A0TV-01 | Breast | breast invasive carcinoma | Female | >=65 | I/II | Unknown | Unknown | SD | |
| HEPHL1 | SNV | Missense_Mutation | novel | c.3010N>G | p.Thr1004Ala | p.T1004A | Q6MZM0 | protein_coding | deleterious(0.03) | probably_damaging(0.919) | TCGA-2W-A8YY-01 | Cervix | cervical & endocervical cancer | Female | <65 | I/II | Chemotherapy | cisplatin | CR |
| Page: 1 2 3 4 5 6 7 8 9 10 11 12 13 14 15 16 |
Top |
Related drugs of malignant transformation related genes |
| Identification of chemicals and drugs interact with genes involved in malignant transfromation |
| (DGIdb 4.0) |
| Entrez ID | Symbol | Category | Interaction Types | Drug Claim Name | Drug Name | PMIDs |
| Page: 1 |

Copyright 2023-Present -The University of Texas Health Science Center at Houston |