
|
|||||
|
 | |
| |
| |
| |
| |
| |
|
Gene: HEPH |
Gene summary for HEPH |
| Gene information | Species | Human | Gene symbol | HEPH | Gene ID | 9843 |
| Gene name | hephaestin | |
| Gene Alias | CPL | |
| Cytomap | Xq12 | |
| Gene Type | protein-coding | GO ID | GO:0000041 | UniProtAcc | A0A0C4DG76 |
Top |
Malignant transformation analysis |
| Identification of the aberrant gene expression in precancerous and cancerous lesions by comparing the gene expression of stem-like cells in diseased tissues with normal stem cells |
| Entrez ID | Symbol | Replicates | Species | Organ | Tissue | Adj P-value | Log2FC | Malignancy |
| 9843 | HEPH | HTA11_3410_2000001011 | Human | Colorectum | AD | 6.46e-29 | -8.05e-01 | 0.0155 |
| 9843 | HEPH | HTA11_2951_2000001011 | Human | Colorectum | AD | 7.50e-04 | -7.86e-01 | 0.0216 |
| 9843 | HEPH | HTA11_3361_2000001011 | Human | Colorectum | AD | 1.03e-13 | -7.77e-01 | -0.1207 |
| 9843 | HEPH | HTA11_83_2000001011 | Human | Colorectum | SER | 1.13e-02 | -4.37e-01 | -0.1526 |
| 9843 | HEPH | HTA11_696_2000001011 | Human | Colorectum | AD | 6.31e-09 | -4.62e-01 | -0.1464 |
| 9843 | HEPH | HTA11_866_2000001011 | Human | Colorectum | AD | 1.47e-11 | -5.78e-01 | -0.1001 |
| 9843 | HEPH | HTA11_5216_2000001011 | Human | Colorectum | SER | 2.47e-03 | -7.28e-01 | -0.1462 |
| 9843 | HEPH | HTA11_546_2000001011 | Human | Colorectum | AD | 5.51e-05 | -5.51e-01 | -0.0842 |
| 9843 | HEPH | HTA11_7862_2000001011 | Human | Colorectum | AD | 8.35e-03 | -5.59e-01 | -0.0179 |
| 9843 | HEPH | HTA11_866_3004761011 | Human | Colorectum | AD | 6.23e-12 | -5.99e-01 | 0.096 |
| 9843 | HEPH | HTA11_4255_2000001011 | Human | Colorectum | SER | 2.14e-03 | -7.86e-01 | 0.0446 |
| 9843 | HEPH | HTA11_10711_2000001011 | Human | Colorectum | AD | 1.10e-09 | -6.68e-01 | 0.0338 |
| 9843 | HEPH | HTA11_7696_3000711011 | Human | Colorectum | AD | 1.06e-12 | -5.62e-01 | 0.0674 |
| 9843 | HEPH | HTA11_6818_2000001011 | Human | Colorectum | AD | 7.58e-05 | -6.19e-01 | 0.0112 |
| 9843 | HEPH | HTA11_99999970781_79442 | Human | Colorectum | MSS | 8.96e-14 | -6.01e-01 | 0.294 |
| 9843 | HEPH | HTA11_99999971662_82457 | Human | Colorectum | MSS | 2.09e-09 | -4.79e-01 | 0.3859 |
| 9843 | HEPH | HTA11_99999974143_84620 | Human | Colorectum | MSS | 9.91e-09 | -4.84e-01 | 0.3005 |
| 9843 | HEPH | F007 | Human | Colorectum | FAP | 3.21e-02 | 3.59e-02 | 0.1176 |
| 9843 | HEPH | A001-C-207 | Human | Colorectum | FAP | 1.34e-03 | 6.30e-02 | 0.1278 |
| 9843 | HEPH | A015-C-203 | Human | Colorectum | FAP | 4.20e-27 | -2.00e-01 | -0.1294 |
| Page: 1 2 3 |
| Tissue | Expression Dynamics | Abbreviation |
| Colorectum (GSE201348) |  | FAP: Familial adenomatous polyposis |
| CRC: Colorectal cancer | ||
| Colorectum (HTA11) |  | AD: Adenomas |
| SER: Sessile serrated lesions | ||
| MSI-H: Microsatellite-high colorectal cancer | ||
| MSS: Microsatellite stable colorectal cancer | ||
| GC | 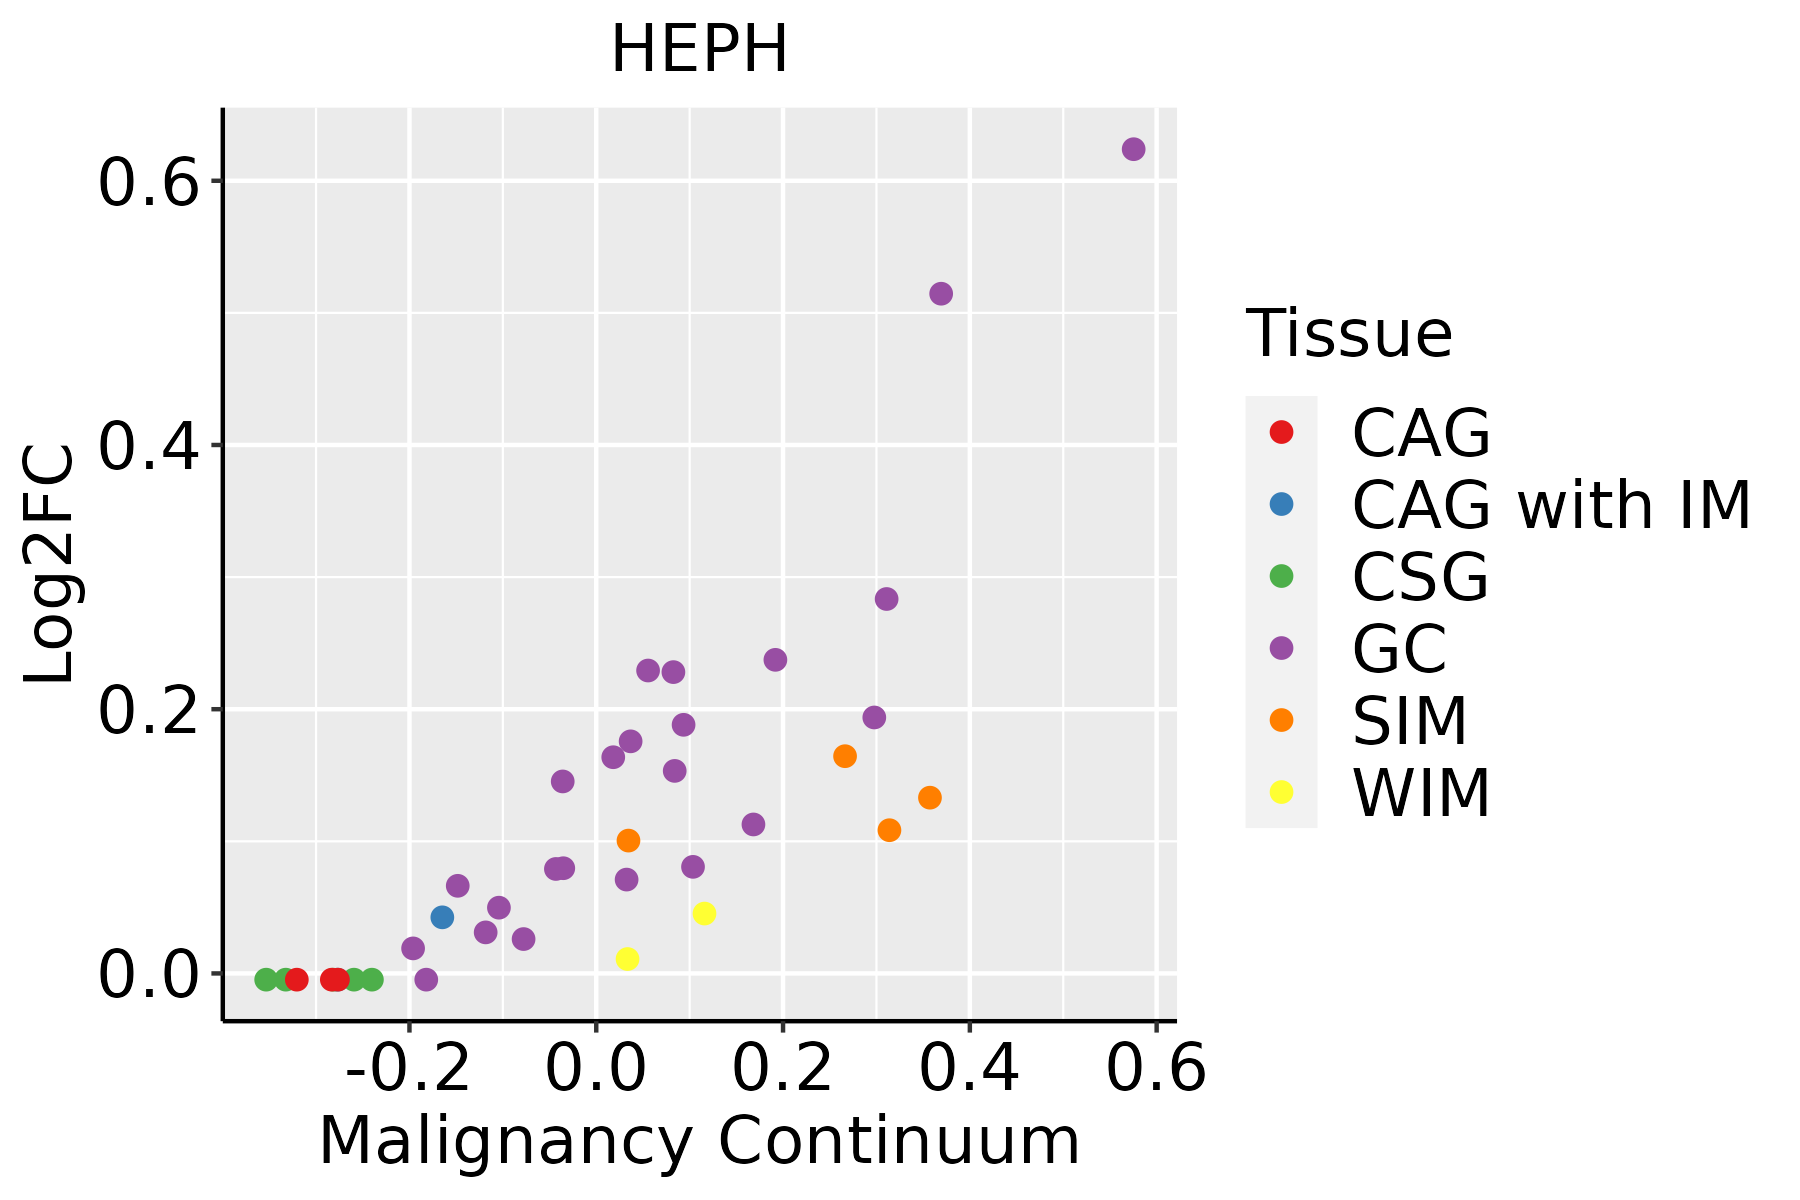 | CAG: Chronic atrophic gastritis |
| CAG with IM: Chronic atrophic gastritis with intestinal metaplasia | ||
| CSG: Chronic superficial gastritis | ||
| GC: Gastric cancer | ||
| SIM: Severe intestinal metaplasia | ||
| WIM: Wild intestinal metaplasia |
| ∗log2FC in expression of this searched gene in stem-like cells from each diseased tissue sample relative to stem-like cells in normal samples in each tissue plotted against the malignancy continuum. Samples are colored based on if they are from different disease stage. |
Top |
Malignant transformation related pathway analysis |
| Find out the enriched GO biological processes and KEGG pathways involved in transition from healthy to precancer to cancer |
| Tissue | Disease Stage | Enriched GO biological Processes |
| Colorectum | AD |  |
| Colorectum | SER |  |
| Colorectum | MSS |  |
| Colorectum | MSI-H |  |
| Colorectum | FAP |  |
| ∗Top 15 enriched GO BP terms are showed in the bar plot of each disease state in each tissue. Each row represents a significant GO biological process which is colored according to the -log10(p.adjust). |
| Page: 1 2 3 4 5 6 7 8 9 |
| GO ID | Tissue | Disease Stage | Description | Gene Ratio | Bg Ratio | pvalue | p.adjust | Count |
| GO:0055076 | Colorectum | AD | transition metal ion homeostasis | 53/3918 | 138/18723 | 1.89e-06 | 5.65e-05 | 53 |
| GO:0046916 | Colorectum | AD | cellular transition metal ion homeostasis | 43/3918 | 115/18723 | 3.62e-05 | 6.56e-04 | 43 |
| GO:0055072 | Colorectum | AD | iron ion homeostasis | 32/3918 | 85/18723 | 2.97e-04 | 3.60e-03 | 32 |
| GO:0006879 | Colorectum | AD | cellular iron ion homeostasis | 25/3918 | 67/18723 | 1.51e-03 | 1.27e-02 | 25 |
| GO:00550761 | Colorectum | SER | transition metal ion homeostasis | 41/2897 | 138/18723 | 1.66e-05 | 5.05e-04 | 41 |
| GO:00469161 | Colorectum | SER | cellular transition metal ion homeostasis | 33/2897 | 115/18723 | 2.20e-04 | 3.89e-03 | 33 |
| GO:00550721 | Colorectum | SER | iron ion homeostasis | 24/2897 | 85/18723 | 1.91e-03 | 1.93e-02 | 24 |
| GO:00550762 | Colorectum | MSS | transition metal ion homeostasis | 45/3467 | 138/18723 | 4.99e-05 | 9.02e-04 | 45 |
| GO:00550722 | Colorectum | MSS | iron ion homeostasis | 29/3467 | 85/18723 | 4.44e-04 | 5.32e-03 | 29 |
| GO:00469162 | Colorectum | MSS | cellular transition metal ion homeostasis | 35/3467 | 115/18723 | 1.33e-03 | 1.26e-02 | 35 |
| GO:00068791 | Colorectum | MSS | cellular iron ion homeostasis | 22/3467 | 67/18723 | 3.57e-03 | 2.64e-02 | 22 |
| GO:00550764 | Colorectum | FAP | transition metal ion homeostasis | 33/2622 | 138/18723 | 1.22e-03 | 1.14e-02 | 33 |
| GO:00550723 | Colorectum | FAP | iron ion homeostasis | 21/2622 | 85/18723 | 5.89e-03 | 3.75e-02 | 21 |
| GO:005507610 | Oral cavity | OSCC | transition metal ion homeostasis | 81/7305 | 138/18723 | 2.13e-06 | 2.72e-05 | 81 |
| GO:00469168 | Oral cavity | OSCC | cellular transition metal ion homeostasis | 64/7305 | 115/18723 | 2.13e-04 | 1.40e-03 | 64 |
| GO:00550728 | Oral cavity | OSCC | iron ion homeostasis | 46/7305 | 85/18723 | 3.31e-03 | 1.42e-02 | 46 |
| GO:00550765 | Stomach | GC | transition metal ion homeostasis | 19/1159 | 138/18723 | 8.62e-04 | 1.07e-02 | 19 |
| GO:0000041 | Stomach | GC | transition metal ion transport | 15/1159 | 105/18723 | 2.01e-03 | 2.03e-02 | 15 |
| GO:00469163 | Stomach | GC | cellular transition metal ion homeostasis | 15/1159 | 115/18723 | 4.87e-03 | 3.89e-02 | 15 |
| GO:0006826 | Stomach | SIM | iron ion transport | 7/708 | 58/18723 | 6.05e-03 | 4.83e-02 | 7 |
| Page: 1 2 |
| Pathway ID | Tissue | Disease Stage | Description | Gene Ratio | Bg Ratio | pvalue | p.adjust | qvalue | Count |
| hsa04978 | Stomach | GC | Mineral absorption | 15/708 | 60/8465 | 8.88e-05 | 9.80e-04 | 6.90e-04 | 15 |
| hsa049781 | Stomach | GC | Mineral absorption | 15/708 | 60/8465 | 8.88e-05 | 9.80e-04 | 6.90e-04 | 15 |
| hsa049788 | Stomach | SIM | Mineral absorption | 11/465 | 60/8465 | 3.61e-04 | 3.41e-03 | 2.74e-03 | 11 |
| hsa049789 | Stomach | SIM | Mineral absorption | 11/465 | 60/8465 | 3.61e-04 | 3.41e-03 | 2.74e-03 | 11 |
| Page: 1 |
Top |
Cell-cell communication analysis |
| Identification of potential cell-cell interactions between two cell types and their ligand-receptor pairs for different disease states |
| Ligand | Receptor | LRpair | Pathway | Tissue | Disease Stage |
| Page: 1 |
Top |
Single-cell gene regulatory network inference analysis |
| Find out the significant the regulons (TFs) and the target genes of each regulon across cell types for different disease states |
| TF | Cell Type | Tissue | Disease Stage | Target Gene | RSS | Regulon Activity |
| ∗The dot plots of a searched regulon are shown for all cell subpopulations in each disease state of each tissue based on the regulon specific score inferred using pySCENIC and by calculating the average expression. |
| Page: 1 |
Top |
Somatic mutation of malignant transformation related genes |
| Annotation of somatic variants for genes involved in malignant transformation |
| Hugo Symbol | Variant Class | Variant Classification | dbSNP RS | HGVSc | HGVSp | HGVSp Short | SWISSPROT | BIOTYPE | SIFT | PolyPhen | Tumor Sample Barcode | Tissue | Histology | Sex | Age | Stage | Therapy Types | Drugs | Outcome |
| HEPH | SNV | Missense_Mutation | c.2883C>G | p.Ile961Met | p.I961M | Q9BQS7 | protein_coding | tolerated(0.2) | benign(0.289) | TCGA-AN-A0FY-01 | Breast | breast invasive carcinoma | Female | <65 | I/II | Unknown | Unknown | SD | |
| HEPH | SNV | Missense_Mutation | c.1996G>A | p.Glu666Lys | p.E666K | Q9BQS7 | protein_coding | tolerated(0.15) | benign(0.003) | TCGA-BH-A0BV-01 | Breast | breast invasive carcinoma | Female | >=65 | I/II | Chemotherapy | doxorubicin | SD | |
| HEPH | SNV | Missense_Mutation | c.879N>T | p.Trp293Cys | p.W293C | Q9BQS7 | protein_coding | deleterious(0) | probably_damaging(0.999) | TCGA-BH-A0EE-01 | Breast | breast invasive carcinoma | Female | >=65 | I/II | Chemotherapy | docetaxel | SD | |
| HEPH | SNV | Missense_Mutation | c.2725N>T | p.Gly909Cys | p.G909C | Q9BQS7 | protein_coding | deleterious(0) | probably_damaging(1) | TCGA-BH-A0WA-01 | Breast | breast invasive carcinoma | Female | >=65 | I/II | Unknown | Unknown | SD | |
| HEPH | SNV | Missense_Mutation | c.1625N>C | p.Phe542Ser | p.F542S | Q9BQS7 | protein_coding | tolerated(0.51) | benign(0.03) | TCGA-D8-A1J8-01 | Breast | breast invasive carcinoma | Female | >=65 | I/II | Hormone Therapy | nolvadex | SD | |
| HEPH | SNV | Missense_Mutation | c.1816N>A | p.Gly606Ser | p.G606S | Q9BQS7 | protein_coding | deleterious(0) | probably_damaging(1) | TCGA-E9-A22B-01 | Breast | breast invasive carcinoma | Female | >=65 | I/II | Hormone Therapy | tamoxiphen | SD | |
| HEPH | SNV | Missense_Mutation | c.1060N>A | p.Glu354Lys | p.E354K | Q9BQS7 | protein_coding | deleterious(0) | probably_damaging(0.98) | TCGA-E9-A22G-01 | Breast | breast invasive carcinoma | Female | <65 | I/II | Chemotherapy | doxorubicin | SD | |
| HEPH | insertion | Frame_Shift_Ins | novel | c.3346_3347insT | p.Ser1118PhefsTer17 | p.S1118Ffs*17 | Q9BQS7 | protein_coding | TCGA-AN-A0AK-01 | Breast | breast invasive carcinoma | Female | >=65 | I/II | Unknown | Unknown | SD | ||
| HEPH | insertion | Frame_Shift_Ins | novel | c.707_708insATTAA | p.Trp237LeufsTer9 | p.W237Lfs*9 | Q9BQS7 | protein_coding | TCGA-AR-A0TU-01 | Breast | breast invasive carcinoma | Female | <65 | I/II | Unspecific | Doxorubicin | SD | ||
| HEPH | insertion | Frame_Shift_Ins | novel | c.708_709insAA | p.Trp237AsnfsTer8 | p.W237Nfs*8 | Q9BQS7 | protein_coding | TCGA-AR-A0TU-01 | Breast | breast invasive carcinoma | Female | <65 | I/II | Unspecific | Doxorubicin | SD |
| Page: 1 2 3 4 5 6 7 8 9 10 11 12 13 14 15 16 17 18 19 20 21 22 |
Top |
Related drugs of malignant transformation related genes |
| Identification of chemicals and drugs interact with genes involved in malignant transfromation |
| (DGIdb 4.0) |
| Entrez ID | Symbol | Category | Interaction Types | Drug Claim Name | Drug Name | PMIDs |
| Page: 1 |

Copyright 2023-Present -The University of Texas Health Science Center at Houston |