
|
|||||
|
 | |
| |
| |
| |
| |
| |
|
Gene: HENMT1 |
Gene summary for HENMT1 |
| Gene information | Species | Human | Gene symbol | HENMT1 | Gene ID | 113802 |
| Gene name | HEN methyltransferase 1 | |
| Gene Alias | C1orf59 | |
| Cytomap | 1p13.3 | |
| Gene Type | protein-coding | GO ID | GO:0001510 | UniProtAcc | Q5T8I9 |
Top |
Malignant transformation analysis |
| Identification of the aberrant gene expression in precancerous and cancerous lesions by comparing the gene expression of stem-like cells in diseased tissues with normal stem cells |
| Entrez ID | Symbol | Replicates | Species | Organ | Tissue | Adj P-value | Log2FC | Malignancy |
| 113802 | HENMT1 | LZE7T | Human | Esophagus | ESCC | 8.12e-05 | 3.68e-01 | 0.0667 |
| 113802 | HENMT1 | LZE24T | Human | Esophagus | ESCC | 4.17e-10 | 2.89e-01 | 0.0596 |
| 113802 | HENMT1 | P2T-E | Human | Esophagus | ESCC | 4.33e-05 | 1.61e-01 | 0.1177 |
| 113802 | HENMT1 | P4T-E | Human | Esophagus | ESCC | 6.04e-05 | 1.35e-01 | 0.1323 |
| 113802 | HENMT1 | P5T-E | Human | Esophagus | ESCC | 2.24e-07 | 1.41e-01 | 0.1327 |
| 113802 | HENMT1 | P8T-E | Human | Esophagus | ESCC | 9.58e-05 | 1.22e-01 | 0.0889 |
| 113802 | HENMT1 | P9T-E | Human | Esophagus | ESCC | 2.28e-02 | 9.98e-02 | 0.1131 |
| 113802 | HENMT1 | P10T-E | Human | Esophagus | ESCC | 7.80e-17 | 2.89e-01 | 0.116 |
| 113802 | HENMT1 | P12T-E | Human | Esophagus | ESCC | 7.59e-07 | 1.89e-01 | 0.1122 |
| 113802 | HENMT1 | P19T-E | Human | Esophagus | ESCC | 4.17e-02 | 3.30e-01 | 0.1662 |
| 113802 | HENMT1 | P20T-E | Human | Esophagus | ESCC | 3.67e-14 | 3.15e-01 | 0.1124 |
| 113802 | HENMT1 | P21T-E | Human | Esophagus | ESCC | 2.61e-08 | 2.13e-01 | 0.1617 |
| 113802 | HENMT1 | P23T-E | Human | Esophagus | ESCC | 1.50e-19 | 4.82e-01 | 0.108 |
| 113802 | HENMT1 | P27T-E | Human | Esophagus | ESCC | 7.52e-11 | 2.13e-01 | 0.1055 |
| 113802 | HENMT1 | P30T-E | Human | Esophagus | ESCC | 4.54e-05 | 1.74e-01 | 0.137 |
| 113802 | HENMT1 | P31T-E | Human | Esophagus | ESCC | 1.74e-15 | 2.93e-01 | 0.1251 |
| 113802 | HENMT1 | P32T-E | Human | Esophagus | ESCC | 4.10e-06 | 1.77e-01 | 0.1666 |
| 113802 | HENMT1 | P37T-E | Human | Esophagus | ESCC | 2.69e-05 | 1.69e-01 | 0.1371 |
| 113802 | HENMT1 | P39T-E | Human | Esophagus | ESCC | 4.60e-05 | 1.04e-01 | 0.0894 |
| 113802 | HENMT1 | P52T-E | Human | Esophagus | ESCC | 3.65e-02 | 8.41e-02 | 0.1555 |
| Page: 1 2 3 |
| Tissue | Expression Dynamics | Abbreviation |
| Esophagus |  | ESCC: Esophageal squamous cell carcinoma |
| HGIN: High-grade intraepithelial neoplasias | ||
| LGIN: Low-grade intraepithelial neoplasias | ||
| Liver | 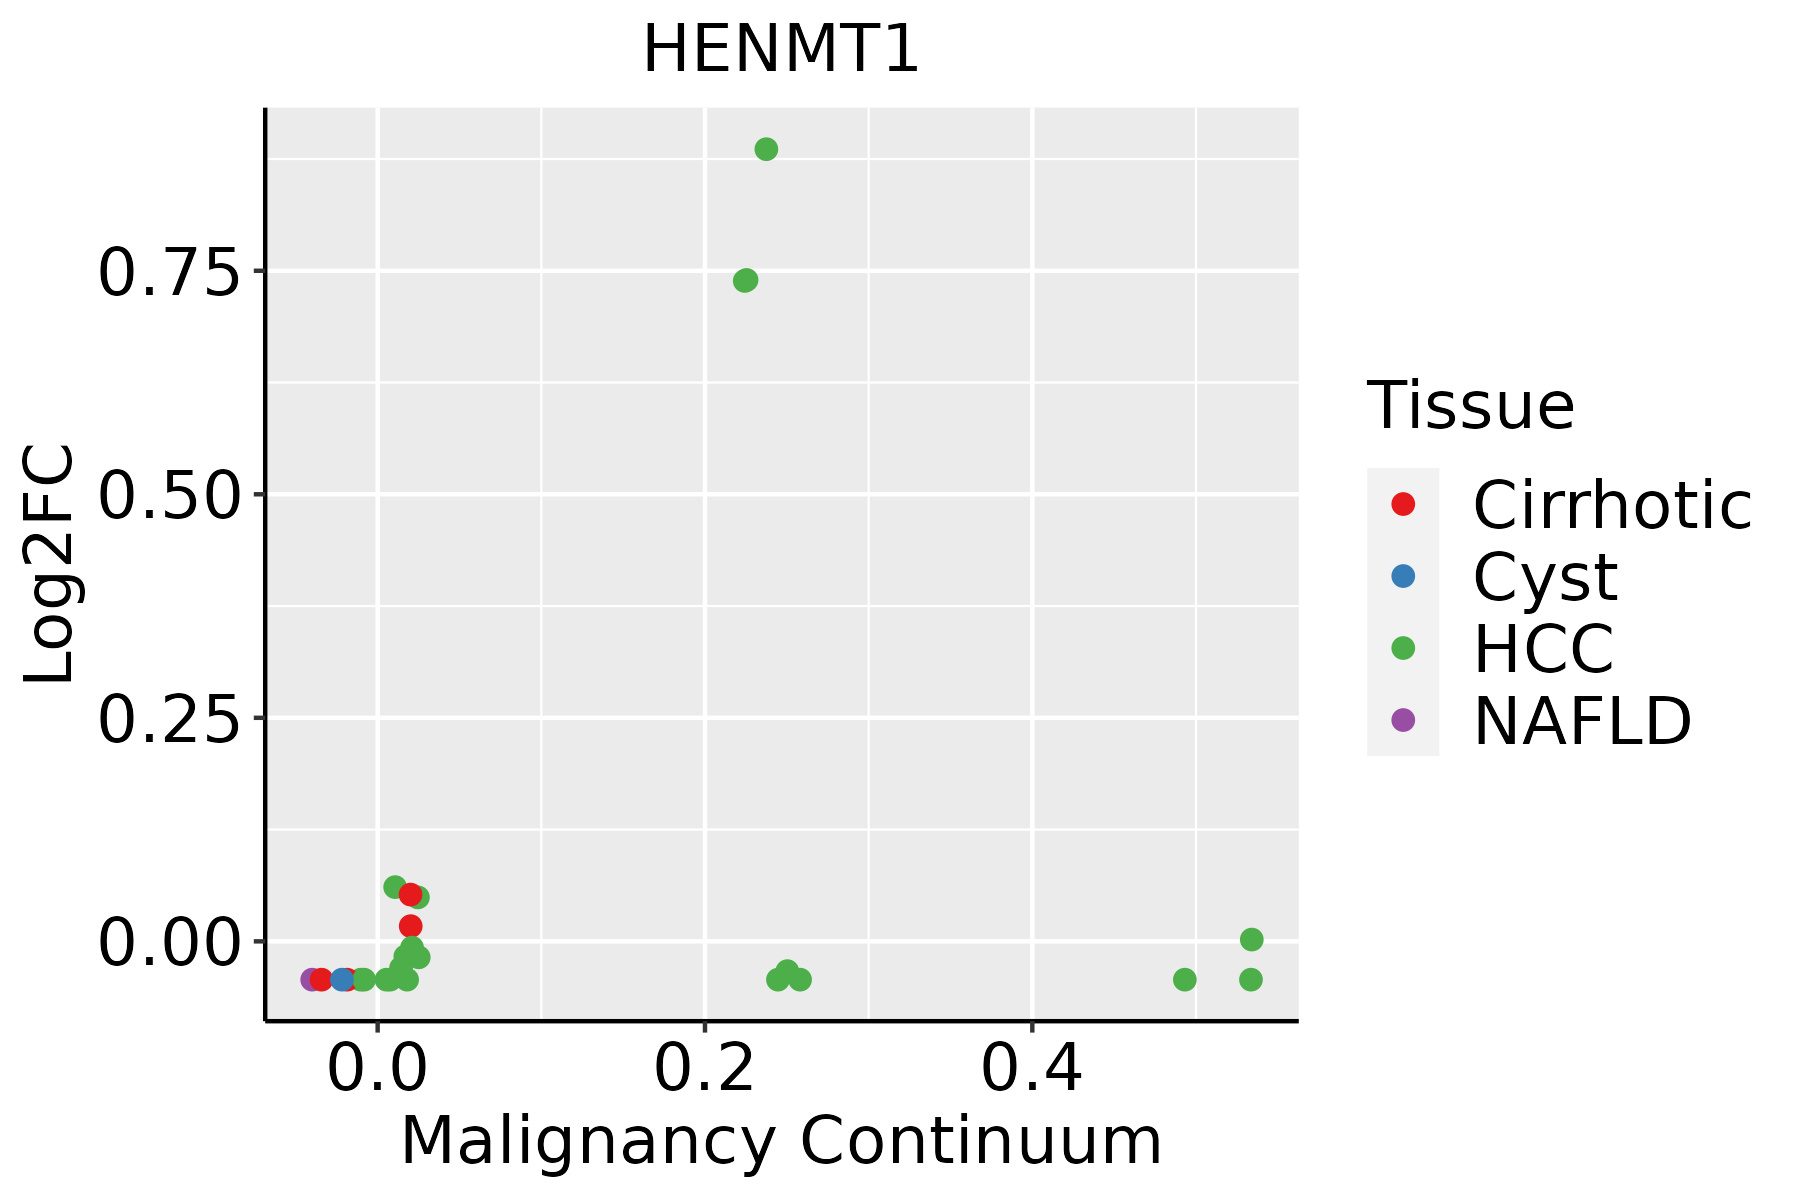 | HCC: Hepatocellular carcinoma |
| NAFLD: Non-alcoholic fatty liver disease | ||
| Oral Cavity |  | EOLP: Erosive Oral lichen planus |
| LP: leukoplakia | ||
| NEOLP: Non-erosive oral lichen planus | ||
| OSCC: Oral squamous cell carcinoma | ||
| Skin |  | AK: Actinic keratosis |
| cSCC: Cutaneous squamous cell carcinoma | ||
| SCCIS:squamous cell carcinoma in situ |
| ∗log2FC in expression of this searched gene in stem-like cells from each diseased tissue sample relative to stem-like cells in normal samples in each tissue plotted against the malignancy continuum. Samples are colored based on if they are from different disease stage. |
Top |
Malignant transformation related pathway analysis |
| Find out the enriched GO biological processes and KEGG pathways involved in transition from healthy to precancer to cancer |
| Tissue | Disease Stage | Enriched GO biological Processes |
| Colorectum | AD |  |
| Colorectum | SER |  |
| Colorectum | MSS |  |
| Colorectum | MSI-H |  |
| Colorectum | FAP |  |
| ∗Top 15 enriched GO BP terms are showed in the bar plot of each disease state in each tissue. Each row represents a significant GO biological process which is colored according to the -log10(p.adjust). |
| Page: 1 2 3 4 5 6 7 8 9 |
| GO ID | Tissue | Disease Stage | Description | Gene Ratio | Bg Ratio | pvalue | p.adjust | Count |
| GO:003466012 | Esophagus | ESCC | ncRNA metabolic process | 346/8552 | 485/18723 | 4.35e-31 | 2.51e-28 | 346 |
| GO:00434143 | Esophagus | ESCC | macromolecule methylation | 199/8552 | 316/18723 | 3.44e-10 | 9.57e-09 | 199 |
| GO:00322592 | Esophagus | ESCC | methylation | 222/8552 | 364/18723 | 2.26e-09 | 5.09e-08 | 222 |
| GO:00094512 | Esophagus | ESCC | RNA modification | 114/8552 | 167/18723 | 2.76e-09 | 6.04e-08 | 114 |
| GO:00015101 | Esophagus | ESCC | RNA methylation | 58/8552 | 83/18723 | 6.87e-06 | 6.94e-05 | 58 |
| GO:00310508 | Esophagus | ESCC | dsRNA processing | 38/8552 | 54/18723 | 2.08e-04 | 1.31e-03 | 38 |
| GO:00709188 | Esophagus | ESCC | production of small RNA involved in gene silencing by RNA | 38/8552 | 54/18723 | 2.08e-04 | 1.31e-03 | 38 |
| GO:00346601 | Liver | HCC | ncRNA metabolic process | 332/7958 | 485/18723 | 1.48e-31 | 7.80e-29 | 332 |
| GO:00434141 | Liver | HCC | macromolecule methylation | 183/7958 | 316/18723 | 2.00e-08 | 4.72e-07 | 183 |
| GO:0032259 | Liver | HCC | methylation | 206/7958 | 364/18723 | 3.35e-08 | 7.53e-07 | 206 |
| GO:0009451 | Liver | HCC | RNA modification | 101/7958 | 167/18723 | 2.02e-06 | 2.78e-05 | 101 |
| GO:003105021 | Liver | HCC | dsRNA processing | 38/7958 | 54/18723 | 3.15e-05 | 3.21e-04 | 38 |
| GO:007091821 | Liver | HCC | production of small RNA involved in gene silencing by RNA | 38/7958 | 54/18723 | 3.15e-05 | 3.21e-04 | 38 |
| GO:0001510 | Liver | HCC | RNA methylation | 53/7958 | 83/18723 | 6.96e-05 | 6.29e-04 | 53 |
| GO:0016246 | Liver | HCC | RNA interference | 10/7958 | 13/18723 | 1.28e-02 | 4.61e-02 | 10 |
| GO:00346605 | Oral cavity | OSCC | ncRNA metabolic process | 296/7305 | 485/18723 | 2.94e-23 | 6.65e-21 | 296 |
| GO:00094511 | Oral cavity | OSCC | RNA modification | 95/7305 | 167/18723 | 2.05e-06 | 2.62e-05 | 95 |
| GO:00434142 | Oral cavity | OSCC | macromolecule methylation | 149/7305 | 316/18723 | 1.82e-03 | 8.60e-03 | 149 |
| GO:00322591 | Oral cavity | OSCC | methylation | 168/7305 | 364/18723 | 3.03e-03 | 1.31e-02 | 168 |
| GO:00310507 | Oral cavity | OSCC | dsRNA processing | 31/7305 | 54/18723 | 4.66e-03 | 1.87e-02 | 31 |
| Page: 1 2 |
| Pathway ID | Tissue | Disease Stage | Description | Gene Ratio | Bg Ratio | pvalue | p.adjust | qvalue | Count |
| Page: 1 |
Top |
Cell-cell communication analysis |
| Identification of potential cell-cell interactions between two cell types and their ligand-receptor pairs for different disease states |
| Ligand | Receptor | LRpair | Pathway | Tissue | Disease Stage |
| Page: 1 |
Top |
Single-cell gene regulatory network inference analysis |
| Find out the significant the regulons (TFs) and the target genes of each regulon across cell types for different disease states |
| TF | Cell Type | Tissue | Disease Stage | Target Gene | RSS | Regulon Activity |
| ∗The dot plots of a searched regulon are shown for all cell subpopulations in each disease state of each tissue based on the regulon specific score inferred using pySCENIC and by calculating the average expression. |
| Page: 1 |
Top |
Somatic mutation of malignant transformation related genes |
| Annotation of somatic variants for genes involved in malignant transformation |
| Hugo Symbol | Variant Class | Variant Classification | dbSNP RS | HGVSc | HGVSp | HGVSp Short | SWISSPROT | BIOTYPE | SIFT | PolyPhen | Tumor Sample Barcode | Tissue | Histology | Sex | Age | Stage | Therapy Types | Drugs | Outcome |
| HENMT1 | SNV | Missense_Mutation | rs374377766 | c.1061G>A | p.Arg354His | p.R354H | Q5T8I9 | protein_coding | tolerated(0.51) | benign(0.003) | TCGA-2W-A8YY-01 | Cervix | cervical & endocervical cancer | Female | <65 | I/II | Chemotherapy | cisplatin | CR |
| HENMT1 | SNV | Missense_Mutation | novel | c.850G>A | p.Val284Met | p.V284M | Q5T8I9 | protein_coding | tolerated(0.16) | benign(0.05) | TCGA-DS-A1OC-01 | Cervix | cervical & endocervical cancer | Female | <65 | I/II | Chemotherapy | gemcitabine | SD |
| HENMT1 | SNV | Missense_Mutation | novel | c.849A>C | p.Arg283Ser | p.R283S | Q5T8I9 | protein_coding | deleterious(0.01) | benign(0.13) | TCGA-DS-A1OC-01 | Cervix | cervical & endocervical cancer | Female | <65 | I/II | Chemotherapy | gemcitabine | SD |
| HENMT1 | SNV | Missense_Mutation | c.59C>T | p.Pro20Leu | p.P20L | Q5T8I9 | protein_coding | tolerated(0.37) | benign(0.003) | TCGA-A6-2686-01 | Colorectum | colon adenocarcinoma | Female | >=65 | I/II | Unknown | Unknown | SD | |
| HENMT1 | SNV | Missense_Mutation | novel | c.355N>T | p.Asp119Tyr | p.D119Y | Q5T8I9 | protein_coding | deleterious(0) | probably_damaging(1) | TCGA-AA-3947-01 | Colorectum | colon adenocarcinoma | Female | <65 | I/II | Unknown | Unknown | SD |
| HENMT1 | SNV | Missense_Mutation | rs773137441 | c.868C>T | p.Arg290Trp | p.R290W | Q5T8I9 | protein_coding | tolerated(0.16) | benign(0.118) | TCGA-AZ-4315-01 | Colorectum | colon adenocarcinoma | Male | <65 | I/II | Unknown | Unknown | SD |
| HENMT1 | SNV | Missense_Mutation | novel | c.471G>T | p.Met157Ile | p.M157I | Q5T8I9 | protein_coding | tolerated(0.28) | benign(0.021) | TCGA-F5-6814-01 | Colorectum | rectum adenocarcinoma | Male | <65 | I/II | Unknown | Unknown | SD |
| HENMT1 | SNV | Missense_Mutation | rs770299698 | c.890N>A | p.Arg297Gln | p.R297Q | Q5T8I9 | protein_coding | tolerated(0.32) | benign(0) | TCGA-A5-A0G1-01 | Endometrium | uterine corpus endometrioid carcinoma | Female | >=65 | I/II | Unknown | Unknown | SD |
| HENMT1 | SNV | Missense_Mutation | novel | c.866N>T | p.Arg289Met | p.R289M | Q5T8I9 | protein_coding | tolerated(0.26) | benign(0.006) | TCGA-A5-A0G2-01 | Endometrium | uterine corpus endometrioid carcinoma | Female | <65 | III/IV | Unknown | Unknown | SD |
| HENMT1 | SNV | Missense_Mutation | novel | c.121N>C | p.Asn41His | p.N41H | Q5T8I9 | protein_coding | deleterious(0) | possibly_damaging(0.832) | TCGA-A5-A0G2-01 | Endometrium | uterine corpus endometrioid carcinoma | Female | <65 | III/IV | Unknown | Unknown | SD |
| Page: 1 2 3 4 |
Top |
Related drugs of malignant transformation related genes |
| Identification of chemicals and drugs interact with genes involved in malignant transfromation |
| (DGIdb 4.0) |
| Entrez ID | Symbol | Category | Interaction Types | Drug Claim Name | Drug Name | PMIDs |
| Page: 1 |

Copyright 2023-Present -The University of Texas Health Science Center at Houston |