Schematic overview of the cellular and molecular mechanisms involved in the cancer progression, including the proposed cellular and molecular mechanisms in cancer cells trajectory. AT1: alveolar type 1 cells; AT2: alveolar type 2 cells; AAH: atypical adenomatous hyperplasia; AIS: adenocarcinoma in situ; MIA: minimally invasive adenocarcinoma; IA: invasive adenocarcinoma; EMT: epithelial-mesenchymal transition

Home

Download

Statistics

Help

Contact

Center for Computational Systems Medicine
leaf

Gene summary

leaf

Malignant transformation analysis

leaf

Malignant transformation related pathway analysis

leaf

Cell-cell communication analysis

leaf

Single-cell gene regulatory network inference analysis

leaf

Somatic mutation of malignant transformation related genes

leaf

Related drugs of malignant transformation related genes

Gene: HELZ2

Gene summary for HELZ2

check button Gene summary.

Gene informationSpeciesHuman
Gene symbol

HELZ2

Gene ID

85441

Gene namehelicase with zinc finger 2
Gene AliasPDIP-1
Cytomap20q13.33
Gene Typeprotein-coding
GO ID

GO:0000184

UniProtAcc

Q9BYK8


Top

Malignant transformation analysis

check button Identification of the aberrant gene expression in precancerous and cancerous lesions by comparing the gene expression of stem-like cells in diseased tissues with normal stem cells
check button Malignant transformation involving gene list.
Entrez IDSymbolReplicatesSpeciesOrganTissueAdj P-valueLog2FCMalignancy
85441HELZ2HTA11_696_2000001011HumanColorectumAD3.62e-021.28e-01-0.1464
85441HELZ2HTA11_1391_2000001011HumanColorectumAD7.15e-041.21e-01-0.059
85441HELZ2HTA11_866_3004761011HumanColorectumAD1.19e-082.33e-010.096
85441HELZ2HTA11_10711_2000001011HumanColorectumAD1.33e-051.76e-010.0338
85441HELZ2HTA11_99999971662_82457HumanColorectumMSS4.17e-145.33e-010.3859
85441HELZ2HTA11_99999973899_84307HumanColorectumMSS3.16e-107.15e-010.2585
85441HELZ2HTA11_99999974143_84620HumanColorectumMSS8.78e-103.68e-010.3005
85441HELZ2LZE20THumanEsophagusESCC1.97e-052.79e-010.0662
85441HELZ2LZE24THumanEsophagusESCC2.92e-155.29e-010.0596
85441HELZ2LZE21THumanEsophagusESCC2.39e-053.01e-010.0655
85441HELZ2P1T-EHumanEsophagusESCC1.64e-065.71e-010.0875
85441HELZ2P2T-EHumanEsophagusESCC1.63e-102.58e-010.1177
85441HELZ2P4T-EHumanEsophagusESCC1.39e-021.07e-010.1323
85441HELZ2P5T-EHumanEsophagusESCC1.01e-081.26e-010.1327
85441HELZ2P8T-EHumanEsophagusESCC2.35e-031.06e-010.0889
85441HELZ2P9T-EHumanEsophagusESCC2.08e-072.04e-010.1131
85441HELZ2P10T-EHumanEsophagusESCC1.20e-023.49e-020.116
85441HELZ2P11T-EHumanEsophagusESCC1.51e-206.73e-010.1426
85441HELZ2P12T-EHumanEsophagusESCC1.32e-041.26e-010.1122
85441HELZ2P17T-EHumanEsophagusESCC3.65e-085.79e-010.1278
Page: 1 2 3 4 5 6 

check button Transcriptomic changes along malignancy continuum.
TissueExpression DynamicsAbbreviation
Colorectum (GSE201348)The image shows the transcriptomic changes along malignancy continuum.log2FC in expression of this searched gene in stem-like cells from each diseased tissue sample relative to stem-like cells in normal samples in each tissue plotted against the malignancy continuum. Samples are colored based on if they are from different disease stage.FAP: Familial adenomatous polyposis
CRC: Colorectal cancer
Colorectum (HTA11)The image shows the transcriptomic changes along malignancy continuum.log2FC in expression of this searched gene in stem-like cells from each diseased tissue sample relative to stem-like cells in normal samples in each tissue plotted against the malignancy continuum. Samples are colored based on if they are from different disease stage.AD: Adenomas
SER: Sessile serrated lesions
MSI-H: Microsatellite-high colorectal cancer
MSS: Microsatellite stable colorectal cancer
EsophagusThe image shows the transcriptomic changes along malignancy continuum.log2FC in expression of this searched gene in stem-like cells from each diseased tissue sample relative to stem-like cells in normal samples in each tissue plotted against the malignancy continuum. Samples are colored based on if they are from different disease stage.
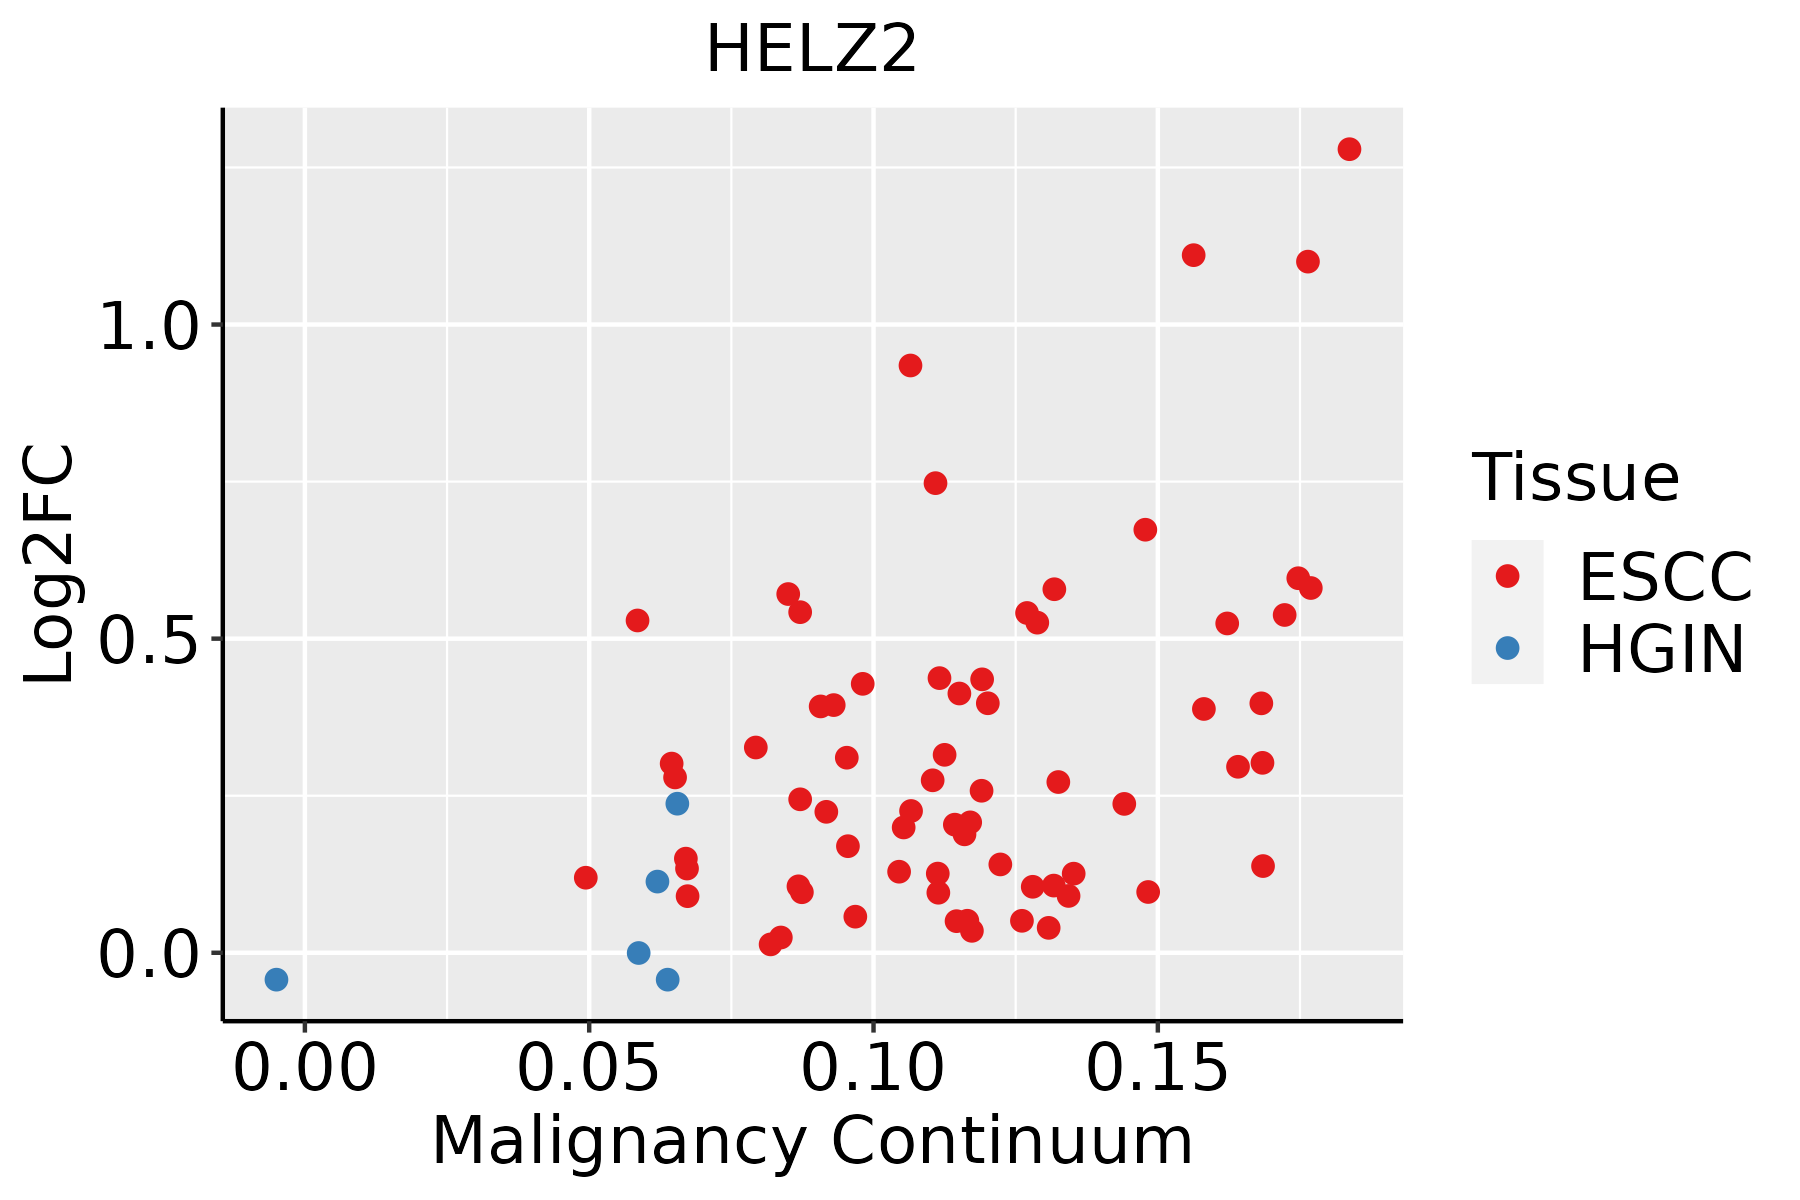
ESCC: Esophageal squamous cell carcinoma
HGIN: High-grade intraepithelial neoplasias
LGIN: Low-grade intraepithelial neoplasias
LiverThe image shows the transcriptomic changes along malignancy continuum.log2FC in expression of this searched gene in stem-like cells from each diseased tissue sample relative to stem-like cells in normal samples in each tissue plotted against the malignancy continuum. Samples are colored based on if they are from different disease stage.
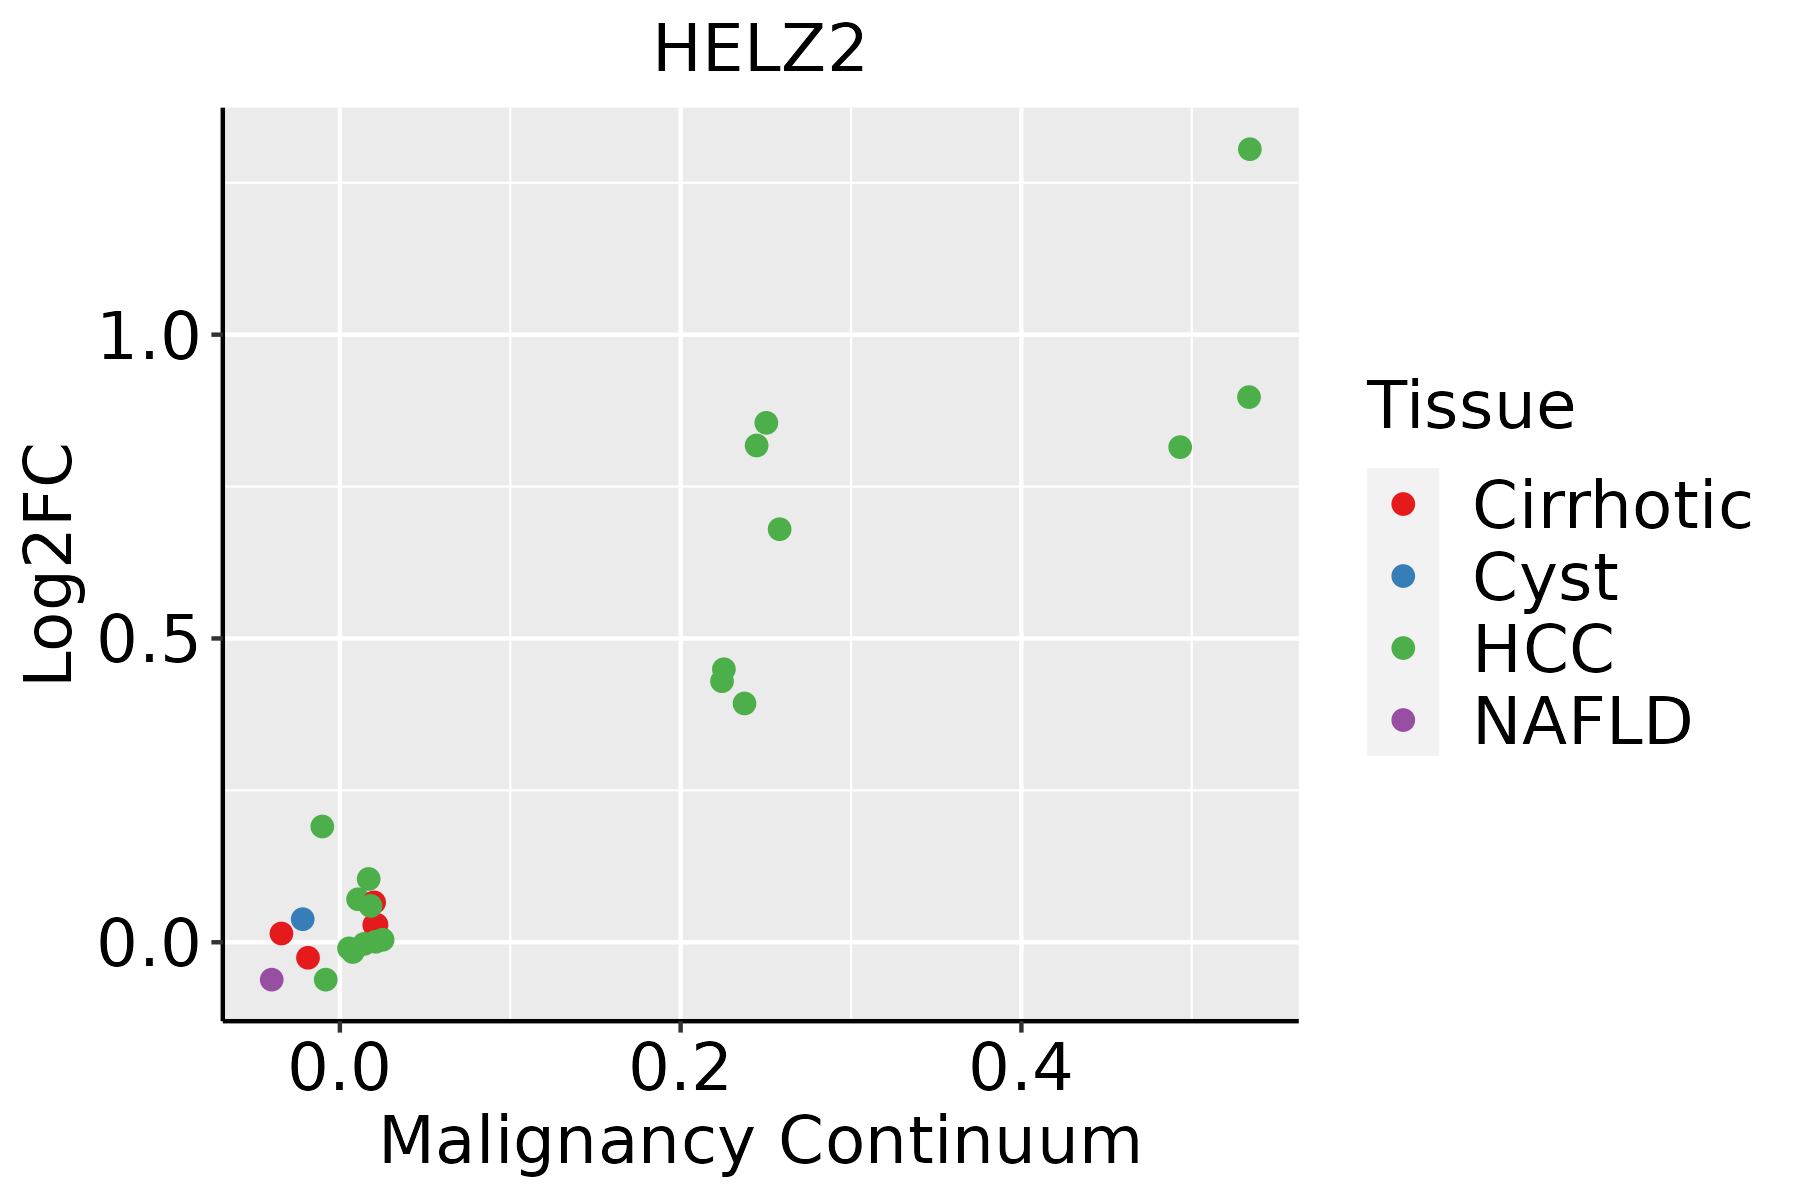
HCC: Hepatocellular carcinoma
NAFLD: Non-alcoholic fatty liver disease
Oral CavityThe image shows the transcriptomic changes along malignancy continuum.log2FC in expression of this searched gene in stem-like cells from each diseased tissue sample relative to stem-like cells in normal samples in each tissue plotted against the malignancy continuum. Samples are colored based on if they are from different disease stage.
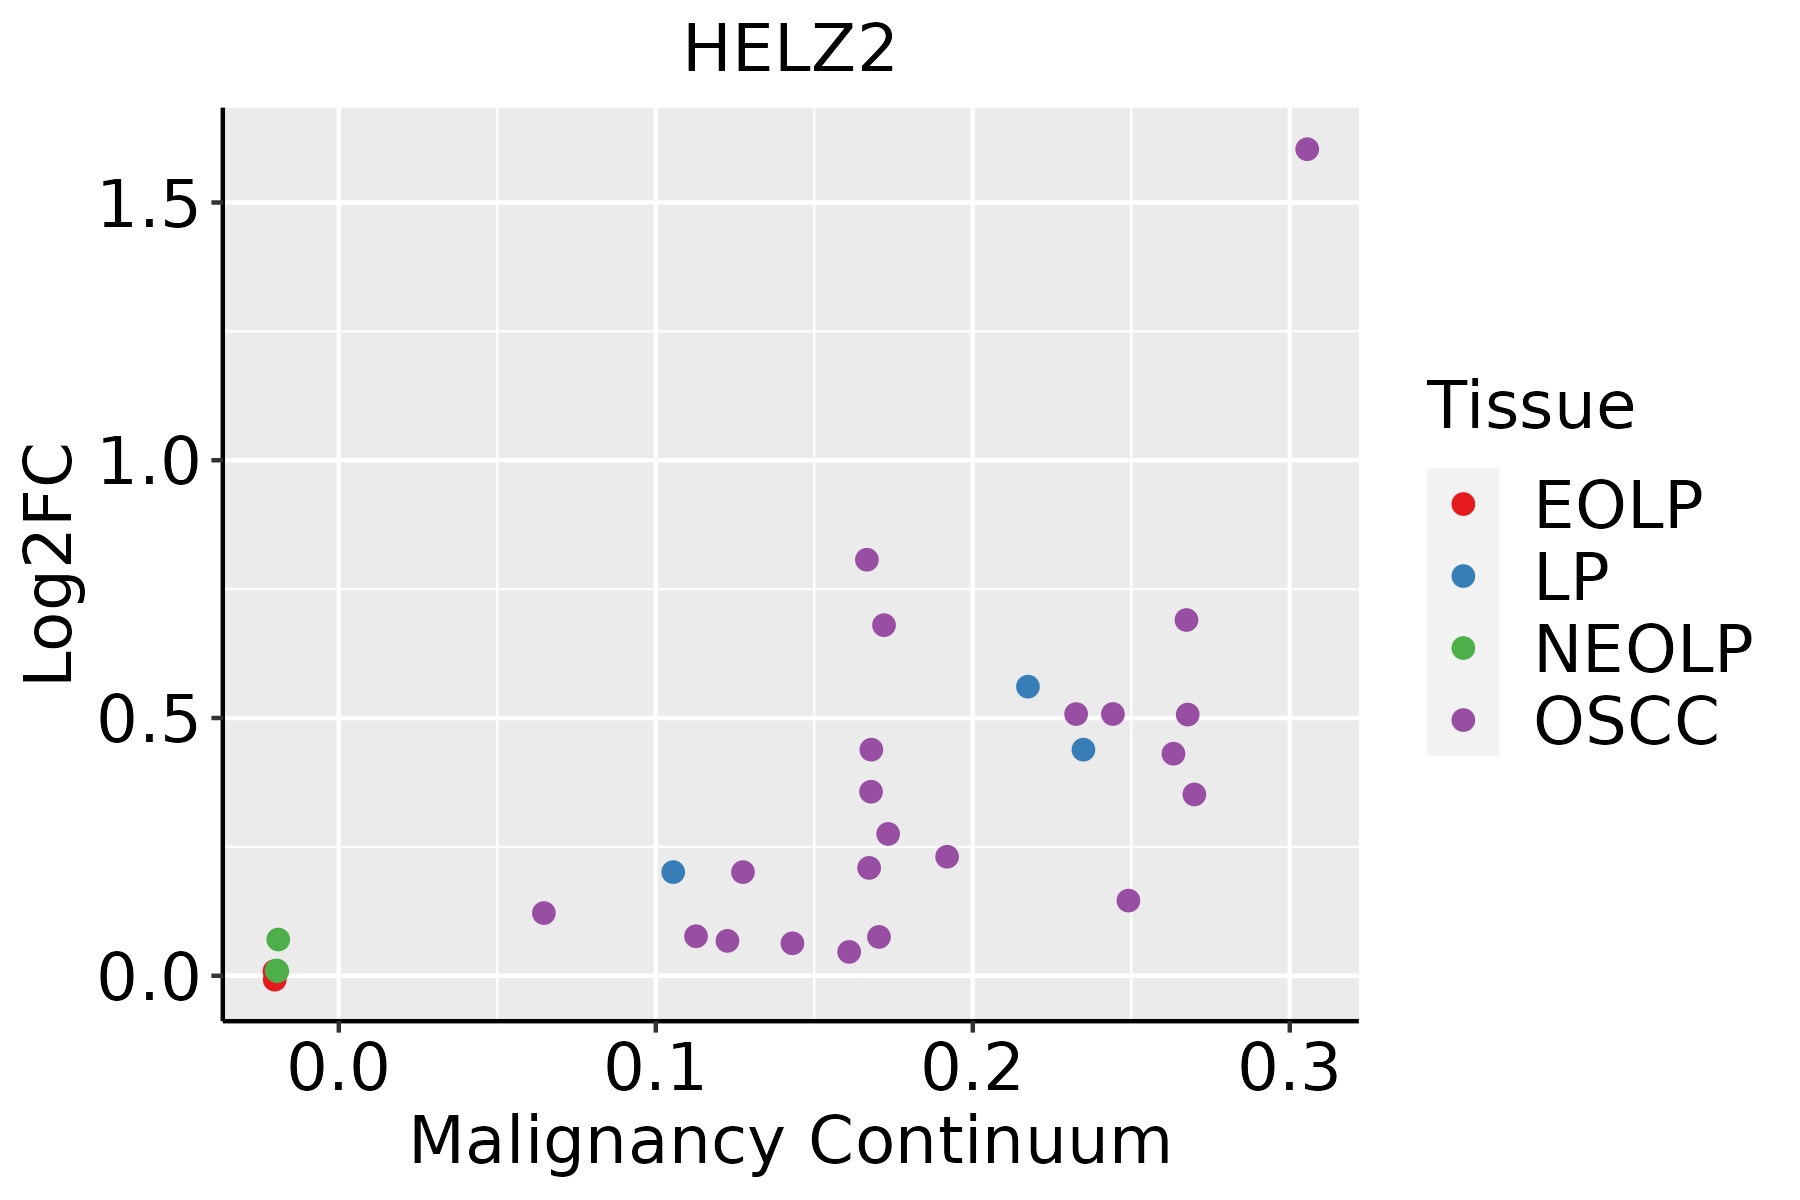
EOLP: Erosive Oral lichen planus
LP: leukoplakia
NEOLP: Non-erosive oral lichen planus
OSCC: Oral squamous cell carcinoma
SkinThe image shows the transcriptomic changes along malignancy continuum.log2FC in expression of this searched gene in stem-like cells from each diseased tissue sample relative to stem-like cells in normal samples in each tissue plotted against the malignancy continuum. Samples are colored based on if they are from different disease stage.
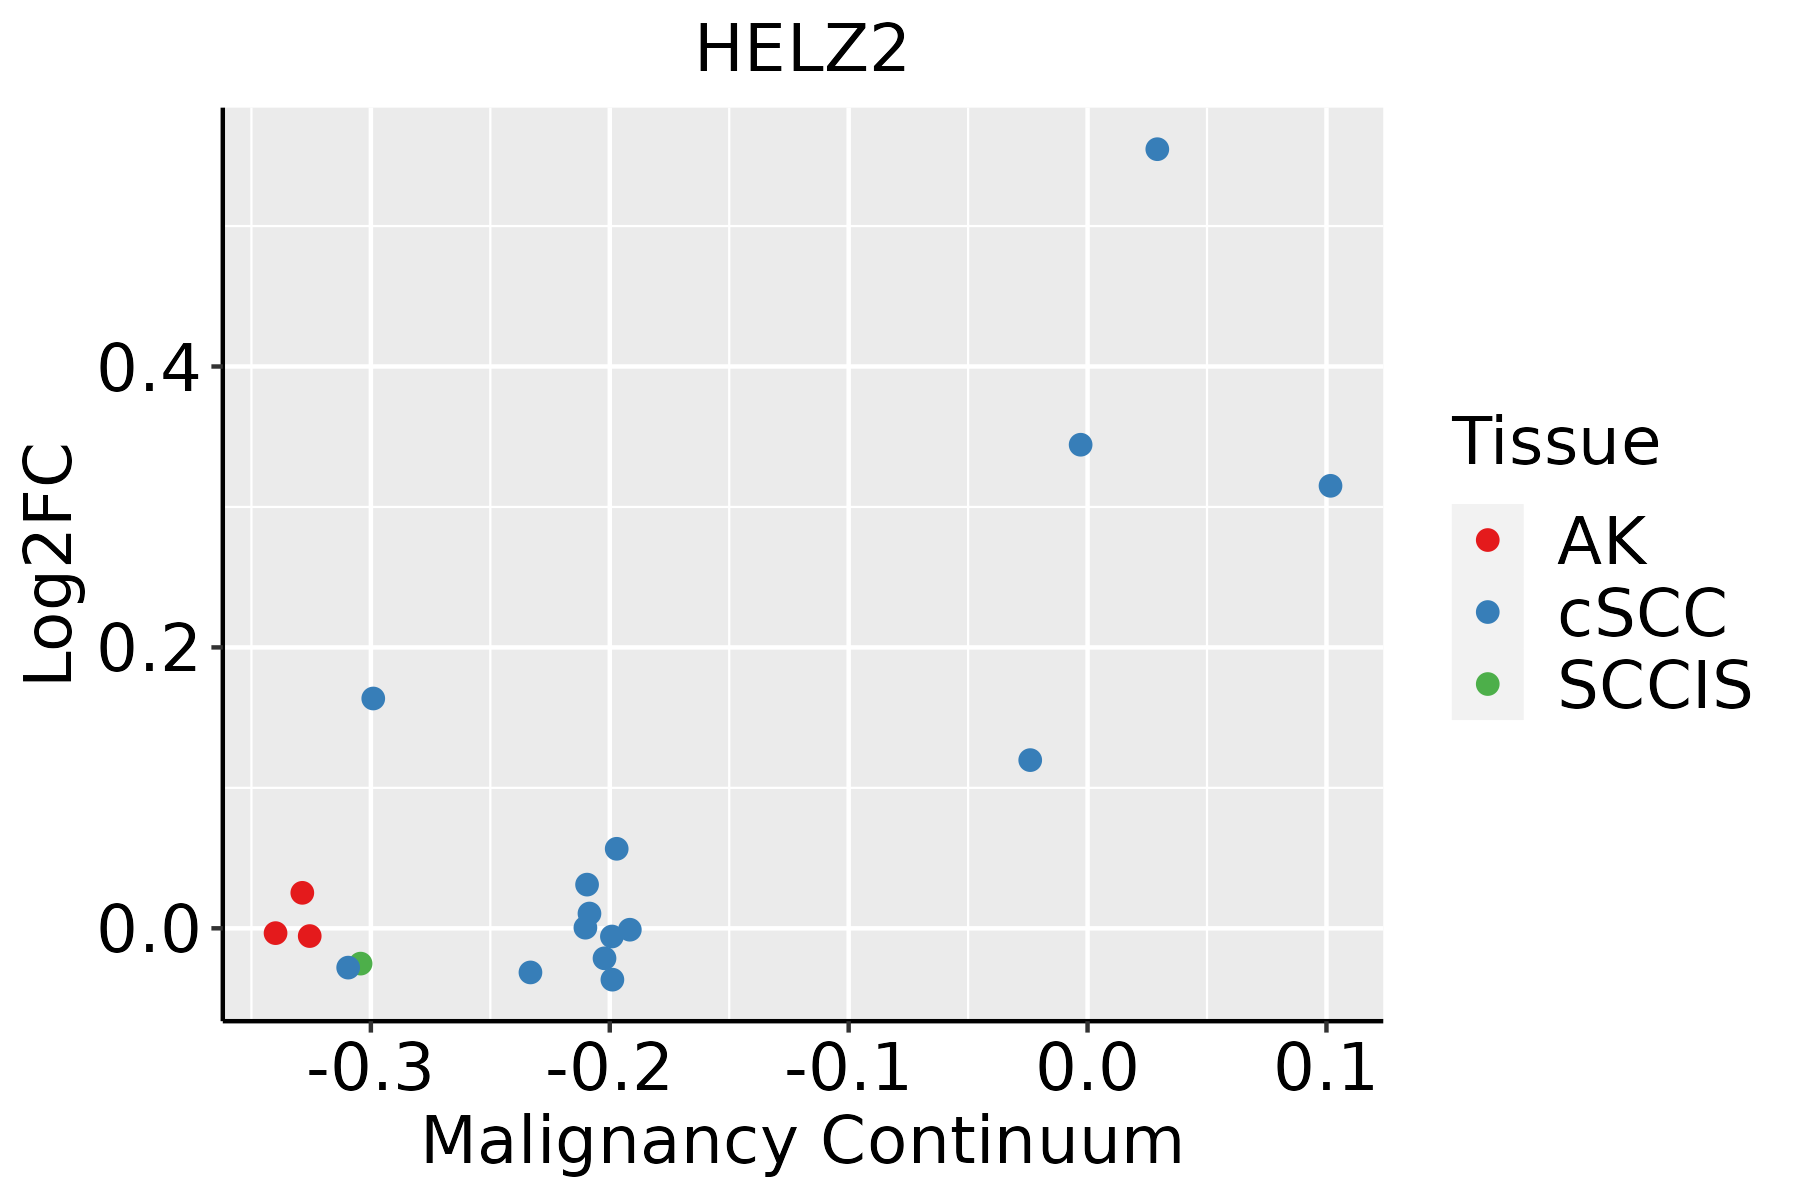
AK: Actinic keratosis
cSCC: Cutaneous squamous cell carcinoma
SCCIS:squamous cell carcinoma in situ
ThyroidThe image shows the transcriptomic changes along malignancy continuum.log2FC in expression of this searched gene in stem-like cells from each diseased tissue sample relative to stem-like cells in normal samples in each tissue plotted against the malignancy continuum. Samples are colored based on if they are from different disease stage.
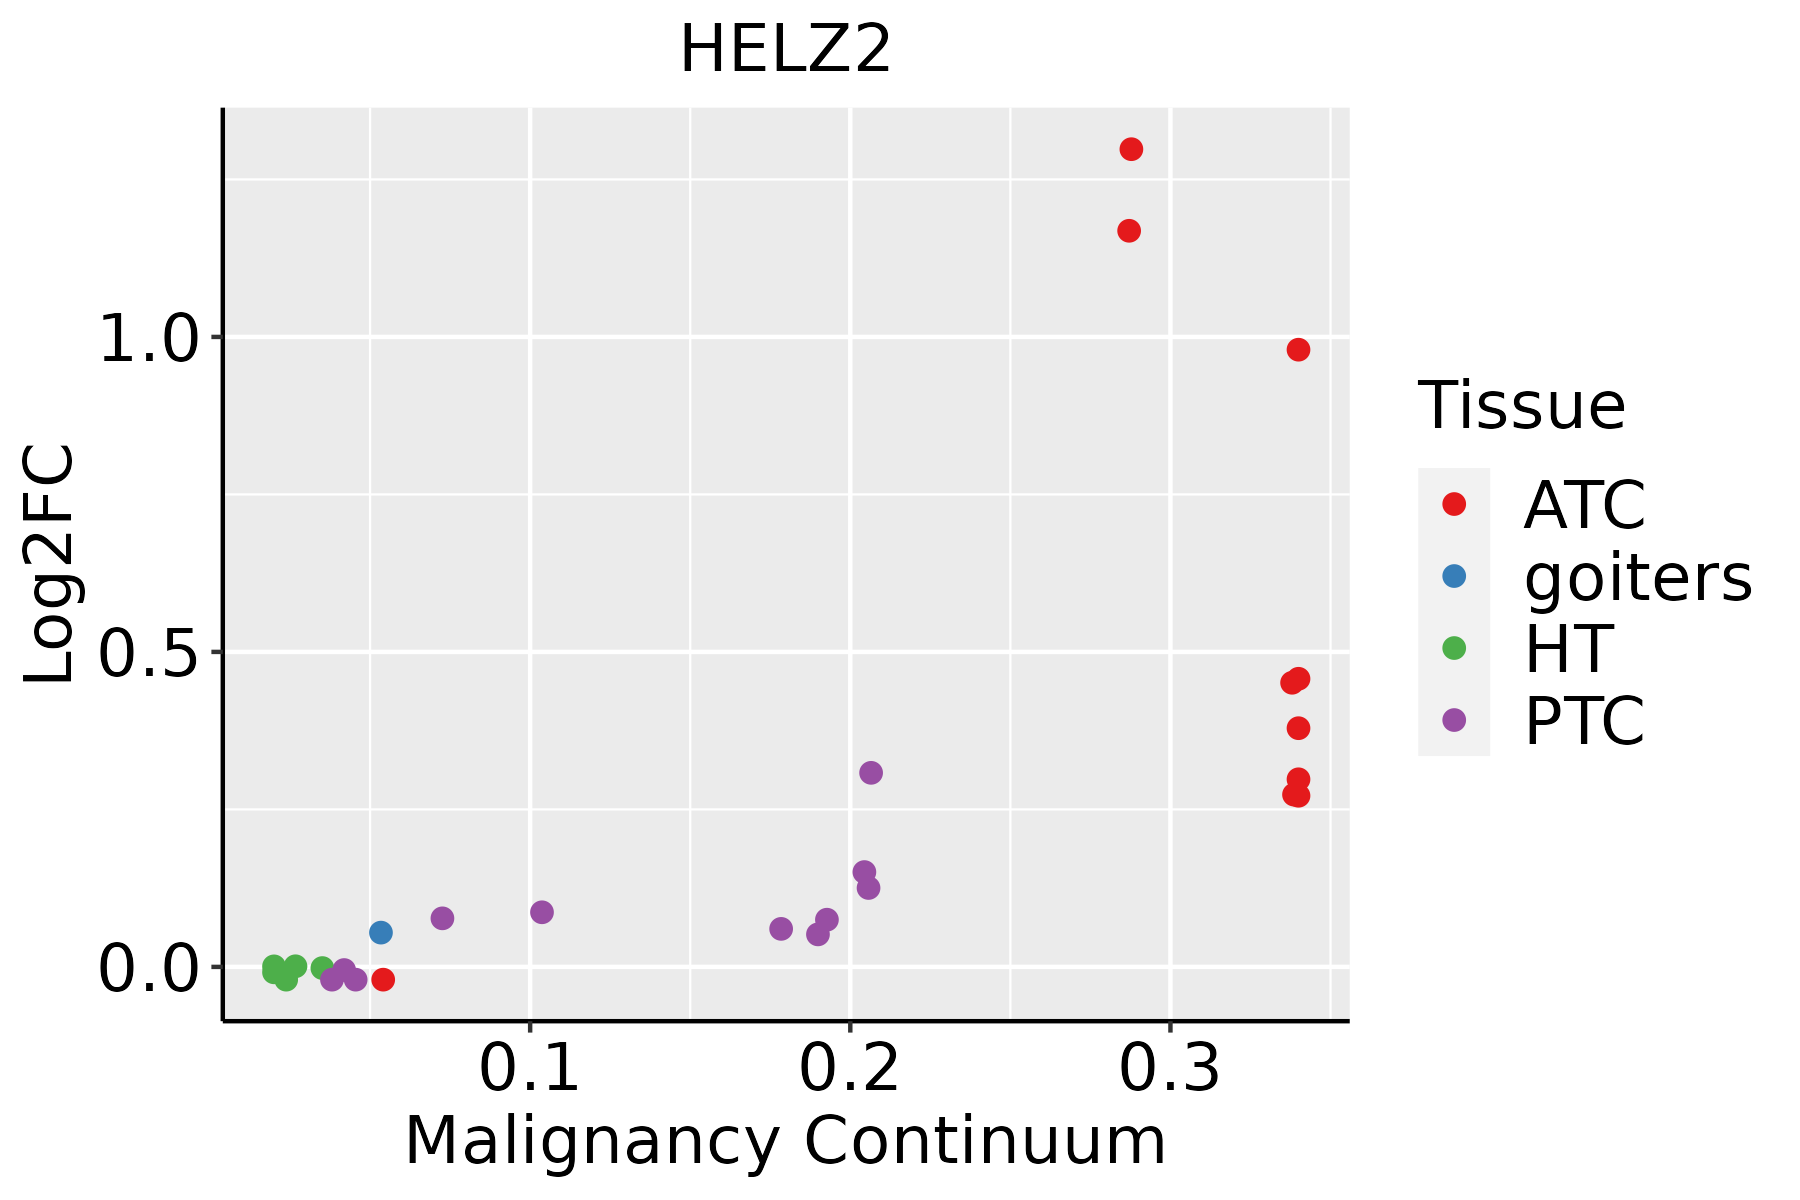
ATC: Anaplastic thyroid cancer
HT: Hashimoto's thyroiditis
PTC: Papillary thyroid cancer
∗log2FC in expression of this searched gene in stem-like cells from each diseased tissue sample relative to stem-like cells in normal samples in each tissue plotted against the malignancy continuum. Samples are colored based on if they are from different disease stage.

Top

Malignant transformation related pathway analysis

check buttonFind out the enriched GO biological processes and KEGG pathways involved in transition from healthy to precancer to cancer
check button Figure of enriched GO biological processes.
TissueDisease StageEnriched GO biological Processes
ColorectumADGO analysis - Figure of enriched GO biological processes: Top 15 enriched GO BP terms are showed in the bar plot of each disease state in each tissue. Each row represents a significant GO biological process which is colored according to the -log10(p.adjust).
ColorectumSERGO analysis - Figure of enriched GO biological processes: Top 15 enriched GO BP terms are showed in the bar plot of each disease state in each tissue. Each row represents a significant GO biological process which is colored according to the -log10(p.adjust).
ColorectumMSSGO analysis - Figure of enriched GO biological processes: Top 15 enriched GO BP terms are showed in the bar plot of each disease state in each tissue. Each row represents a significant GO biological process which is colored according to the -log10(p.adjust).
ColorectumMSI-HGO analysis - Figure of enriched GO biological processes: Top 15 enriched GO BP terms are showed in the bar plot of each disease state in each tissue. Each row represents a significant GO biological process which is colored according to the -log10(p.adjust).
ColorectumFAPGO analysis - Figure of enriched GO biological processes: Top 15 enriched GO BP terms are showed in the bar plot of each disease state in each tissue. Each row represents a significant GO biological process which is colored according to the -log10(p.adjust).
∗Top 15 enriched GO BP terms are showed in the bar plot of each disease state in each tissue. Each row represents a significant GO biological process which is colored according to the -log10(p.adjust).
Page: 1 2 3 4 5 6 7 8 9 

check button Enriched GO biological processes.
GO IDTissueDisease StageDescriptionGene RatioBg Ratiopvaluep.adjustCount
GO:0006401ColorectumADRNA catabolic process102/3918278/187238.64e-106.76e-08102
GO:0044270ColorectumADcellular nitrogen compound catabolic process147/3918451/187233.35e-092.23e-07147
GO:0046700ColorectumADheterocycle catabolic process145/3918445/187234.37e-092.84e-07145
GO:0006402ColorectumADmRNA catabolic process87/3918232/187234.40e-092.84e-0787
GO:0034655ColorectumADnucleobase-containing compound catabolic process133/3918407/187231.56e-089.12e-07133
GO:0019439ColorectumADaromatic compound catabolic process146/3918467/187237.48e-083.84e-06146
GO:1901361ColorectumADorganic cyclic compound catabolic process153/3918495/187238.23e-084.18e-06153
GO:0000956ColorectumADnuclear-transcribed mRNA catabolic process40/3918112/187232.11e-042.79e-0340
GO:00064012ColorectumMSSRNA catabolic process102/3467278/187235.07e-131.02e-10102
GO:00064022ColorectumMSSmRNA catabolic process89/3467232/187238.70e-131.60e-1089
GO:00442702ColorectumMSScellular nitrogen compound catabolic process141/3467451/187232.95e-113.83e-09141
GO:00467002ColorectumMSSheterocycle catabolic process139/3467445/187234.37e-115.05e-09139
GO:00346552ColorectumMSSnucleobase-containing compound catabolic process129/3467407/187237.48e-118.18e-09129
GO:19013612ColorectumMSSorganic cyclic compound catabolic process148/3467495/187233.47e-103.18e-08148
GO:00194392ColorectumMSSaromatic compound catabolic process140/3467467/187238.56e-106.85e-08140
GO:00009561ColorectumMSSnuclear-transcribed mRNA catabolic process42/3467112/187231.75e-065.60e-0542
GO:0000184ColorectumMSSnuclear-transcribed mRNA catabolic process, nonsense-mediated decay15/346737/187231.51e-031.39e-0215
GO:0006401110EsophagusESCCRNA catabolic process204/8552278/187233.39e-215.66e-19204
GO:0034655110EsophagusESCCnucleobase-containing compound catabolic process272/8552407/187232.92e-182.90e-16272
GO:0006402110EsophagusESCCmRNA catabolic process170/8552232/187238.70e-188.00e-16170
Page: 1 2 3 4 5 

check button Enriched KEGG pathways.
Pathway IDTissueDisease StageDescriptionGene RatioBg Ratiopvaluep.adjustqvalueCount
Page: 1 

Top

Cell-cell communication analysis

check buttonIdentification of potential cell-cell interactions between two cell types and their ligand-receptor pairs for different disease states
LigandReceptorLRpairPathwayTissueDisease Stage
Page: 1 

Top

Single-cell gene regulatory network inference analysis

check buttonFind out the significant the regulons (TFs) and the target genes of each regulon across cell types for different disease states
TFCell TypeTissueDisease StageTarget GeneRSSRegulon Activity
∗The dot plots of a searched regulon are shown for all cell subpopulations in each disease state of each tissue based on the regulon specific score inferred using pySCENIC and by calculating the average expression.
Page: 1 

Top

Somatic mutation of malignant transformation related genes

check buttonAnnotation of somatic variants for genes involved in malignant transformation
Hugo SymbolVariant ClassVariant ClassificationdbSNP RSHGVScHGVSpHGVSp ShortSWISSPROTBIOTYPESIFTPolyPhenTumor Sample BarcodeTissueHistologySexAgeStageTherapy TypesDrugsOutcome
HELZ2SNVMissense_Mutationnovelc.7378N>Ap.Ala2460Thrp.A2460TQ9BYK8protein_codingtolerated(0.39)benign(0.022)TCGA-A2-A3XY-01Breastbreast invasive carcinomaFemale<65I/IIChemotherapyadriamycinPD
HELZ2SNVMissense_Mutationc.6786G>Cp.Arg2262Serp.R2262SQ9BYK8protein_codingtolerated(0.08)benign(0.015)TCGA-AC-A23H-01Breastbreast invasive carcinomaFemale>=65I/IIUnknownUnknownPD
HELZ2SNVMissense_Mutationrs369045635c.1903C>Tp.Arg635Trpp.R635WQ9BYK8protein_codingtolerated(0.19)benign(0.003)TCGA-AO-A128-01Breastbreast invasive carcinomaFemale<65I/IIChemotherapydoxorubicinSD
HELZ2SNVMissense_Mutationc.4881N>Ap.Met1627Ilep.M1627IQ9BYK8protein_codingtolerated(1)benign(0.005)TCGA-AR-A24Q-01Breastbreast invasive carcinomaFemale<65I/IIChemotherapydoxorubicinSD
HELZ2SNVMissense_Mutationc.568G>Cp.Glu190Glnp.E190QQ9BYK8protein_codingtolerated(0.44)benign(0.003)TCGA-B6-A0RS-01Breastbreast invasive carcinomaFemale<65I/IIUnknownUnknownPD
HELZ2SNVMissense_Mutationrs151068704c.7156N>Tp.Leu2386Phep.L2386FQ9BYK8protein_codingdeleterious(0)probably_damaging(0.993)TCGA-BH-A0W7-01Breastbreast invasive carcinomaFemale<65I/IIChemotherapytaxotereCR
HELZ2SNVMissense_Mutationnovelc.3118N>Tp.Ala1040Serp.A1040SQ9BYK8protein_codingtolerated(0.73)benign(0.239)TCGA-S3-AA10-01Breastbreast invasive carcinomaFemale>=65I/IIChemotherapycytoxanCR
HELZ2SNVMissense_Mutationnovelc.3116N>Tp.Cys1039Phep.C1039FQ9BYK8protein_codingtolerated(0.18)benign(0)TCGA-S3-AA10-01Breastbreast invasive carcinomaFemale>=65I/IIChemotherapycytoxanCR
HELZ2deletionFrame_Shift_Delc.7322delNp.Lys2441ArgfsTer4p.K2441Rfs*4Q9BYK8protein_codingTCGA-D8-A27V-01Breastbreast invasive carcinomaFemale<65I/IIHormone TherapytamoxiphenSD
HELZ2SNVMissense_Mutationrs771795577c.4556N>Ap.Arg1519Hisp.R1519HQ9BYK8protein_codingdeleterious(0)probably_damaging(0.998)TCGA-2W-A8YY-01Cervixcervical & endocervical cancerFemale<65I/IIChemotherapycisplatinCR
Page: 1 2 3 4 5 6 7 8 9 10 11 12 13 14 15 16 17 18 19 20 21 

Top

Related drugs of malignant transformation related genes

check buttonIdentification of chemicals and drugs interact with genes involved in malignant transfromation
(DGIdb 4.0)
Entrez IDSymbolCategoryInteraction TypesDrug Claim NameDrug NamePMIDs
Page: 1