
|
|||||
|
 | |
| |
| |
| |
| |
| |
|
Gene: HELQ |
Gene summary for HELQ |
| Gene information | Species | Human | Gene symbol | HELQ | Gene ID | 113510 |
| Gene name | helicase, POLQ like | |
| Gene Alias | HEL308 | |
| Cytomap | 4q21.23 | |
| Gene Type | protein-coding | GO ID | GO:0000724 | UniProtAcc | Q8TDG4 |
Top |
Malignant transformation analysis |
| Identification of the aberrant gene expression in precancerous and cancerous lesions by comparing the gene expression of stem-like cells in diseased tissues with normal stem cells |
| Entrez ID | Symbol | Replicates | Species | Organ | Tissue | Adj P-value | Log2FC | Malignancy |
| 113510 | HELQ | LZE4T | Human | Esophagus | ESCC | 4.04e-05 | 1.15e-01 | 0.0811 |
| 113510 | HELQ | LZE24T | Human | Esophagus | ESCC | 6.80e-10 | 1.19e-01 | 0.0596 |
| 113510 | HELQ | P1T-E | Human | Esophagus | ESCC | 2.42e-03 | 1.85e-01 | 0.0875 |
| 113510 | HELQ | P2T-E | Human | Esophagus | ESCC | 2.88e-25 | 3.10e-01 | 0.1177 |
| 113510 | HELQ | P4T-E | Human | Esophagus | ESCC | 2.48e-10 | 2.23e-01 | 0.1323 |
| 113510 | HELQ | P5T-E | Human | Esophagus | ESCC | 1.98e-04 | 4.61e-02 | 0.1327 |
| 113510 | HELQ | P8T-E | Human | Esophagus | ESCC | 2.83e-11 | 1.02e-01 | 0.0889 |
| 113510 | HELQ | P9T-E | Human | Esophagus | ESCC | 4.25e-04 | 8.44e-02 | 0.1131 |
| 113510 | HELQ | P10T-E | Human | Esophagus | ESCC | 1.11e-13 | 1.54e-01 | 0.116 |
| 113510 | HELQ | P11T-E | Human | Esophagus | ESCC | 1.81e-04 | 2.71e-01 | 0.1426 |
| 113510 | HELQ | P12T-E | Human | Esophagus | ESCC | 3.29e-10 | 2.16e-01 | 0.1122 |
| 113510 | HELQ | P15T-E | Human | Esophagus | ESCC | 6.84e-05 | 1.49e-01 | 0.1149 |
| 113510 | HELQ | P16T-E | Human | Esophagus | ESCC | 1.73e-15 | 2.17e-01 | 0.1153 |
| 113510 | HELQ | P20T-E | Human | Esophagus | ESCC | 6.65e-04 | 7.70e-02 | 0.1124 |
| 113510 | HELQ | P21T-E | Human | Esophagus | ESCC | 2.54e-06 | 9.14e-02 | 0.1617 |
| 113510 | HELQ | P22T-E | Human | Esophagus | ESCC | 8.20e-11 | 1.40e-01 | 0.1236 |
| 113510 | HELQ | P23T-E | Human | Esophagus | ESCC | 1.82e-06 | 1.41e-01 | 0.108 |
| 113510 | HELQ | P24T-E | Human | Esophagus | ESCC | 3.29e-08 | 8.88e-02 | 0.1287 |
| 113510 | HELQ | P26T-E | Human | Esophagus | ESCC | 6.46e-21 | 3.66e-01 | 0.1276 |
| 113510 | HELQ | P27T-E | Human | Esophagus | ESCC | 5.21e-16 | 1.59e-01 | 0.1055 |
| Page: 1 2 3 |
| Tissue | Expression Dynamics | Abbreviation |
| Esophagus | 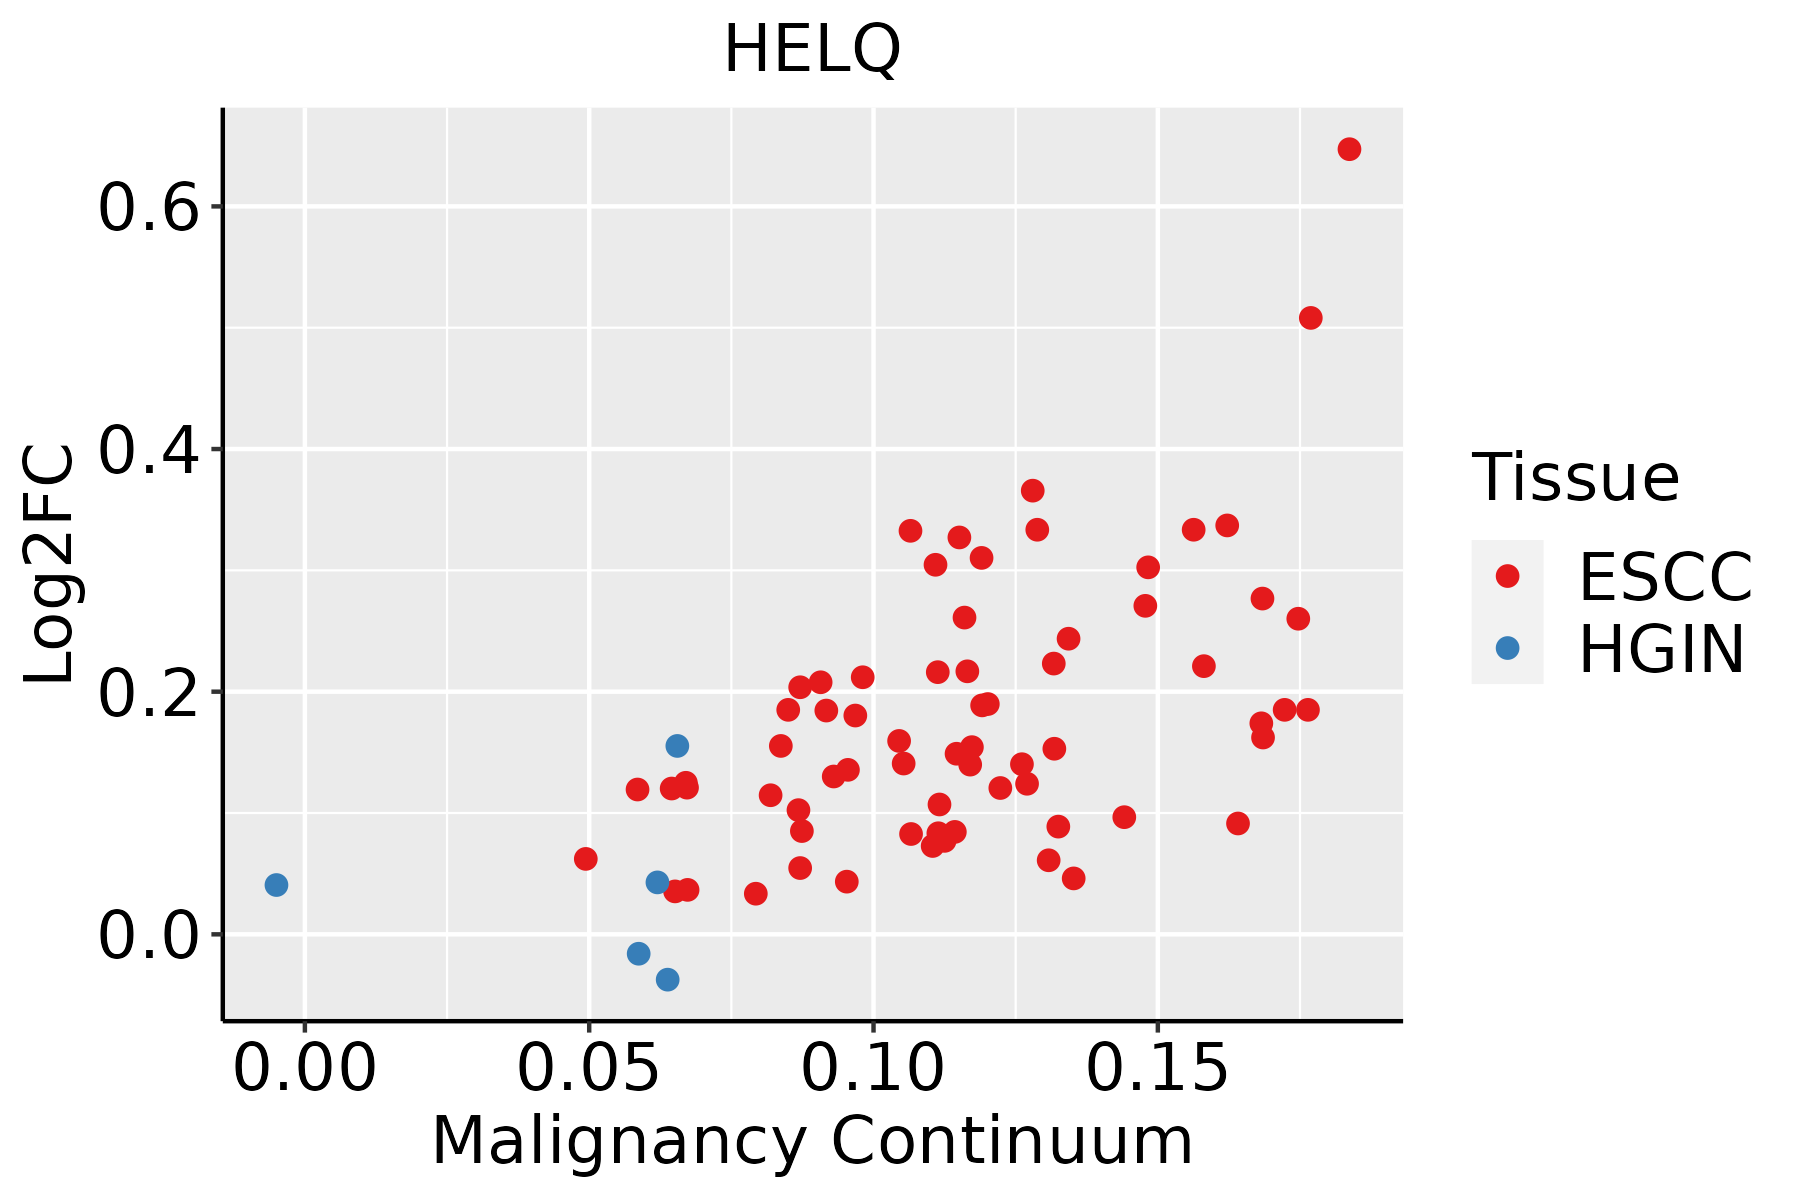 | ESCC: Esophageal squamous cell carcinoma |
| HGIN: High-grade intraepithelial neoplasias | ||
| LGIN: Low-grade intraepithelial neoplasias |
| ∗log2FC in expression of this searched gene in stem-like cells from each diseased tissue sample relative to stem-like cells in normal samples in each tissue plotted against the malignancy continuum. Samples are colored based on if they are from different disease stage. |
Top |
Malignant transformation related pathway analysis |
| Find out the enriched GO biological processes and KEGG pathways involved in transition from healthy to precancer to cancer |
| Tissue | Disease Stage | Enriched GO biological Processes |
| Colorectum | AD |  |
| Colorectum | SER |  |
| Colorectum | MSS |  |
| Colorectum | MSI-H |  |
| Colorectum | FAP |  |
| ∗Top 15 enriched GO BP terms are showed in the bar plot of each disease state in each tissue. Each row represents a significant GO biological process which is colored according to the -log10(p.adjust). |
| Page: 1 2 3 4 5 6 7 8 9 |
| GO ID | Tissue | Disease Stage | Description | Gene Ratio | Bg Ratio | pvalue | p.adjust | Count |
| GO:0022613111 | Esophagus | ESCC | ribonucleoprotein complex biogenesis | 365/8552 | 463/18723 | 1.74e-49 | 1.11e-45 | 365 |
| GO:0042254111 | Esophagus | ESCC | ribosome biogenesis | 252/8552 | 299/18723 | 3.27e-44 | 1.04e-40 | 252 |
| GO:003447015 | Esophagus | ESCC | ncRNA processing | 300/8552 | 395/18723 | 3.09e-35 | 3.26e-32 | 300 |
| GO:0016072110 | Esophagus | ESCC | rRNA metabolic process | 197/8552 | 236/18723 | 1.31e-33 | 1.18e-30 | 197 |
| GO:0006364110 | Esophagus | ESCC | rRNA processing | 189/8552 | 225/18723 | 4.88e-33 | 3.87e-30 | 189 |
| GO:003466012 | Esophagus | ESCC | ncRNA metabolic process | 346/8552 | 485/18723 | 4.35e-31 | 2.51e-28 | 346 |
| GO:00063024 | Esophagus | ESCC | double-strand break repair | 152/8552 | 251/18723 | 1.33e-06 | 1.62e-05 | 152 |
| GO:003239214 | Esophagus | ESCC | DNA geometric change | 62/8552 | 90/18723 | 7.02e-06 | 7.04e-05 | 62 |
| GO:003250813 | Esophagus | ESCC | DNA duplex unwinding | 58/8552 | 84/18723 | 1.23e-05 | 1.14e-04 | 58 |
| GO:00063101 | Esophagus | ESCC | DNA recombination | 168/8552 | 305/18723 | 5.58e-04 | 3.05e-03 | 168 |
| GO:00007241 | Esophagus | ESCC | double-strand break repair via homologous recombination | 79/8552 | 138/18723 | 4.05e-03 | 1.62e-02 | 79 |
| GO:00007251 | Esophagus | ESCC | recombinational repair | 80/8552 | 140/18723 | 4.10e-03 | 1.63e-02 | 80 |
| Page: 1 |
| Pathway ID | Tissue | Disease Stage | Description | Gene Ratio | Bg Ratio | pvalue | p.adjust | qvalue | Count |
| Page: 1 |
Top |
Cell-cell communication analysis |
| Identification of potential cell-cell interactions between two cell types and their ligand-receptor pairs for different disease states |
| Ligand | Receptor | LRpair | Pathway | Tissue | Disease Stage |
| Page: 1 |
Top |
Single-cell gene regulatory network inference analysis |
| Find out the significant the regulons (TFs) and the target genes of each regulon across cell types for different disease states |
| TF | Cell Type | Tissue | Disease Stage | Target Gene | RSS | Regulon Activity |
| ∗The dot plots of a searched regulon are shown for all cell subpopulations in each disease state of each tissue based on the regulon specific score inferred using pySCENIC and by calculating the average expression. |
| Page: 1 |
Top |
Somatic mutation of malignant transformation related genes |
| Annotation of somatic variants for genes involved in malignant transformation |
| Hugo Symbol | Variant Class | Variant Classification | dbSNP RS | HGVSc | HGVSp | HGVSp Short | SWISSPROT | BIOTYPE | SIFT | PolyPhen | Tumor Sample Barcode | Tissue | Histology | Sex | Age | Stage | Therapy Types | Drugs | Outcome |
| HELQ | SNV | Missense_Mutation | c.2312A>C | p.Asp771Ala | p.D771A | Q8TDG4 | protein_coding | tolerated(0.5) | benign(0.003) | TCGA-AN-A0FL-01 | Breast | breast invasive carcinoma | Female | <65 | I/II | Unknown | Unknown | SD | |
| HELQ | SNV | Missense_Mutation | c.358N>G | p.Ile120Val | p.I120V | Q8TDG4 | protein_coding | deleterious_low_confidence(0.02) | benign(0.003) | TCGA-AO-A128-01 | Breast | breast invasive carcinoma | Female | <65 | I/II | Chemotherapy | doxorubicin | SD | |
| HELQ | SNV | Missense_Mutation | c.1805N>A | p.Ser602Asn | p.S602N | Q8TDG4 | protein_coding | tolerated(0.52) | benign(0) | TCGA-BH-A0HF-01 | Breast | breast invasive carcinoma | Female | >=65 | I/II | Hormone Therapy | arimidex | SD | |
| HELQ | SNV | Missense_Mutation | rs148996864 | c.2503C>T | p.Arg835Cys | p.R835C | Q8TDG4 | protein_coding | deleterious(0.02) | benign(0.037) | TCGA-BH-A18G-01 | Breast | breast invasive carcinoma | Female | >=65 | I/II | Unknown | Unknown | SD |
| HELQ | SNV | Missense_Mutation | c.1208G>C | p.Ser403Thr | p.S403T | Q8TDG4 | protein_coding | tolerated(0.12) | benign(0.007) | TCGA-C8-A26Y-01 | Breast | breast invasive carcinoma | Female | >=65 | I/II | Unknown | Unknown | SD | |
| HELQ | SNV | Missense_Mutation | c.1784N>G | p.Glu595Gly | p.E595G | Q8TDG4 | protein_coding | tolerated(0.27) | benign(0.003) | TCGA-E2-A1IN-01 | Breast | breast invasive carcinoma | Female | <65 | I/II | Hormone Therapy | arimidex | SD | |
| HELQ | SNV | Missense_Mutation | novel | c.92C>A | p.Ala31Glu | p.A31E | Q8TDG4 | protein_coding | tolerated_low_confidence(0.39) | benign(0.005) | TCGA-S3-AA10-01 | Breast | breast invasive carcinoma | Female | >=65 | I/II | Chemotherapy | cytoxan | CR |
| HELQ | SNV | Missense_Mutation | rs749332346 | c.3139N>A | p.Val1047Ile | p.V1047I | Q8TDG4 | protein_coding | tolerated(0.6) | benign(0.003) | TCGA-C5-A3HE-01 | Cervix | cervical & endocervical cancer | Female | <65 | I/II | Unknown | Unknown | PD |
| HELQ | SNV | Missense_Mutation | c.1788N>A | p.Met596Ile | p.M596I | Q8TDG4 | protein_coding | deleterious(0.01) | benign(0.184) | TCGA-DS-A0VN-01 | Cervix | cervical & endocervical cancer | Female | <65 | I/II | Chemotherapy | cisplatin | SD | |
| HELQ | SNV | Missense_Mutation | c.2401N>A | p.Glu801Lys | p.E801K | Q8TDG4 | protein_coding | tolerated(0.14) | benign(0.003) | TCGA-EK-A3GK-01 | Cervix | cervical & endocervical cancer | Female | <65 | I/II | Unknown | Unknown | SD |
| Page: 1 2 3 4 5 6 7 8 9 10 11 12 13 |
Top |
Related drugs of malignant transformation related genes |
| Identification of chemicals and drugs interact with genes involved in malignant transfromation |
| (DGIdb 4.0) |
| Entrez ID | Symbol | Category | Interaction Types | Drug Claim Name | Drug Name | PMIDs |
| Page: 1 |

Copyright 2023-Present -The University of Texas Health Science Center at Houston |