
|
|||||
|
 | |
| |
| |
| |
| |
| |
|
Gene: HEG1 |
Gene summary for HEG1 |
| Gene information | Species | Human | Gene symbol | HEG1 | Gene ID | 57493 |
| Gene name | heart development protein with EGF like domains 1 | |
| Gene Alias | HEG | |
| Cytomap | 3q21.2 | |
| Gene Type | protein-coding | GO ID | GO:0000902 | UniProtAcc | Q9ULI3 |
Top |
Malignant transformation analysis |
| Identification of the aberrant gene expression in precancerous and cancerous lesions by comparing the gene expression of stem-like cells in diseased tissues with normal stem cells |
| Entrez ID | Symbol | Replicates | Species | Organ | Tissue | Adj P-value | Log2FC | Malignancy |
| 57493 | HEG1 | LZE4T | Human | Esophagus | ESCC | 2.71e-04 | 1.29e-01 | 0.0811 |
| 57493 | HEG1 | P2T-E | Human | Esophagus | ESCC | 4.94e-10 | 2.67e-01 | 0.1177 |
| 57493 | HEG1 | P8T-E | Human | Esophagus | ESCC | 1.58e-07 | 2.39e-01 | 0.0889 |
| 57493 | HEG1 | P9T-E | Human | Esophagus | ESCC | 2.90e-07 | 3.69e-01 | 0.1131 |
| 57493 | HEG1 | P10T-E | Human | Esophagus | ESCC | 7.66e-11 | 2.58e-01 | 0.116 |
| 57493 | HEG1 | P11T-E | Human | Esophagus | ESCC | 1.70e-12 | 6.93e-01 | 0.1426 |
| 57493 | HEG1 | P12T-E | Human | Esophagus | ESCC | 2.59e-05 | 1.21e-01 | 0.1122 |
| 57493 | HEG1 | P16T-E | Human | Esophagus | ESCC | 2.40e-04 | 5.05e-04 | 0.1153 |
| 57493 | HEG1 | P20T-E | Human | Esophagus | ESCC | 2.69e-02 | 1.03e-01 | 0.1124 |
| 57493 | HEG1 | P21T-E | Human | Esophagus | ESCC | 1.09e-09 | 3.04e-01 | 0.1617 |
| 57493 | HEG1 | P22T-E | Human | Esophagus | ESCC | 2.35e-04 | 9.65e-02 | 0.1236 |
| 57493 | HEG1 | P26T-E | Human | Esophagus | ESCC | 3.89e-03 | 8.70e-02 | 0.1276 |
| 57493 | HEG1 | P27T-E | Human | Esophagus | ESCC | 1.33e-03 | 1.45e-01 | 0.1055 |
| 57493 | HEG1 | P28T-E | Human | Esophagus | ESCC | 1.01e-07 | 1.69e-01 | 0.1149 |
| 57493 | HEG1 | P30T-E | Human | Esophagus | ESCC | 6.40e-08 | 5.46e-01 | 0.137 |
| 57493 | HEG1 | P31T-E | Human | Esophagus | ESCC | 3.98e-04 | 1.04e-01 | 0.1251 |
| 57493 | HEG1 | P32T-E | Human | Esophagus | ESCC | 4.78e-11 | 3.08e-01 | 0.1666 |
| 57493 | HEG1 | P37T-E | Human | Esophagus | ESCC | 9.03e-15 | 3.68e-01 | 0.1371 |
| 57493 | HEG1 | P40T-E | Human | Esophagus | ESCC | 7.36e-06 | 1.49e-01 | 0.109 |
| 57493 | HEG1 | P44T-E | Human | Esophagus | ESCC | 6.58e-05 | 2.99e-01 | 0.1096 |
| Page: 1 2 3 4 |
| Tissue | Expression Dynamics | Abbreviation |
| Esophagus |  | ESCC: Esophageal squamous cell carcinoma |
| HGIN: High-grade intraepithelial neoplasias | ||
| LGIN: Low-grade intraepithelial neoplasias | ||
| Oral Cavity | 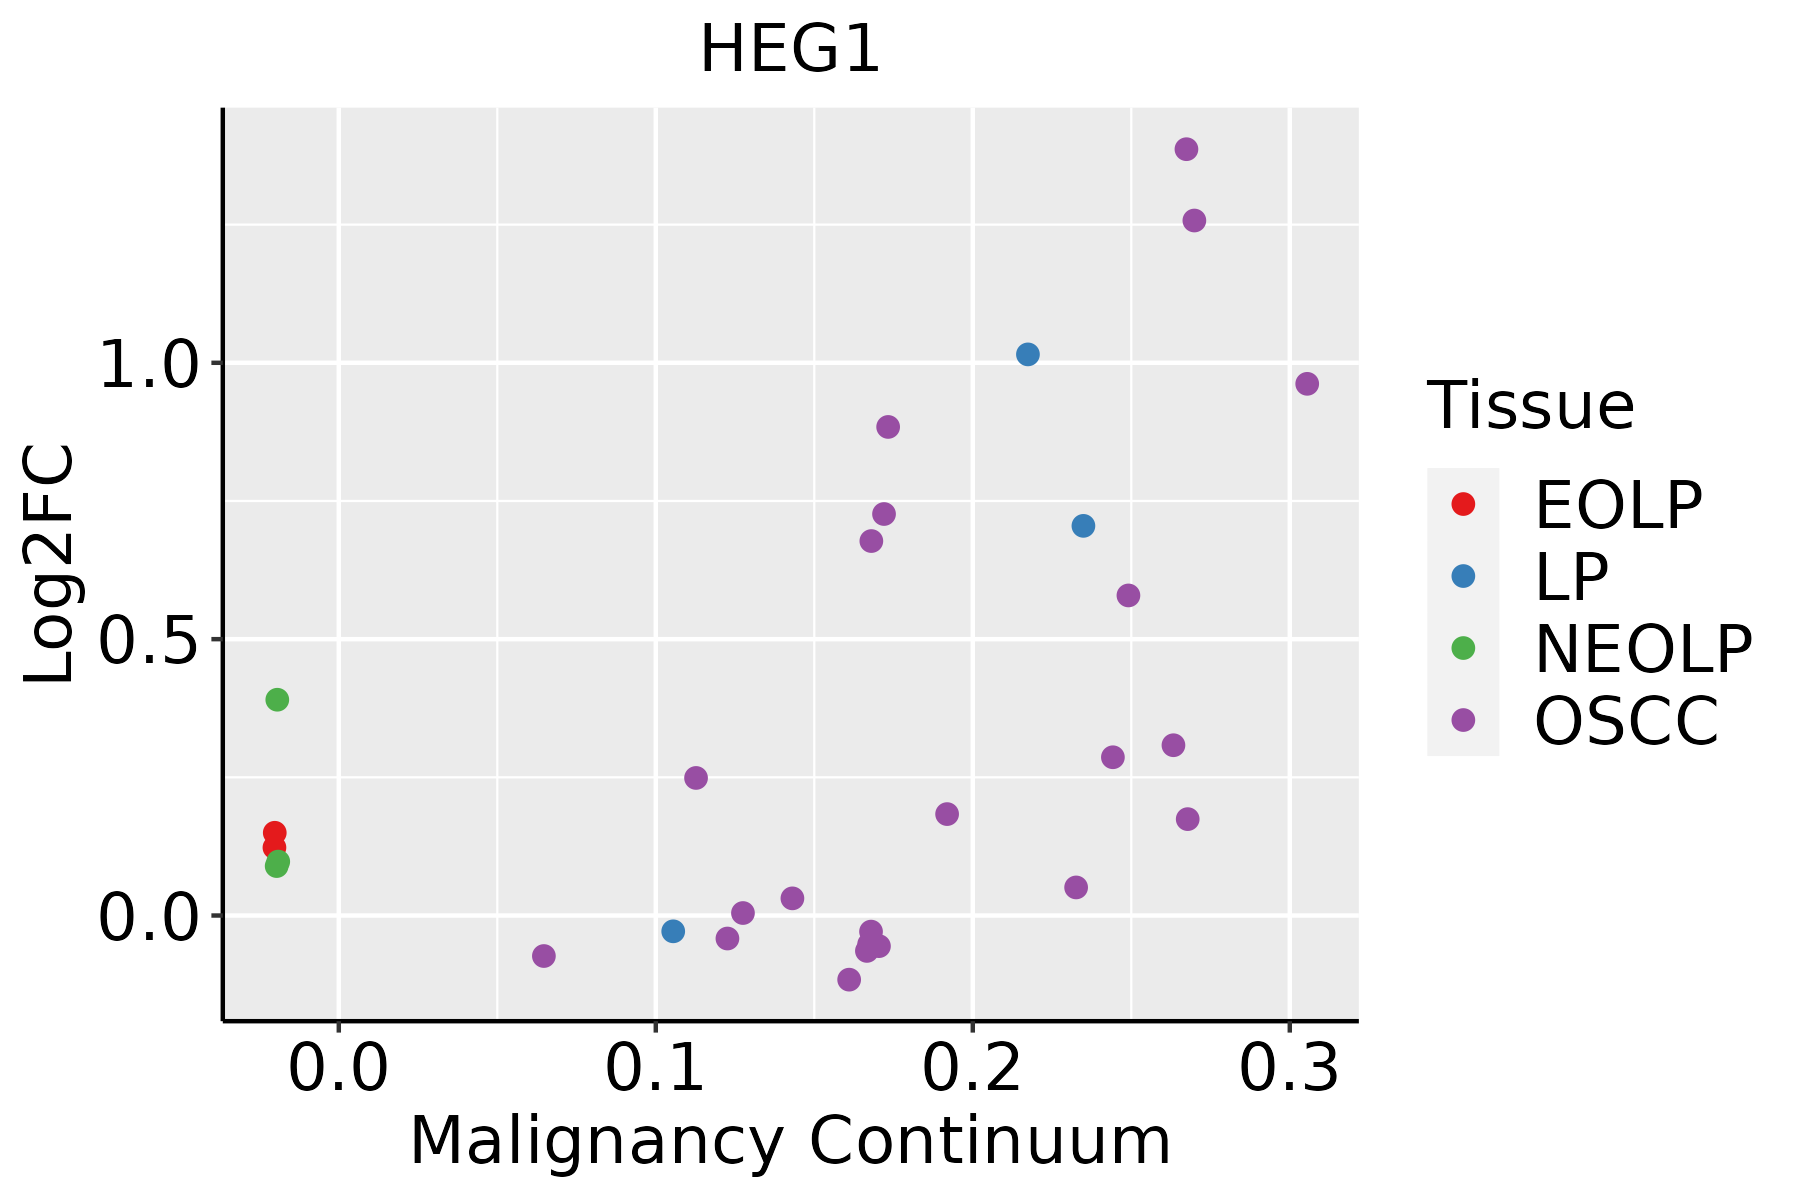 | EOLP: Erosive Oral lichen planus |
| LP: leukoplakia | ||
| NEOLP: Non-erosive oral lichen planus | ||
| OSCC: Oral squamous cell carcinoma | ||
| Thyroid |  | ATC: Anaplastic thyroid cancer |
| HT: Hashimoto's thyroiditis | ||
| PTC: Papillary thyroid cancer |
| ∗log2FC in expression of this searched gene in stem-like cells from each diseased tissue sample relative to stem-like cells in normal samples in each tissue plotted against the malignancy continuum. Samples are colored based on if they are from different disease stage. |
Top |
Malignant transformation related pathway analysis |
| Find out the enriched GO biological processes and KEGG pathways involved in transition from healthy to precancer to cancer |
| Tissue | Disease Stage | Enriched GO biological Processes |
| Colorectum | AD |  |
| Colorectum | SER |  |
| Colorectum | MSS |  |
| Colorectum | MSI-H |  |
| Colorectum | FAP |  |
| ∗Top 15 enriched GO BP terms are showed in the bar plot of each disease state in each tissue. Each row represents a significant GO biological process which is colored according to the -log10(p.adjust). |
| Page: 1 2 3 4 5 6 7 8 9 |
| GO ID | Tissue | Disease Stage | Description | Gene Ratio | Bg Ratio | pvalue | p.adjust | Count |
| GO:000170119 | Esophagus | ESCC | in utero embryonic development | 243/8552 | 367/18723 | 1.00e-15 | 6.86e-14 | 243 |
| GO:0010563111 | Esophagus | ESCC | negative regulation of phosphorus metabolic process | 274/8552 | 442/18723 | 2.32e-12 | 9.41e-11 | 274 |
| GO:0045936111 | Esophagus | ESCC | negative regulation of phosphate metabolic process | 273/8552 | 441/18723 | 3.18e-12 | 1.25e-10 | 273 |
| GO:0051348111 | Esophagus | ESCC | negative regulation of transferase activity | 177/8552 | 268/18723 | 1.08e-11 | 4.00e-10 | 177 |
| GO:007190016 | Esophagus | ESCC | regulation of protein serine/threonine kinase activity | 227/8552 | 359/18723 | 1.12e-11 | 4.10e-10 | 227 |
| GO:0042326111 | Esophagus | ESCC | negative regulation of phosphorylation | 237/8552 | 385/18723 | 1.86e-10 | 5.33e-09 | 237 |
| GO:0001933111 | Esophagus | ESCC | negative regulation of protein phosphorylation | 213/8552 | 342/18723 | 3.54e-10 | 9.76e-09 | 213 |
| GO:003367319 | Esophagus | ESCC | negative regulation of kinase activity | 154/8552 | 237/18723 | 1.38e-09 | 3.27e-08 | 154 |
| GO:000646920 | Esophagus | ESCC | negative regulation of protein kinase activity | 140/8552 | 212/18723 | 1.53e-09 | 3.56e-08 | 140 |
| GO:000726510 | Esophagus | ESCC | Ras protein signal transduction | 201/8552 | 337/18723 | 1.44e-07 | 2.30e-06 | 201 |
| GO:00905599 | Esophagus | ESCC | regulation of membrane permeability | 58/8552 | 78/18723 | 2.38e-07 | 3.61e-06 | 58 |
| GO:000206420 | Esophagus | ESCC | epithelial cell development | 136/8552 | 220/18723 | 9.50e-07 | 1.21e-05 | 136 |
| GO:00303239 | Esophagus | ESCC | respiratory tube development | 112/8552 | 181/18723 | 7.82e-06 | 7.69e-05 | 112 |
| GO:00097919 | Esophagus | ESCC | post-embryonic development | 56/8552 | 80/18723 | 9.08e-06 | 8.71e-05 | 56 |
| GO:00605417 | Esophagus | ESCC | respiratory system development | 123/8552 | 203/18723 | 1.26e-05 | 1.15e-04 | 123 |
| GO:00303249 | Esophagus | ESCC | lung development | 109/8552 | 177/18723 | 1.40e-05 | 1.27e-04 | 109 |
| GO:00719014 | Esophagus | ESCC | negative regulation of protein serine/threonine kinase activity | 75/8552 | 120/18723 | 1.48e-04 | 9.88e-04 | 75 |
| GO:000188510 | Esophagus | ESCC | endothelial cell development | 44/8552 | 64/18723 | 1.59e-04 | 1.05e-03 | 44 |
| GO:003432918 | Esophagus | ESCC | cell junction assembly | 227/8552 | 420/18723 | 3.06e-04 | 1.83e-03 | 227 |
| GO:00352647 | Esophagus | ESCC | multicellular organism growth | 80/8552 | 132/18723 | 3.84e-04 | 2.22e-03 | 80 |
| Page: 1 2 3 4 5 6 7 8 9 10 11 12 |
| Pathway ID | Tissue | Disease Stage | Description | Gene Ratio | Bg Ratio | pvalue | p.adjust | qvalue | Count |
| hsa0452030 | Esophagus | ESCC | Adherens junction | 69/4205 | 93/8465 | 1.08e-06 | 6.83e-06 | 3.50e-06 | 69 |
| hsa04520114 | Esophagus | ESCC | Adherens junction | 69/4205 | 93/8465 | 1.08e-06 | 6.83e-06 | 3.50e-06 | 69 |
| hsa0452029 | Oral cavity | OSCC | Adherens junction | 62/3704 | 93/8465 | 6.34e-06 | 3.12e-05 | 1.59e-05 | 62 |
| hsa04520113 | Oral cavity | OSCC | Adherens junction | 62/3704 | 93/8465 | 6.34e-06 | 3.12e-05 | 1.59e-05 | 62 |
| hsa0452044 | Oral cavity | NEOLP | Adherens junction | 33/1112 | 93/8465 | 3.02e-08 | 5.34e-07 | 3.36e-07 | 33 |
| hsa0452054 | Oral cavity | NEOLP | Adherens junction | 33/1112 | 93/8465 | 3.02e-08 | 5.34e-07 | 3.36e-07 | 33 |
| Page: 1 |
Top |
Cell-cell communication analysis |
| Identification of potential cell-cell interactions between two cell types and their ligand-receptor pairs for different disease states |
| Ligand | Receptor | LRpair | Pathway | Tissue | Disease Stage |
| Page: 1 |
Top |
Single-cell gene regulatory network inference analysis |
| Find out the significant the regulons (TFs) and the target genes of each regulon across cell types for different disease states |
| TF | Cell Type | Tissue | Disease Stage | Target Gene | RSS | Regulon Activity |
| ∗The dot plots of a searched regulon are shown for all cell subpopulations in each disease state of each tissue based on the regulon specific score inferred using pySCENIC and by calculating the average expression. |
| Page: 1 |
Top |
Somatic mutation of malignant transformation related genes |
| Annotation of somatic variants for genes involved in malignant transformation |
| Hugo Symbol | Variant Class | Variant Classification | dbSNP RS | HGVSc | HGVSp | HGVSp Short | SWISSPROT | BIOTYPE | SIFT | PolyPhen | Tumor Sample Barcode | Tissue | Histology | Sex | Age | Stage | Therapy Types | Drugs | Outcome |
| HEG1 | SNV | Missense_Mutation | c.1310N>T | p.Ser437Phe | p.S437F | Q9ULI3 | protein_coding | deleterious(0.01) | possibly_damaging(0.598) | TCGA-A2-A0CX-01 | Breast | breast invasive carcinoma | Female | <65 | I/II | Chemotherapy | adriamycin | SD | |
| HEG1 | SNV | Missense_Mutation | c.1527G>T | p.Glu509Asp | p.E509D | Q9ULI3 | protein_coding | deleterious(0.01) | possibly_damaging(0.775) | TCGA-A2-A0D4-01 | Breast | breast invasive carcinoma | Female | <65 | I/II | Chemotherapy | adriamycin | SD | |
| HEG1 | SNV | Missense_Mutation | c.910N>C | p.Ser304Pro | p.S304P | Q9ULI3 | protein_coding | tolerated(0.07) | benign(0.007) | TCGA-A2-A0EU-01 | Breast | breast invasive carcinoma | Female | >=65 | I/II | Unknown | Unknown | SD | |
| HEG1 | SNV | Missense_Mutation | c.2081N>T | p.Ser694Leu | p.S694L | Q9ULI3 | protein_coding | tolerated(0.06) | benign(0.021) | TCGA-A2-A25A-01 | Breast | breast invasive carcinoma | Female | <65 | I/II | Unspecific | Cytoxan | SD | |
| HEG1 | SNV | Missense_Mutation | c.831N>C | p.Lys277Asn | p.K277N | Q9ULI3 | protein_coding | deleterious(0.01) | benign(0.107) | TCGA-A8-A093-01 | Breast | breast invasive carcinoma | Female | <65 | I/II | Hormone Therapy | tamoxiphen | SD | |
| HEG1 | SNV | Missense_Mutation | c.524N>G | p.Ser175Cys | p.S175C | Q9ULI3 | protein_coding | deleterious_low_confidence(0) | probably_damaging(0.95) | TCGA-A8-A09A-01 | Breast | breast invasive carcinoma | Female | <65 | I/II | Hormone Therapy | tamoxiphen | SD | |
| HEG1 | SNV | Missense_Mutation | c.382N>G | p.Gln128Glu | p.Q128E | Q9ULI3 | protein_coding | deleterious_low_confidence(0) | benign(0.039) | TCGA-AC-A23H-01 | Breast | breast invasive carcinoma | Female | >=65 | I/II | Unknown | Unknown | PD | |
| HEG1 | SNV | Missense_Mutation | novel | c.1586N>T | p.Ser529Leu | p.S529L | Q9ULI3 | protein_coding | tolerated(0.08) | benign(0.022) | TCGA-AN-A046-01 | Breast | breast invasive carcinoma | Female | >=65 | I/II | Unknown | Unknown | SD |
| HEG1 | SNV | Missense_Mutation | c.2305N>G | p.Met769Val | p.M769V | Q9ULI3 | protein_coding | tolerated(0.9) | benign(0) | TCGA-AO-A128-01 | Breast | breast invasive carcinoma | Female | <65 | I/II | Chemotherapy | doxorubicin | SD | |
| HEG1 | SNV | Missense_Mutation | c.1942N>T | p.Val648Phe | p.V648F | Q9ULI3 | protein_coding | tolerated(0.16) | benign(0) | TCGA-B6-A0IJ-01 | Breast | breast invasive carcinoma | Female | <65 | I/II | Unknown | Unknown | SD |
| Page: 1 2 3 4 5 6 7 8 9 10 11 12 13 14 15 |
Top |
Related drugs of malignant transformation related genes |
| Identification of chemicals and drugs interact with genes involved in malignant transfromation |
| (DGIdb 4.0) |
| Entrez ID | Symbol | Category | Interaction Types | Drug Claim Name | Drug Name | PMIDs |
| Page: 1 |

Copyright 2023-Present -The University of Texas Health Science Center at Houston |