
|
|||||
|
 | |
| |
| |
| |
| |
| |
|
Gene: HECTD4 |
Gene summary for HECTD4 |
| Gene information | Species | Human | Gene symbol | HECTD4 | Gene ID | 283450 |
| Gene name | HECT domain E3 ubiquitin protein ligase 4 | |
| Gene Alias | C12ord51 | |
| Cytomap | 12q24.13 | |
| Gene Type | protein-coding | GO ID | GO:0005975 | UniProtAcc | F8VWT9 |
Top |
Malignant transformation analysis |
| Identification of the aberrant gene expression in precancerous and cancerous lesions by comparing the gene expression of stem-like cells in diseased tissues with normal stem cells |
| Entrez ID | Symbol | Replicates | Species | Organ | Tissue | Adj P-value | Log2FC | Malignancy |
| 283450 | HECTD4 | CCI_1 | Human | Cervix | CC | 8.70e-08 | 7.34e-01 | 0.528 |
| 283450 | HECTD4 | CCI_2 | Human | Cervix | CC | 4.05e-08 | 1.03e+00 | 0.5249 |
| 283450 | HECTD4 | CCI_3 | Human | Cervix | CC | 3.59e-12 | 8.03e-01 | 0.516 |
| 283450 | HECTD4 | HTA11_3410_2000001011 | Human | Colorectum | AD | 1.45e-03 | -2.92e-01 | 0.0155 |
| 283450 | HECTD4 | HTA11_347_2000001011 | Human | Colorectum | AD | 7.75e-10 | 5.23e-01 | -0.1954 |
| 283450 | HECTD4 | HTA11_7862_2000001011 | Human | Colorectum | AD | 3.31e-02 | -3.99e-01 | -0.0179 |
| 283450 | HECTD4 | HTA11_99999965062_69753 | Human | Colorectum | MSI-H | 7.72e-03 | 8.02e-01 | 0.3487 |
| 283450 | HECTD4 | HTA11_99999974143_84620 | Human | Colorectum | MSS | 4.95e-03 | -3.67e-01 | 0.3005 |
| 283450 | HECTD4 | F007 | Human | Colorectum | FAP | 2.11e-04 | -2.71e-01 | 0.1176 |
| 283450 | HECTD4 | A015-C-203 | Human | Colorectum | FAP | 4.15e-33 | -3.60e-01 | -0.1294 |
| 283450 | HECTD4 | A015-C-204 | Human | Colorectum | FAP | 4.02e-08 | -3.83e-01 | -0.0228 |
| 283450 | HECTD4 | A014-C-040 | Human | Colorectum | FAP | 2.32e-07 | -5.34e-01 | -0.1184 |
| 283450 | HECTD4 | A002-C-201 | Human | Colorectum | FAP | 5.51e-14 | -3.14e-01 | 0.0324 |
| 283450 | HECTD4 | A002-C-203 | Human | Colorectum | FAP | 2.80e-06 | -2.51e-01 | 0.2786 |
| 283450 | HECTD4 | A001-C-119 | Human | Colorectum | FAP | 1.34e-06 | 2.87e-02 | -0.1557 |
| 283450 | HECTD4 | A001-C-108 | Human | Colorectum | FAP | 2.01e-16 | -2.03e-01 | -0.0272 |
| 283450 | HECTD4 | A002-C-205 | Human | Colorectum | FAP | 1.92e-24 | -3.55e-01 | -0.1236 |
| 283450 | HECTD4 | A015-C-006 | Human | Colorectum | FAP | 4.40e-18 | -4.57e-01 | -0.0994 |
| 283450 | HECTD4 | A015-C-106 | Human | Colorectum | FAP | 3.84e-09 | -1.74e-01 | -0.0511 |
| 283450 | HECTD4 | A002-C-114 | Human | Colorectum | FAP | 8.98e-19 | -2.87e-01 | -0.1561 |
| Page: 1 2 3 4 5 |
| Tissue | Expression Dynamics | Abbreviation |
| Cervix |  | CC: Cervix cancer |
| HSIL_HPV: HPV-infected high-grade squamous intraepithelial lesions | ||
| N_HPV: HPV-infected normal cervix | ||
| Colorectum (GSE201348) | 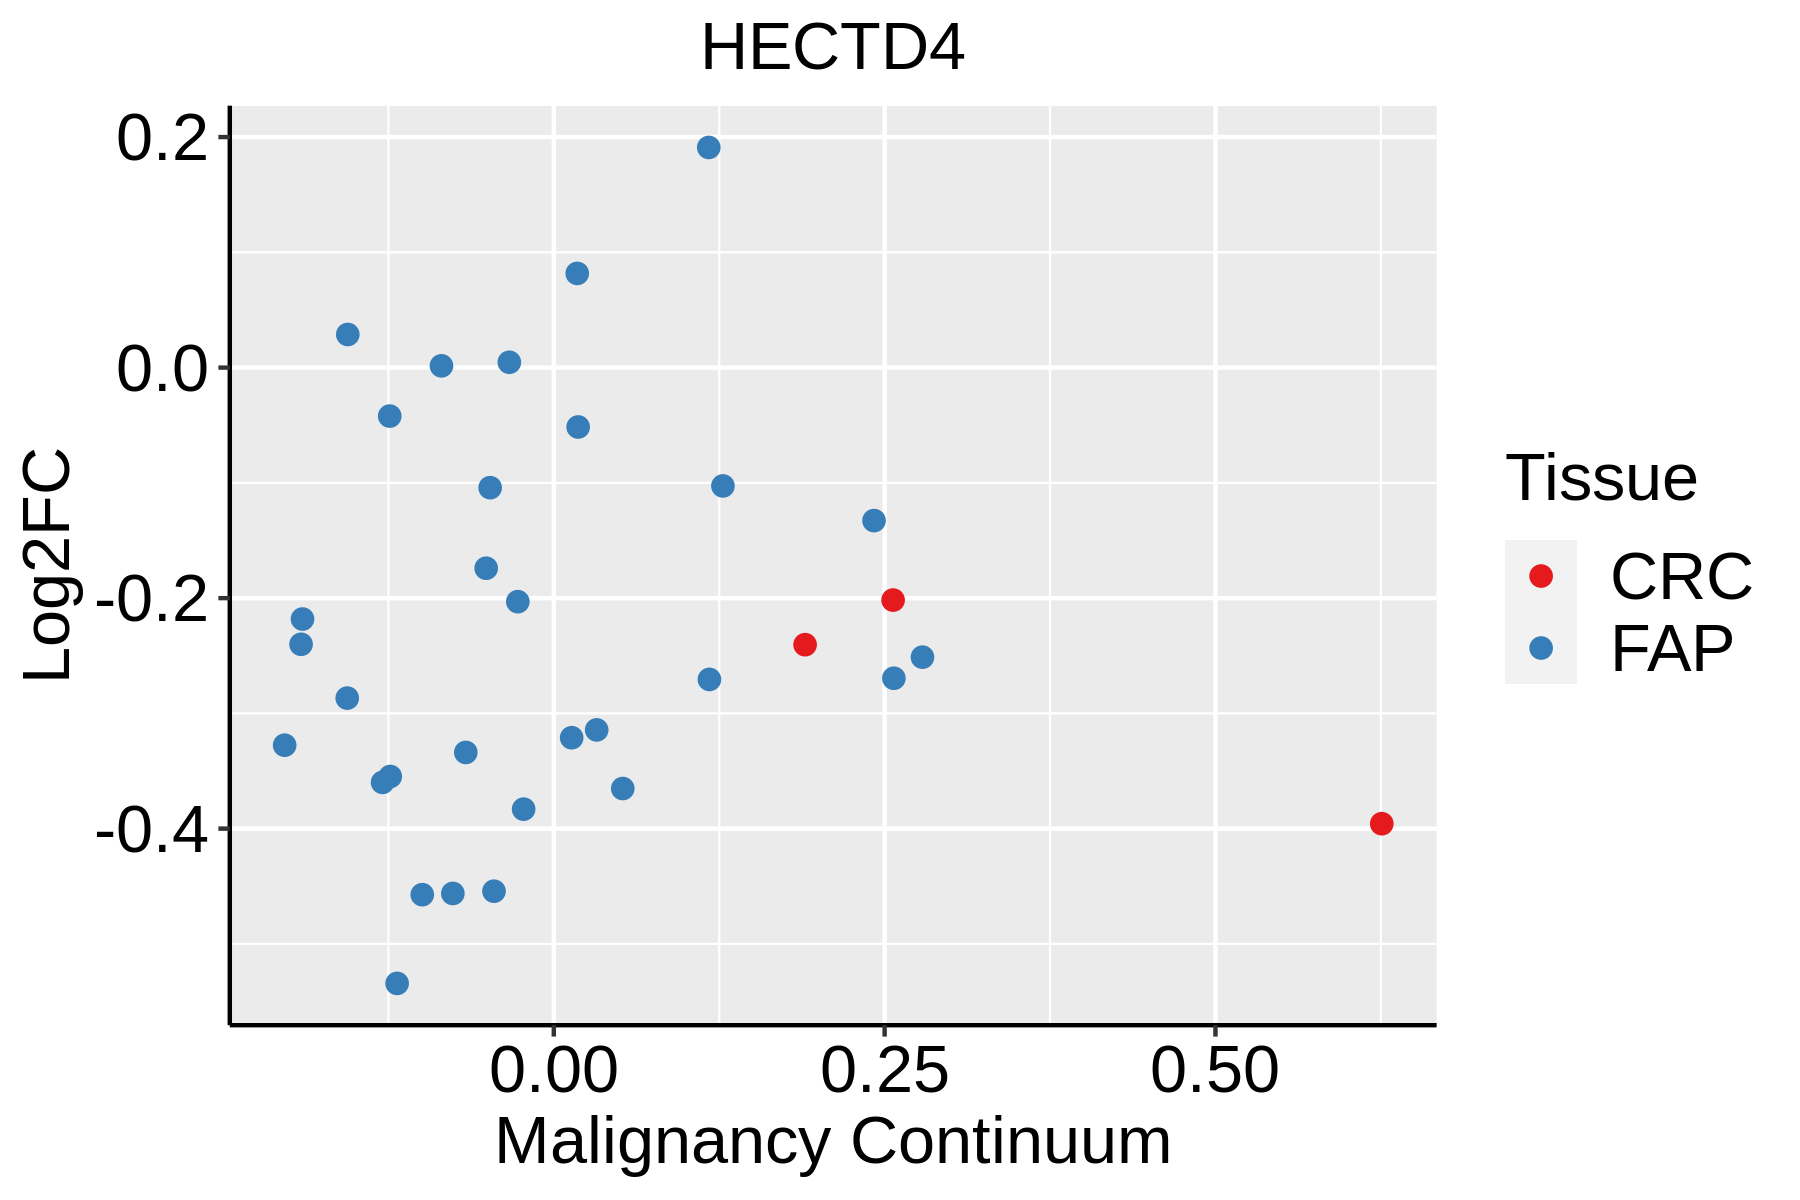 | FAP: Familial adenomatous polyposis |
| CRC: Colorectal cancer | ||
| Colorectum (HTA11) |  | AD: Adenomas |
| SER: Sessile serrated lesions | ||
| MSI-H: Microsatellite-high colorectal cancer | ||
| MSS: Microsatellite stable colorectal cancer | ||
| Endometrium |  | AEH: Atypical endometrial hyperplasia |
| EEC: Endometrioid Cancer | ||
| Liver | 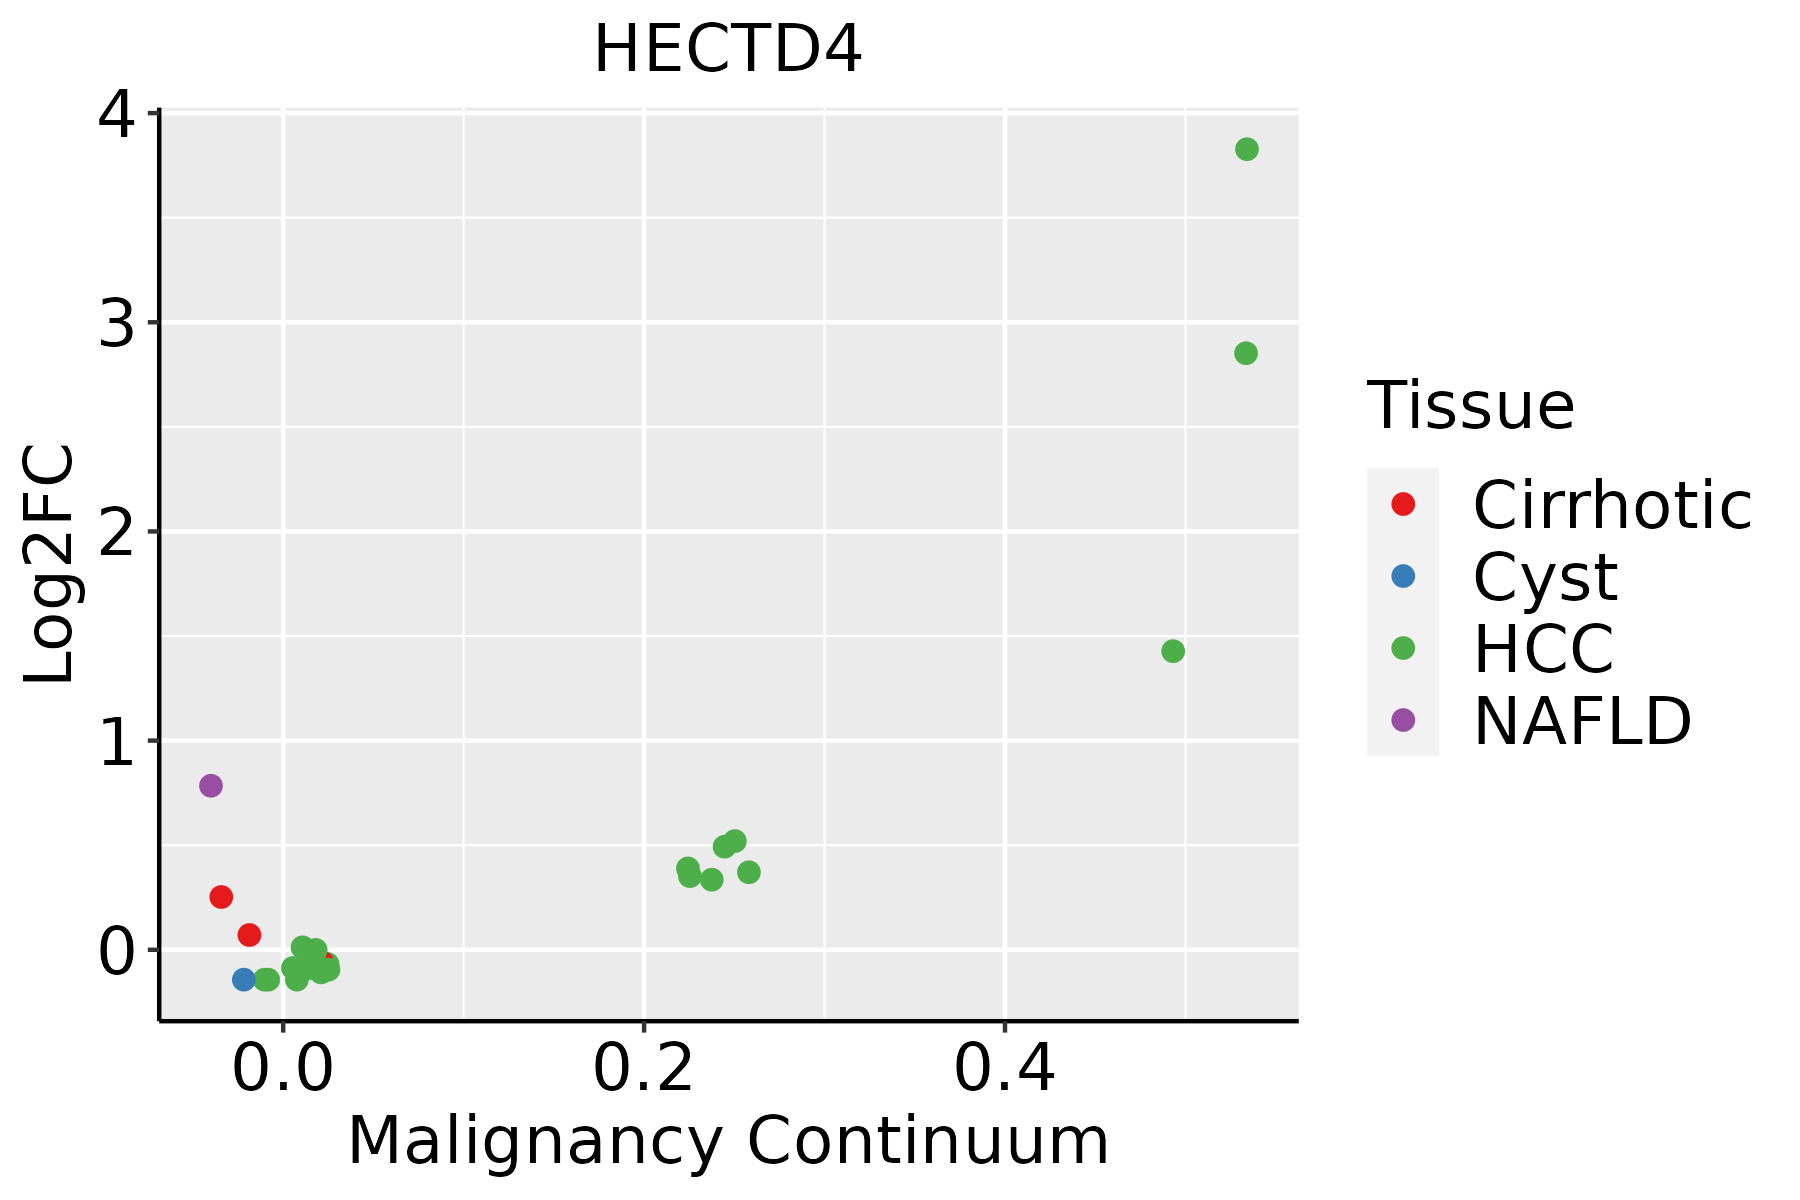 | HCC: Hepatocellular carcinoma |
| NAFLD: Non-alcoholic fatty liver disease | ||
| Lung |  | AAH: Atypical adenomatous hyperplasia |
| AIS: Adenocarcinoma in situ | ||
| IAC: Invasive lung adenocarcinoma | ||
| MIA: Minimally invasive adenocarcinoma | ||
| Thyroid |  | ATC: Anaplastic thyroid cancer |
| HT: Hashimoto's thyroiditis | ||
| PTC: Papillary thyroid cancer |
| ∗log2FC in expression of this searched gene in stem-like cells from each diseased tissue sample relative to stem-like cells in normal samples in each tissue plotted against the malignancy continuum. Samples are colored based on if they are from different disease stage. |
Top |
Malignant transformation related pathway analysis |
| Find out the enriched GO biological processes and KEGG pathways involved in transition from healthy to precancer to cancer |
| Tissue | Disease Stage | Enriched GO biological Processes |
| Colorectum | AD |  |
| Colorectum | SER |  |
| Colorectum | MSS |  |
| Colorectum | MSI-H |  |
| Colorectum | FAP |  |
| ∗Top 15 enriched GO BP terms are showed in the bar plot of each disease state in each tissue. Each row represents a significant GO biological process which is colored according to the -log10(p.adjust). |
| Page: 1 2 3 4 5 6 7 8 9 |
| GO ID | Tissue | Disease Stage | Description | Gene Ratio | Bg Ratio | pvalue | p.adjust | Count |
| GO:00425939 | Cervix | CC | glucose homeostasis | 50/2311 | 258/18723 | 7.57e-04 | 6.76e-03 | 50 |
| GO:00335009 | Cervix | CC | carbohydrate homeostasis | 50/2311 | 259/18723 | 8.28e-04 | 7.22e-03 | 50 |
| GO:0033500 | Colorectum | AD | carbohydrate homeostasis | 84/3918 | 259/18723 | 9.10e-06 | 2.15e-04 | 84 |
| GO:0042593 | Colorectum | AD | glucose homeostasis | 83/3918 | 258/18723 | 1.44e-05 | 3.11e-04 | 83 |
| GO:0019318 | Colorectum | AD | hexose metabolic process | 77/3918 | 237/18723 | 1.96e-05 | 4.01e-04 | 77 |
| GO:0005996 | Colorectum | AD | monosaccharide metabolic process | 80/3918 | 257/18723 | 7.31e-05 | 1.17e-03 | 80 |
| GO:0006006 | Colorectum | AD | glucose metabolic process | 62/3918 | 196/18723 | 2.76e-04 | 3.39e-03 | 62 |
| GO:00335002 | Colorectum | MSS | carbohydrate homeostasis | 76/3467 | 259/18723 | 1.37e-05 | 3.14e-04 | 76 |
| GO:00425932 | Colorectum | MSS | glucose homeostasis | 75/3467 | 258/18723 | 2.22e-05 | 4.69e-04 | 75 |
| GO:00193182 | Colorectum | MSS | hexose metabolic process | 63/3467 | 237/18723 | 1.32e-03 | 1.25e-02 | 63 |
| GO:00059962 | Colorectum | MSS | monosaccharide metabolic process | 66/3467 | 257/18723 | 2.61e-03 | 2.06e-02 | 66 |
| GO:00060062 | Colorectum | MSS | glucose metabolic process | 51/3467 | 196/18723 | 5.67e-03 | 3.85e-02 | 51 |
| GO:00193183 | Colorectum | FAP | hexose metabolic process | 58/2622 | 237/18723 | 1.09e-05 | 3.08e-04 | 58 |
| GO:00335003 | Colorectum | FAP | carbohydrate homeostasis | 60/2622 | 259/18723 | 4.49e-05 | 9.35e-04 | 60 |
| GO:00060063 | Colorectum | FAP | glucose metabolic process | 48/2622 | 196/18723 | 5.90e-05 | 1.16e-03 | 48 |
| GO:00059963 | Colorectum | FAP | monosaccharide metabolic process | 59/2622 | 257/18723 | 6.79e-05 | 1.28e-03 | 59 |
| GO:00425933 | Colorectum | FAP | glucose homeostasis | 59/2622 | 258/18723 | 7.62e-05 | 1.37e-03 | 59 |
| GO:00335004 | Colorectum | CRC | carbohydrate homeostasis | 49/2078 | 259/18723 | 1.29e-04 | 2.46e-03 | 49 |
| GO:00425934 | Colorectum | CRC | glucose homeostasis | 48/2078 | 258/18723 | 2.27e-04 | 3.78e-03 | 48 |
| GO:004259310 | Endometrium | AEH | glucose homeostasis | 55/2100 | 258/18723 | 1.87e-06 | 5.74e-05 | 55 |
| Page: 1 2 3 |
| Pathway ID | Tissue | Disease Stage | Description | Gene Ratio | Bg Ratio | pvalue | p.adjust | qvalue | Count |
| Page: 1 |
Top |
Cell-cell communication analysis |
| Identification of potential cell-cell interactions between two cell types and their ligand-receptor pairs for different disease states |
| Ligand | Receptor | LRpair | Pathway | Tissue | Disease Stage |
| Page: 1 |
Top |
Single-cell gene regulatory network inference analysis |
| Find out the significant the regulons (TFs) and the target genes of each regulon across cell types for different disease states |
| TF | Cell Type | Tissue | Disease Stage | Target Gene | RSS | Regulon Activity |
| ∗The dot plots of a searched regulon are shown for all cell subpopulations in each disease state of each tissue based on the regulon specific score inferred using pySCENIC and by calculating the average expression. |
| Page: 1 |
Top |
Somatic mutation of malignant transformation related genes |
| Annotation of somatic variants for genes involved in malignant transformation |
| Hugo Symbol | Variant Class | Variant Classification | dbSNP RS | HGVSc | HGVSp | HGVSp Short | SWISSPROT | BIOTYPE | SIFT | PolyPhen | Tumor Sample Barcode | Tissue | Histology | Sex | Age | Stage | Therapy Types | Drugs | Outcome |
| HECTD4 | SNV | Missense_Mutation | c.10144N>A | p.Asp3382Asn | p.D3382N | protein_coding | deleterious_low_confidence(0) | probably_damaging(0.998) | TCGA-A1-A0SD-01 | Breast | breast invasive carcinoma | Female | <65 | I/II | Unknown | Unknown | SD | ||
| HECTD4 | SNV | Missense_Mutation | novel | c.11348A>G | p.Asn3783Ser | p.N3783S | protein_coding | tolerated_low_confidence(0.12) | benign(0.031) | TCGA-A1-A0SI-01 | Breast | breast invasive carcinoma | Female | <65 | I/II | Unknown | Unknown | SD | |
| HECTD4 | SNV | Missense_Mutation | c.12080N>C | p.Cys4027Ser | p.C4027S | protein_coding | deleterious(0.01) | benign(0.31) | TCGA-A2-A0D0-01 | Breast | breast invasive carcinoma | Female | <65 | I/II | Chemotherapy | cytoxan | SD | ||
| HECTD4 | SNV | Missense_Mutation | rs372826317 | c.3185C>A | p.Ala1062Asp | p.A1062D | protein_coding | deleterious(0) | possibly_damaging(0.742) | TCGA-A7-A4SC-01 | Breast | breast invasive carcinoma | Female | <65 | I/II | Hormone Therapy | tamoxiphen | SD | |
| HECTD4 | SNV | Missense_Mutation | c.4987N>G | p.Gln1663Glu | p.Q1663E | protein_coding | tolerated(0.33) | benign(0.07) | TCGA-A8-A07R-01 | Breast | breast invasive carcinoma | Female | >=65 | III/IV | Ancillary | zoledronic | SD | ||
| HECTD4 | SNV | Missense_Mutation | c.2177N>C | p.Val726Ala | p.V726A | protein_coding | deleterious(0) | probably_damaging(0.995) | TCGA-A8-A07W-01 | Breast | breast invasive carcinoma | Female | >=65 | III/IV | Hormone Therapy | exemestane | SD | ||
| HECTD4 | SNV | Missense_Mutation | c.3430N>C | p.Asp1144His | p.D1144H | protein_coding | deleterious(0) | probably_damaging(0.991) | TCGA-A8-A095-01 | Breast | breast invasive carcinoma | Female | <65 | I/II | Chemotherapy | 5-fluorouracil | CR | ||
| HECTD4 | SNV | Missense_Mutation | c.6676N>C | p.Glu2226Gln | p.E2226Q | protein_coding | tolerated(0.21) | probably_damaging(0.998) | TCGA-AC-A23H-01 | Breast | breast invasive carcinoma | Female | >=65 | I/II | Unknown | Unknown | PD | ||
| HECTD4 | SNV | Missense_Mutation | c.1500N>G | p.Ile500Met | p.I500M | protein_coding | deleterious(0.02) | probably_damaging(0.999) | TCGA-AC-A23H-01 | Breast | breast invasive carcinoma | Female | >=65 | I/II | Unknown | Unknown | PD | ||
| HECTD4 | SNV | Missense_Mutation | novel | c.1221N>A | p.Ser407Arg | p.S407R | protein_coding | deleterious(0) | benign(0.171) | TCGA-AC-A3BB-01 | Breast | breast invasive carcinoma | Female | <65 | III/IV | Chemotherapy | cytoxan | CR |
| Page: 1 2 3 4 5 6 7 8 9 10 11 12 13 14 15 16 17 18 19 20 21 22 23 24 25 26 27 28 29 30 31 32 33 34 35 36 37 38 39 40 |
Top |
Related drugs of malignant transformation related genes |
| Identification of chemicals and drugs interact with genes involved in malignant transfromation |
| (DGIdb 4.0) |
| Entrez ID | Symbol | Category | Interaction Types | Drug Claim Name | Drug Name | PMIDs |
| Page: 1 |

Copyright 2023-Present -The University of Texas Health Science Center at Houston |