
|
|||||
|
 | |
| |
| |
| |
| |
| |
|
Gene: HECTD3 |
Gene summary for HECTD3 |
| Gene information | Species | Human | Gene symbol | HECTD3 | Gene ID | 79654 |
| Gene name | HECT domain E3 ubiquitin protein ligase 3 | |
| Gene Alias | HECTD3 | |
| Cytomap | 1p34.1 | |
| Gene Type | protein-coding | GO ID | GO:0006464 | UniProtAcc | A1A4G1 |
Top |
Malignant transformation analysis |
| Identification of the aberrant gene expression in precancerous and cancerous lesions by comparing the gene expression of stem-like cells in diseased tissues with normal stem cells |
| Entrez ID | Symbol | Replicates | Species | Organ | Tissue | Adj P-value | Log2FC | Malignancy |
| 79654 | HECTD3 | HTA11_2487_2000001011 | Human | Colorectum | SER | 3.10e-12 | 4.60e-01 | -0.1808 |
| 79654 | HECTD3 | HTA11_78_2000001011 | Human | Colorectum | AD | 3.90e-02 | 1.75e-01 | -0.1088 |
| 79654 | HECTD3 | HTA11_347_2000001011 | Human | Colorectum | AD | 4.93e-13 | 3.79e-01 | -0.1954 |
| 79654 | HECTD3 | HTA11_411_2000001011 | Human | Colorectum | SER | 1.42e-05 | 7.41e-01 | -0.2602 |
| 79654 | HECTD3 | HTA11_83_2000001011 | Human | Colorectum | SER | 6.24e-06 | 2.63e-01 | -0.1526 |
| 79654 | HECTD3 | HTA11_696_2000001011 | Human | Colorectum | AD | 1.05e-05 | 3.02e-01 | -0.1464 |
| 79654 | HECTD3 | HTA11_1391_2000001011 | Human | Colorectum | AD | 1.52e-02 | 2.44e-01 | -0.059 |
| 79654 | HECTD3 | HTA11_5212_2000001011 | Human | Colorectum | AD | 2.82e-03 | 4.19e-01 | -0.2061 |
| 79654 | HECTD3 | HTA11_5216_2000001011 | Human | Colorectum | SER | 1.61e-03 | 4.79e-01 | -0.1462 |
| 79654 | HECTD3 | HTA11_7696_3000711011 | Human | Colorectum | AD | 1.78e-02 | 2.43e-01 | 0.0674 |
| 79654 | HECTD3 | HTA11_99999971662_82457 | Human | Colorectum | MSS | 8.68e-03 | 1.91e-01 | 0.3859 |
| 79654 | HECTD3 | LZE20T | Human | Esophagus | ESCC | 1.64e-05 | 1.12e-01 | 0.0662 |
| 79654 | HECTD3 | LZE24T | Human | Esophagus | ESCC | 2.16e-07 | 1.88e-01 | 0.0596 |
| 79654 | HECTD3 | P2T-E | Human | Esophagus | ESCC | 2.08e-09 | 1.18e-01 | 0.1177 |
| 79654 | HECTD3 | P4T-E | Human | Esophagus | ESCC | 4.30e-05 | 7.80e-02 | 0.1323 |
| 79654 | HECTD3 | P5T-E | Human | Esophagus | ESCC | 1.87e-04 | 2.91e-02 | 0.1327 |
| 79654 | HECTD3 | P8T-E | Human | Esophagus | ESCC | 6.64e-08 | 1.53e-01 | 0.0889 |
| 79654 | HECTD3 | P10T-E | Human | Esophagus | ESCC | 3.72e-06 | 1.11e-01 | 0.116 |
| 79654 | HECTD3 | P11T-E | Human | Esophagus | ESCC | 2.14e-07 | 2.50e-01 | 0.1426 |
| 79654 | HECTD3 | P12T-E | Human | Esophagus | ESCC | 4.78e-15 | 1.30e-01 | 0.1122 |
| Page: 1 2 3 4 |
| Tissue | Expression Dynamics | Abbreviation |
| Colorectum (GSE201348) | 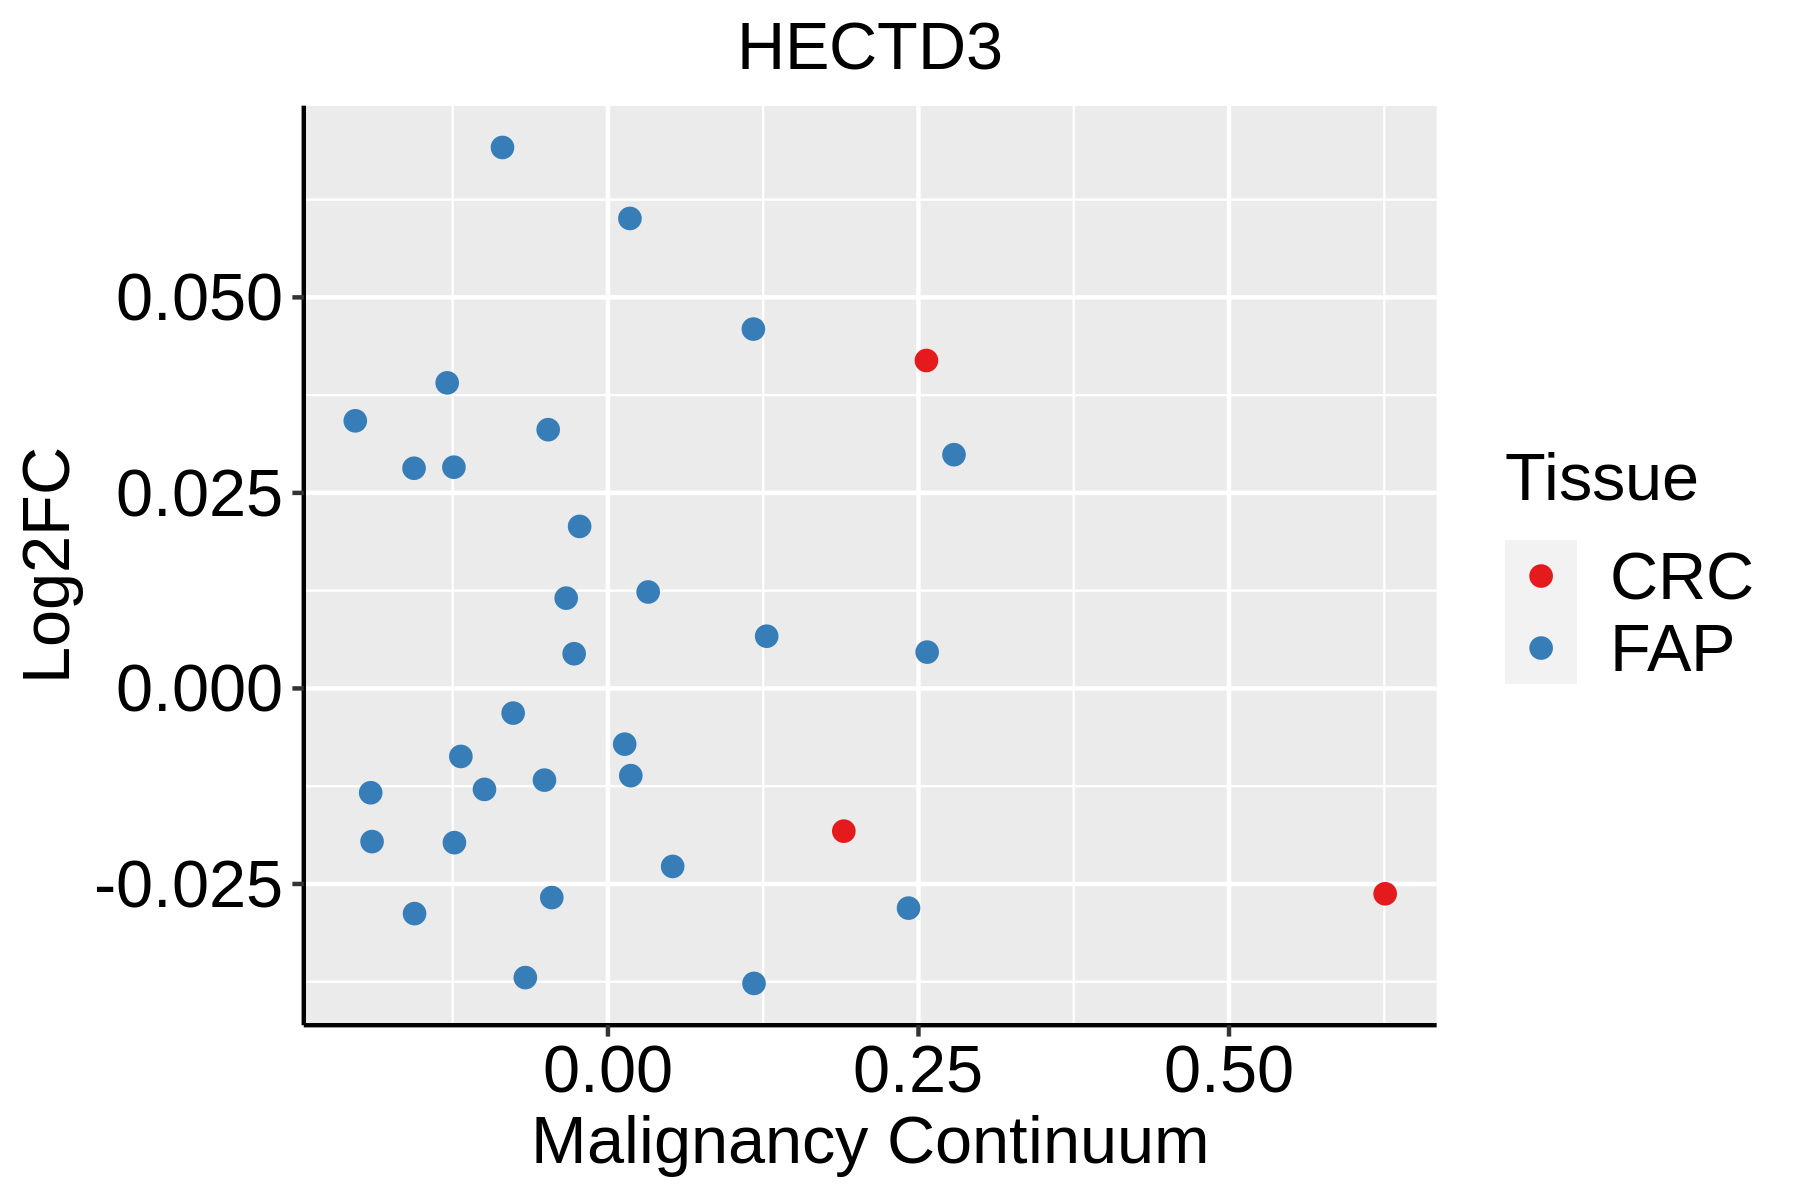 | FAP: Familial adenomatous polyposis |
| CRC: Colorectal cancer | ||
| Colorectum (HTA11) |  | AD: Adenomas |
| SER: Sessile serrated lesions | ||
| MSI-H: Microsatellite-high colorectal cancer | ||
| MSS: Microsatellite stable colorectal cancer | ||
| Esophagus | 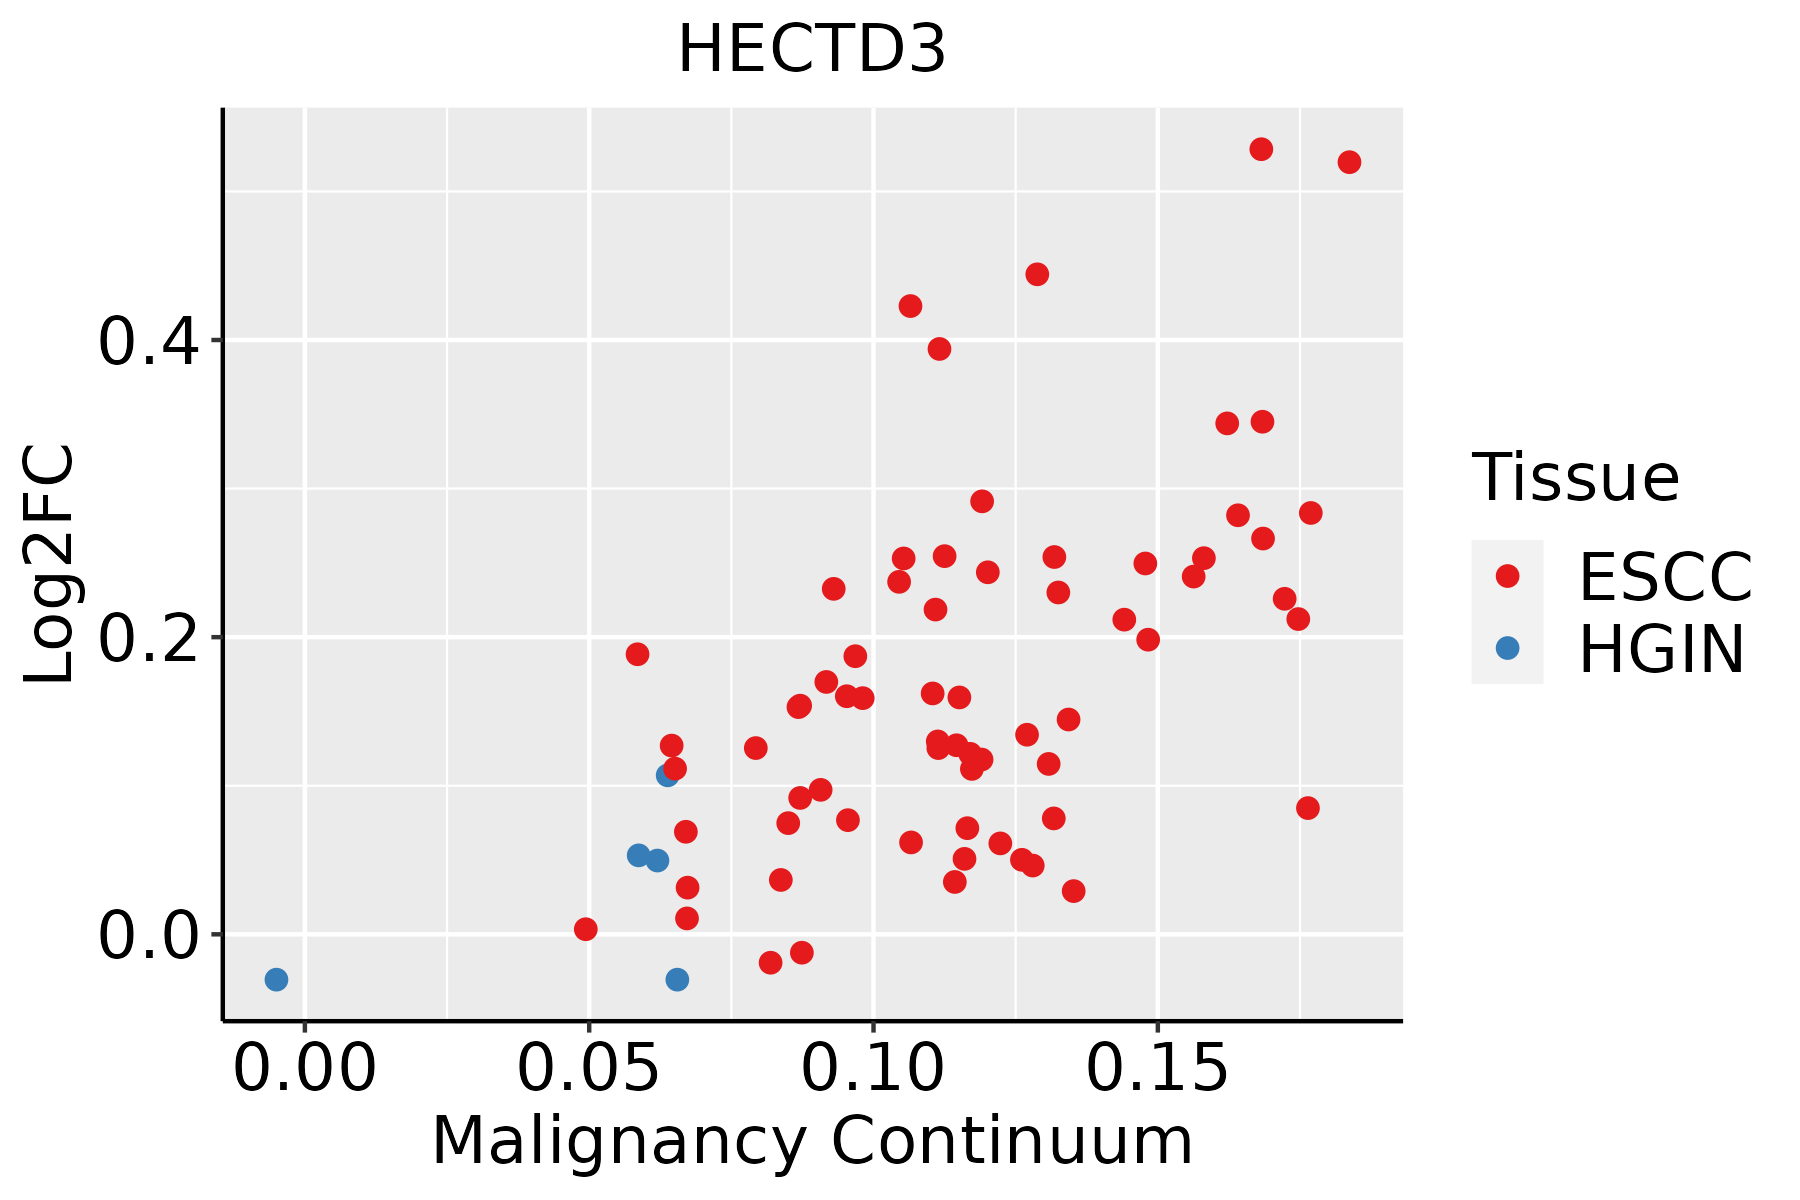 | ESCC: Esophageal squamous cell carcinoma |
| HGIN: High-grade intraepithelial neoplasias | ||
| LGIN: Low-grade intraepithelial neoplasias | ||
| Liver | 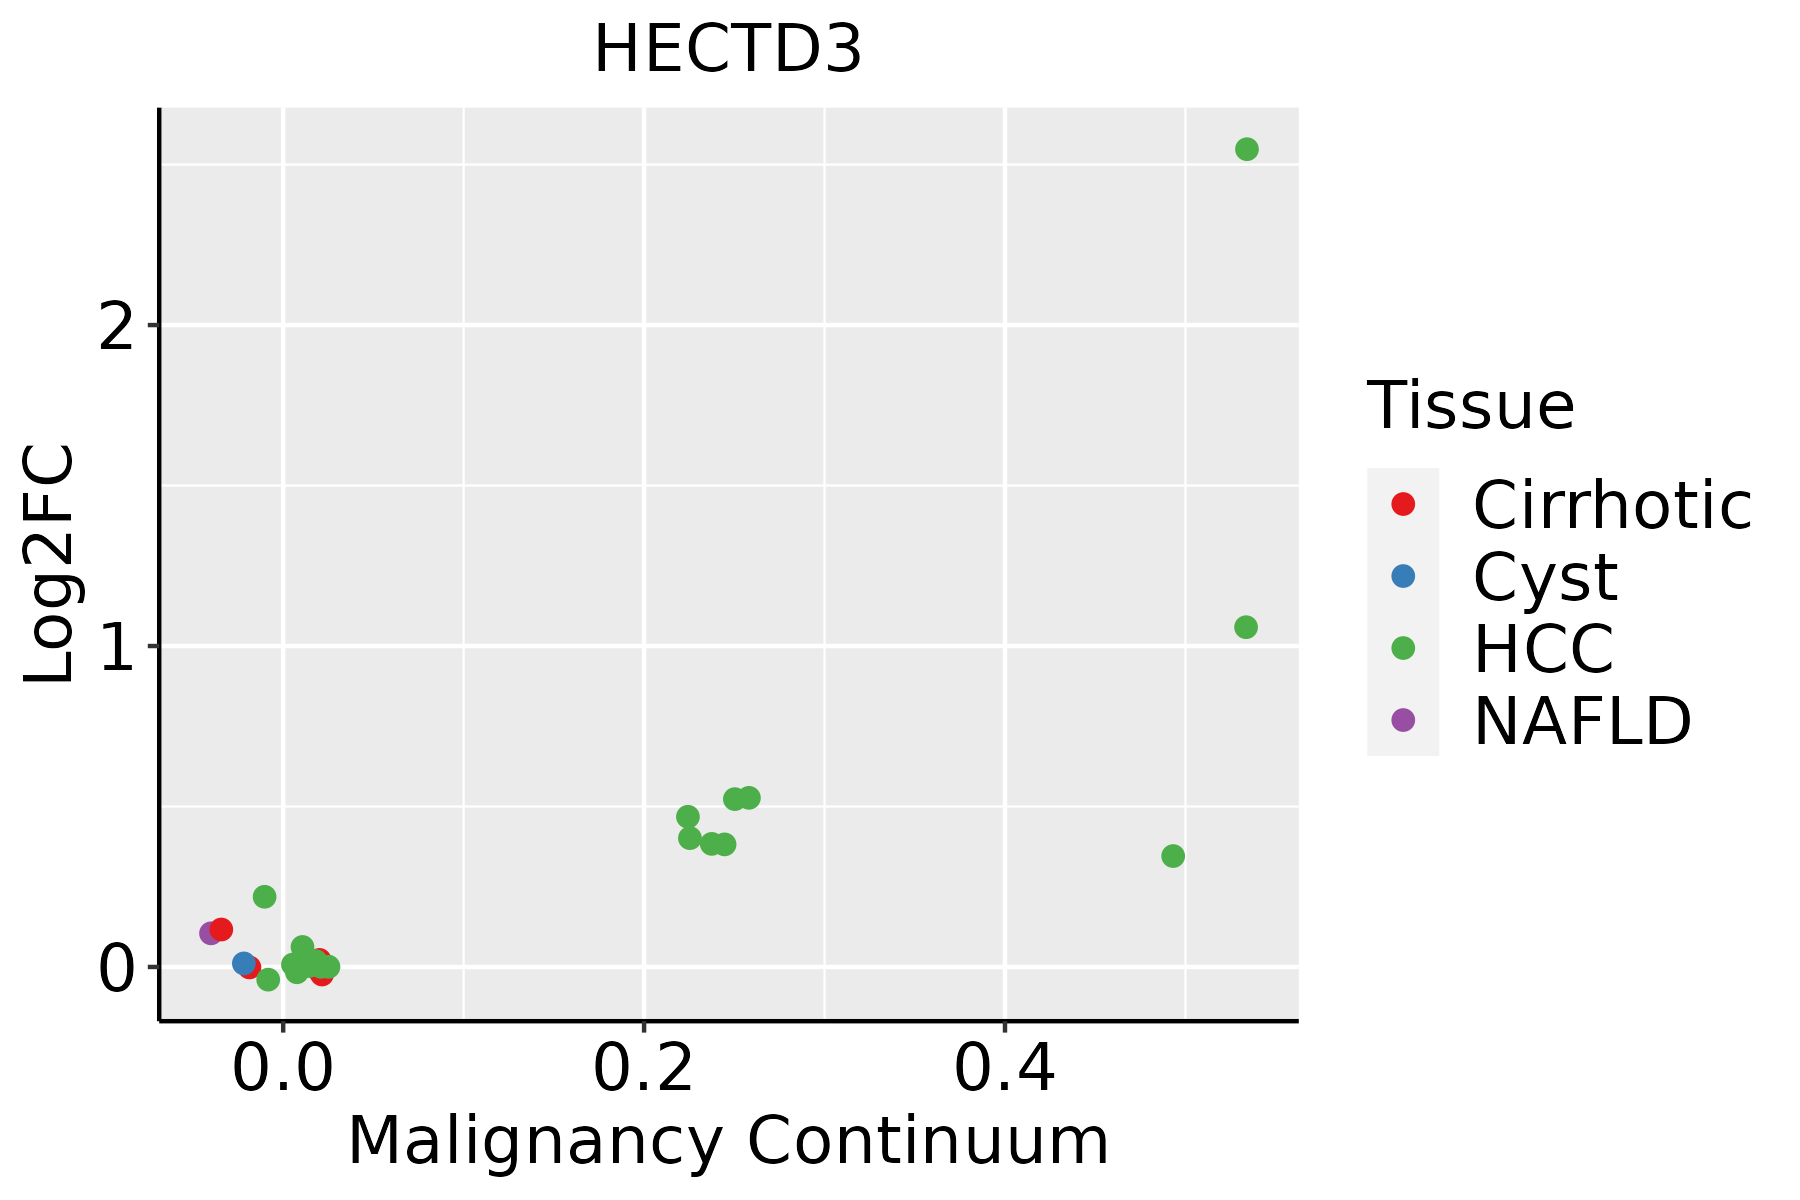 | HCC: Hepatocellular carcinoma |
| NAFLD: Non-alcoholic fatty liver disease |
| ∗log2FC in expression of this searched gene in stem-like cells from each diseased tissue sample relative to stem-like cells in normal samples in each tissue plotted against the malignancy continuum. Samples are colored based on if they are from different disease stage. |
Top |
Malignant transformation related pathway analysis |
| Find out the enriched GO biological processes and KEGG pathways involved in transition from healthy to precancer to cancer |
| Tissue | Disease Stage | Enriched GO biological Processes |
| Colorectum | AD |  |
| Colorectum | SER |  |
| Colorectum | MSS |  |
| Colorectum | MSI-H |  |
| Colorectum | FAP |  |
| ∗Top 15 enriched GO BP terms are showed in the bar plot of each disease state in each tissue. Each row represents a significant GO biological process which is colored according to the -log10(p.adjust). |
| Page: 1 2 3 4 5 6 7 8 9 |
| GO ID | Tissue | Disease Stage | Description | Gene Ratio | Bg Ratio | pvalue | p.adjust | Count |
| GO:0010498 | Colorectum | AD | proteasomal protein catabolic process | 174/3918 | 490/18723 | 3.18e-14 | 7.66e-12 | 174 |
| GO:0043161 | Colorectum | AD | proteasome-mediated ubiquitin-dependent protein catabolic process | 141/3918 | 412/18723 | 1.77e-10 | 1.68e-08 | 141 |
| GO:00104981 | Colorectum | SER | proteasomal protein catabolic process | 132/2897 | 490/18723 | 3.08e-11 | 5.55e-09 | 132 |
| GO:00431611 | Colorectum | SER | proteasome-mediated ubiquitin-dependent protein catabolic process | 105/2897 | 412/18723 | 7.48e-08 | 4.70e-06 | 105 |
| GO:00104982 | Colorectum | MSS | proteasomal protein catabolic process | 157/3467 | 490/18723 | 2.39e-13 | 5.25e-11 | 157 |
| GO:00431612 | Colorectum | MSS | proteasome-mediated ubiquitin-dependent protein catabolic process | 127/3467 | 412/18723 | 7.70e-10 | 6.32e-08 | 127 |
| GO:0010498111 | Esophagus | ESCC | proteasomal protein catabolic process | 369/8552 | 490/18723 | 1.13e-41 | 1.80e-38 | 369 |
| GO:0043161111 | Esophagus | ESCC | proteasome-mediated ubiquitin-dependent protein catabolic process | 312/8552 | 412/18723 | 3.53e-36 | 4.48e-33 | 312 |
| GO:001049822 | Liver | HCC | proteasomal protein catabolic process | 351/7958 | 490/18723 | 6.92e-40 | 1.46e-36 | 351 |
| GO:004316122 | Liver | HCC | proteasome-mediated ubiquitin-dependent protein catabolic process | 299/7958 | 412/18723 | 7.82e-36 | 8.27e-33 | 299 |
| Page: 1 |
| Pathway ID | Tissue | Disease Stage | Description | Gene Ratio | Bg Ratio | pvalue | p.adjust | qvalue | Count |
| Page: 1 |
Top |
Cell-cell communication analysis |
| Identification of potential cell-cell interactions between two cell types and their ligand-receptor pairs for different disease states |
| Ligand | Receptor | LRpair | Pathway | Tissue | Disease Stage |
| Page: 1 |
Top |
Single-cell gene regulatory network inference analysis |
| Find out the significant the regulons (TFs) and the target genes of each regulon across cell types for different disease states |
| TF | Cell Type | Tissue | Disease Stage | Target Gene | RSS | Regulon Activity |
| ∗The dot plots of a searched regulon are shown for all cell subpopulations in each disease state of each tissue based on the regulon specific score inferred using pySCENIC and by calculating the average expression. |
| Page: 1 |
Top |
Somatic mutation of malignant transformation related genes |
| Annotation of somatic variants for genes involved in malignant transformation |
| Hugo Symbol | Variant Class | Variant Classification | dbSNP RS | HGVSc | HGVSp | HGVSp Short | SWISSPROT | BIOTYPE | SIFT | PolyPhen | Tumor Sample Barcode | Tissue | Histology | Sex | Age | Stage | Therapy Types | Drugs | Outcome |
| HECTD3 | SNV | Missense_Mutation | c.1594N>G | p.Phe532Val | p.F532V | Q5T447 | protein_coding | deleterious(0) | probably_damaging(0.954) | TCGA-A8-A09Q-01 | Breast | breast invasive carcinoma | Female | >=65 | III/IV | Hormone Therapy | anastrozole | SD | |
| HECTD3 | SNV | Missense_Mutation | novel | c.1199N>C | p.Asp400Ala | p.D400A | Q5T447 | protein_coding | deleterious(0.03) | benign(0.026) | TCGA-AN-A03Y-01 | Breast | breast invasive carcinoma | Female | >=65 | I/II | Unknown | Unknown | SD |
| HECTD3 | SNV | Missense_Mutation | c.2359N>T | p.Arg787Cys | p.R787C | Q5T447 | protein_coding | deleterious(0.02) | possibly_damaging(0.643) | TCGA-BH-A0HA-01 | Breast | breast invasive carcinoma | Female | <65 | I/II | Unknown | Unknown | SD | |
| HECTD3 | SNV | Missense_Mutation | rs375141496 | c.938N>G | p.Tyr313Cys | p.Y313C | Q5T447 | protein_coding | deleterious(0.03) | probably_damaging(0.954) | TCGA-D8-A1JM-01 | Breast | breast invasive carcinoma | Female | <65 | I/II | ChemotherapyHormone Therapy | doxorubicine | SD |
| HECTD3 | insertion | Frame_Shift_Ins | novel | c.1197_1198insTCTCTCCTAACTTCCCTTATGTCCCAGCCATCATTTGGGTCTCA | p.Asp400SerfsTer58 | p.D400Sfs*58 | Q5T447 | protein_coding | TCGA-AN-A03Y-01 | Breast | breast invasive carcinoma | Female | >=65 | I/II | Unknown | Unknown | SD | ||
| HECTD3 | insertion | Frame_Shift_Ins | novel | c.1256_1257insGGCTGTTCCCCAGCCTCCTTGGTATTCCAGAGTGTGTGGAATAC | p.Asp419GlufsTer39 | p.D419Efs*39 | Q5T447 | protein_coding | TCGA-AN-A0FS-01 | Breast | breast invasive carcinoma | Female | <65 | I/II | Unknown | Unknown | SD | ||
| HECTD3 | insertion | In_Frame_Ins | novel | c.2285_2286insAGTTGTAGACCCTCCCTCACCATCCATGCAGGCACTGATTTCCTT | p.Asp762delinsGluValValAspProProSerProSerMetGlnAlaLeuIleSerPhe | p.D762delinsEVVDPPSPSMQALISF | Q5T447 | protein_coding | TCGA-AN-A0G0-01 | Breast | breast invasive carcinoma | Female | <65 | I/II | Unknown | Unknown | SD | ||
| HECTD3 | deletion | Frame_Shift_Del | novel | c.984delT | p.Ile328MetfsTer15 | p.I328Mfs*15 | Q5T447 | protein_coding | TCGA-D8-A27V-01 | Breast | breast invasive carcinoma | Female | <65 | I/II | Hormone Therapy | tamoxiphen | SD | ||
| HECTD3 | SNV | Missense_Mutation | novel | c.2534C>T | p.Ala845Val | p.A845V | Q5T447 | protein_coding | deleterious(0) | possibly_damaging(0.829) | TCGA-2W-A8YY-01 | Cervix | cervical & endocervical cancer | Female | <65 | I/II | Chemotherapy | cisplatin | CR |
| HECTD3 | SNV | Missense_Mutation | rs567272691 | c.1976C>T | p.Thr659Met | p.T659M | Q5T447 | protein_coding | deleterious(0.02) | probably_damaging(0.91) | TCGA-2W-A8YY-01 | Cervix | cervical & endocervical cancer | Female | <65 | I/II | Chemotherapy | cisplatin | CR |
| Page: 1 2 3 4 5 6 7 8 |
Top |
Related drugs of malignant transformation related genes |
| Identification of chemicals and drugs interact with genes involved in malignant transfromation |
| (DGIdb 4.0) |
| Entrez ID | Symbol | Category | Interaction Types | Drug Claim Name | Drug Name | PMIDs |
| Page: 1 |

Copyright 2023-Present -The University of Texas Health Science Center at Houston |