
|
|||||
|
 | |
| |
| |
| |
| |
| |
|
Gene: HECA |
Gene summary for HECA |
| Gene information | Species | Human | Gene symbol | HECA | Gene ID | 51696 |
| Gene name | hdc homolog, cell cycle regulator | |
| Gene Alias | HDC | |
| Cytomap | 6q24.1 | |
| Gene Type | protein-coding | GO ID | GO:0000278 | UniProtAcc | Q9UBI9 |
Top |
Malignant transformation analysis |
| Identification of the aberrant gene expression in precancerous and cancerous lesions by comparing the gene expression of stem-like cells in diseased tissues with normal stem cells |
| Entrez ID | Symbol | Replicates | Species | Organ | Tissue | Adj P-value | Log2FC | Malignancy |
| 51696 | HECA | HCC2_Meng | Human | Liver | HCC | 1.40e-13 | 7.68e-02 | 0.0107 |
| 51696 | HECA | HCC1 | Human | Liver | HCC | 2.48e-08 | 3.33e+00 | 0.5336 |
| 51696 | HECA | HCC2 | Human | Liver | HCC | 1.70e-05 | 2.55e+00 | 0.5341 |
| 51696 | HECA | C30 | Human | Oral cavity | OSCC | 1.29e-28 | 1.32e+00 | 0.3055 |
| 51696 | HECA | C38 | Human | Oral cavity | OSCC | 1.09e-03 | 7.78e-01 | 0.172 |
| 51696 | HECA | C43 | Human | Oral cavity | OSCC | 1.46e-07 | 1.28e-01 | 0.1704 |
| 51696 | HECA | C51 | Human | Oral cavity | OSCC | 3.33e-08 | 5.88e-01 | 0.2674 |
| 51696 | HECA | C57 | Human | Oral cavity | OSCC | 9.80e-08 | 4.03e-01 | 0.1679 |
| 51696 | HECA | C09 | Human | Oral cavity | OSCC | 3.51e-02 | 1.75e-01 | 0.1431 |
| 51696 | HECA | LP15 | Human | Oral cavity | LP | 3.38e-03 | 8.37e-01 | 0.2174 |
| 51696 | HECA | SYSMH1 | Human | Oral cavity | OSCC | 3.23e-07 | 3.22e-01 | 0.1127 |
| 51696 | HECA | SYSMH2 | Human | Oral cavity | OSCC | 7.31e-06 | 2.19e-01 | 0.2326 |
| 51696 | HECA | SYSMH3 | Human | Oral cavity | OSCC | 8.73e-08 | 3.58e-01 | 0.2442 |
| 51696 | HECA | male-WTA | Human | Thyroid | PTC | 1.40e-06 | -1.08e-01 | 0.1037 |
| 51696 | HECA | PTC04 | Human | Thyroid | PTC | 1.16e-11 | -3.66e-02 | 0.1927 |
| 51696 | HECA | PTC05 | Human | Thyroid | PTC | 6.44e-10 | 2.06e-02 | 0.2065 |
| 51696 | HECA | PTC06 | Human | Thyroid | PTC | 1.24e-10 | 4.89e-02 | 0.2057 |
| 51696 | HECA | PTC07 | Human | Thyroid | PTC | 2.18e-14 | -6.09e-02 | 0.2044 |
| 51696 | HECA | ATC12 | Human | Thyroid | ATC | 1.33e-11 | 1.76e-03 | 0.34 |
| 51696 | HECA | ATC13 | Human | Thyroid | ATC | 1.28e-50 | 8.04e-01 | 0.34 |
| Page: 1 2 |
| Tissue | Expression Dynamics | Abbreviation |
| Liver | 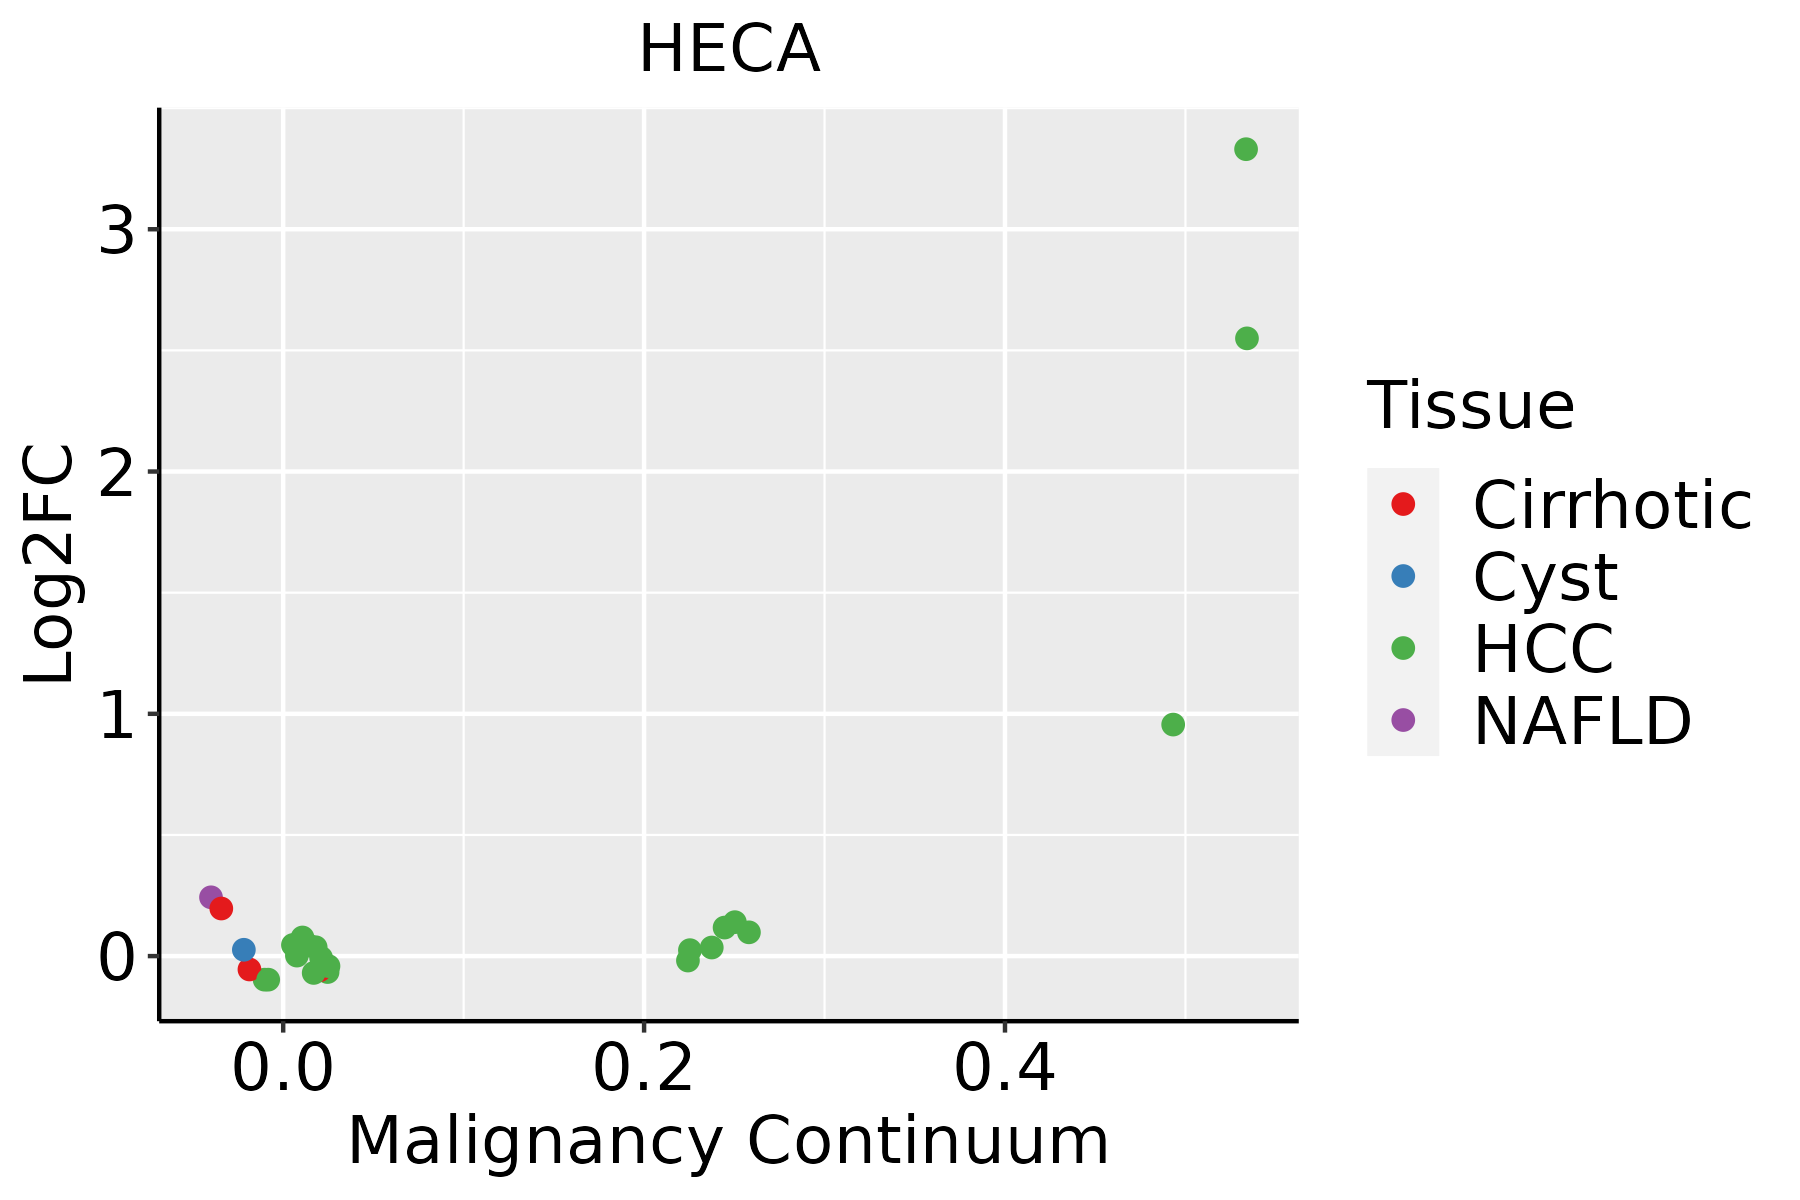 | HCC: Hepatocellular carcinoma |
| NAFLD: Non-alcoholic fatty liver disease | ||
| Oral Cavity |  | EOLP: Erosive Oral lichen planus |
| LP: leukoplakia | ||
| NEOLP: Non-erosive oral lichen planus | ||
| OSCC: Oral squamous cell carcinoma | ||
| Thyroid |  | ATC: Anaplastic thyroid cancer |
| HT: Hashimoto's thyroiditis | ||
| PTC: Papillary thyroid cancer |
| ∗log2FC in expression of this searched gene in stem-like cells from each diseased tissue sample relative to stem-like cells in normal samples in each tissue plotted against the malignancy continuum. Samples are colored based on if they are from different disease stage. |
Top |
Malignant transformation related pathway analysis |
| Find out the enriched GO biological processes and KEGG pathways involved in transition from healthy to precancer to cancer |
| Tissue | Disease Stage | Enriched GO biological Processes |
| Colorectum | AD |  |
| Colorectum | SER |  |
| Colorectum | MSS |  |
| Colorectum | MSI-H |  |
| Colorectum | FAP |  |
| ∗Top 15 enriched GO BP terms are showed in the bar plot of each disease state in each tissue. Each row represents a significant GO biological process which is colored according to the -log10(p.adjust). |
| Page: 1 2 3 4 5 6 7 8 9 |
| GO ID | Tissue | Disease Stage | Description | Gene Ratio | Bg Ratio | pvalue | p.adjust | Count |
| GO:000734611 | Liver | HCC | regulation of mitotic cell cycle | 255/7958 | 457/18723 | 4.96e-09 | 1.30e-07 | 255 |
| GO:0045786 | Liver | HCC | negative regulation of cell cycle | 204/7958 | 385/18723 | 1.84e-05 | 1.99e-04 | 204 |
| GO:0045930 | Liver | HCC | negative regulation of mitotic cell cycle | 130/7958 | 235/18723 | 4.69e-05 | 4.50e-04 | 130 |
| GO:003032311 | Liver | HCC | respiratory tube development | 95/7958 | 181/18723 | 4.15e-03 | 1.81e-02 | 95 |
| GO:00073469 | Oral cavity | OSCC | regulation of mitotic cell cycle | 266/7305 | 457/18723 | 3.87e-17 | 3.41e-15 | 266 |
| GO:00457864 | Oral cavity | OSCC | negative regulation of cell cycle | 206/7305 | 385/18723 | 4.28e-09 | 9.55e-08 | 206 |
| GO:00459304 | Oral cavity | OSCC | negative regulation of mitotic cell cycle | 132/7305 | 235/18723 | 6.51e-08 | 1.16e-06 | 132 |
| GO:00303238 | Oral cavity | OSCC | respiratory tube development | 95/7305 | 181/18723 | 1.53e-04 | 1.07e-03 | 95 |
| GO:000734614 | Oral cavity | LP | regulation of mitotic cell cycle | 163/4623 | 457/18723 | 7.64e-08 | 2.56e-06 | 163 |
| GO:004578612 | Oral cavity | LP | negative regulation of cell cycle | 127/4623 | 385/18723 | 1.33e-04 | 1.53e-03 | 127 |
| GO:004593012 | Oral cavity | LP | negative regulation of mitotic cell cycle | 83/4623 | 235/18723 | 1.62e-04 | 1.82e-03 | 83 |
| GO:000734619 | Thyroid | PTC | regulation of mitotic cell cycle | 212/5968 | 457/18723 | 4.03e-11 | 1.44e-09 | 212 |
| GO:00457867 | Thyroid | PTC | negative regulation of cell cycle | 166/5968 | 385/18723 | 1.93e-06 | 2.64e-05 | 166 |
| GO:00459307 | Thyroid | PTC | negative regulation of mitotic cell cycle | 105/5968 | 235/18723 | 2.41e-05 | 2.39e-04 | 105 |
| GO:003032317 | Thyroid | PTC | respiratory tube development | 80/5968 | 181/18723 | 3.23e-04 | 2.23e-03 | 80 |
| GO:000734622 | Thyroid | ATC | regulation of mitotic cell cycle | 236/6293 | 457/18723 | 7.58e-16 | 5.92e-14 | 236 |
| GO:004578614 | Thyroid | ATC | negative regulation of cell cycle | 181/6293 | 385/18723 | 2.64e-08 | 5.07e-07 | 181 |
| GO:004593015 | Thyroid | ATC | negative regulation of mitotic cell cycle | 117/6293 | 235/18723 | 1.93e-07 | 3.05e-06 | 117 |
| GO:003032321 | Thyroid | ATC | respiratory tube development | 93/6293 | 181/18723 | 5.67e-07 | 8.02e-06 | 93 |
| Page: 1 |
| Pathway ID | Tissue | Disease Stage | Description | Gene Ratio | Bg Ratio | pvalue | p.adjust | qvalue | Count |
| Page: 1 |
Top |
Cell-cell communication analysis |
| Identification of potential cell-cell interactions between two cell types and their ligand-receptor pairs for different disease states |
| Ligand | Receptor | LRpair | Pathway | Tissue | Disease Stage |
| Page: 1 |
Top |
Single-cell gene regulatory network inference analysis |
| Find out the significant the regulons (TFs) and the target genes of each regulon across cell types for different disease states |
| TF | Cell Type | Tissue | Disease Stage | Target Gene | RSS | Regulon Activity |
| ∗The dot plots of a searched regulon are shown for all cell subpopulations in each disease state of each tissue based on the regulon specific score inferred using pySCENIC and by calculating the average expression. |
| Page: 1 |
Top |
Somatic mutation of malignant transformation related genes |
| Annotation of somatic variants for genes involved in malignant transformation |
| Hugo Symbol | Variant Class | Variant Classification | dbSNP RS | HGVSc | HGVSp | HGVSp Short | SWISSPROT | BIOTYPE | SIFT | PolyPhen | Tumor Sample Barcode | Tissue | Histology | Sex | Age | Stage | Therapy Types | Drugs | Outcome |
| HECA | SNV | Missense_Mutation | c.361N>A | p.Glu121Lys | p.E121K | Q9UBI9 | protein_coding | deleterious(0.01) | probably_damaging(0.944) | TCGA-A8-A09Z-01 | Breast | breast invasive carcinoma | Female | >=65 | I/II | Unknown | Unknown | SD | |
| HECA | SNV | Missense_Mutation | rs766148085 | c.1159G>A | p.Ala387Thr | p.A387T | Q9UBI9 | protein_coding | tolerated(0.6) | possibly_damaging(0.617) | TCGA-EA-A410-01 | Cervix | cervical & endocervical cancer | Female | <65 | I/II | Unknown | Unknown | SD |
| HECA | SNV | Missense_Mutation | c.754N>C | p.Glu252Gln | p.E252Q | Q9UBI9 | protein_coding | tolerated(0.1) | probably_damaging(0.994) | TCGA-IR-A3LI-01 | Cervix | cervical & endocervical cancer | Female | <65 | I/II | Chemotherapy | cisplatin | CR | |
| HECA | SNV | Missense_Mutation | rs759180001 | c.1096G>A | p.Val366Met | p.V366M | Q9UBI9 | protein_coding | deleterious(0) | probably_damaging(0.998) | TCGA-A6-6653-01 | Colorectum | colon adenocarcinoma | Male | >=65 | I/II | Unknown | Unknown | SD |
| HECA | SNV | Missense_Mutation | c.1448N>T | p.Ala483Val | p.A483V | Q9UBI9 | protein_coding | deleterious(0) | probably_damaging(0.994) | TCGA-AA-3663-01 | Colorectum | colon adenocarcinoma | Male | <65 | I/II | Unknown | Unknown | SD | |
| HECA | SNV | Missense_Mutation | novel | c.1124N>A | p.Gly375Asp | p.G375D | Q9UBI9 | protein_coding | deleterious(0.03) | probably_damaging(1) | TCGA-AA-3877-01 | Colorectum | colon adenocarcinoma | Female | >=65 | I/II | Unknown | Unknown | SD |
| HECA | SNV | Missense_Mutation | c.627N>T | p.Lys209Asn | p.K209N | Q9UBI9 | protein_coding | deleterious(0) | possibly_damaging(0.787) | TCGA-AA-A010-01 | Colorectum | colon adenocarcinoma | Female | <65 | I/II | Chemotherapy | folinic | CR | |
| HECA | SNV | Missense_Mutation | c.988G>T | p.Ala330Ser | p.A330S | Q9UBI9 | protein_coding | tolerated_low_confidence(0.63) | benign(0) | TCGA-AA-A01K-01 | Colorectum | colon adenocarcinoma | Female | >=65 | III/IV | Chemotherapy | folinic | CR | |
| HECA | SNV | Missense_Mutation | rs760164332 | c.448N>T | p.Arg150Cys | p.R150C | Q9UBI9 | protein_coding | deleterious(0) | probably_damaging(0.997) | TCGA-AD-A5EJ-01 | Colorectum | colon adenocarcinoma | Female | >=65 | I/II | Unknown | Unknown | SD |
| HECA | SNV | Missense_Mutation | c.465N>G | p.Asn155Lys | p.N155K | Q9UBI9 | protein_coding | deleterious(0.01) | possibly_damaging(0.907) | TCGA-AY-6197-01 | Colorectum | colon adenocarcinoma | Male | <65 | I/II | Unknown | Unknown | SD |
| Page: 1 2 3 4 5 6 7 8 |
Top |
Related drugs of malignant transformation related genes |
| Identification of chemicals and drugs interact with genes involved in malignant transfromation |
| (DGIdb 4.0) |
| Entrez ID | Symbol | Category | Interaction Types | Drug Claim Name | Drug Name | PMIDs |
| Page: 1 |

Copyright 2023-Present -The University of Texas Health Science Center at Houston |