Schematic overview of the cellular and molecular mechanisms involved in the cancer progression, including the proposed cellular and molecular mechanisms in cancer cells trajectory. AT1: alveolar type 1 cells; AT2: alveolar type 2 cells; AAH: atypical adenomatous hyperplasia; AIS: adenocarcinoma in situ; MIA: minimally invasive adenocarcinoma; IA: invasive adenocarcinoma; EMT: epithelial-mesenchymal transition

Home

Download

Statistics

Help

Contact

Center for Computational Systems Medicine
leaf

Gene summary

leaf

Malignant transformation analysis

leaf

Malignant transformation related pathway analysis

leaf

Cell-cell communication analysis

leaf

Single-cell gene regulatory network inference analysis

leaf

Somatic mutation of malignant transformation related genes

leaf

Related drugs of malignant transformation related genes

Gene: HEBP2

Gene summary for HEBP2

check button Gene summary.

Gene informationSpeciesHuman
Gene symbol

HEBP2

Gene ID

23593

Gene nameheme binding protein 2
Gene AliasC6ORF34B
Cytomap6q24.1
Gene Typeprotein-coding
GO ID

GO:0006810

UniProtAcc

Q5THN1


Top

Malignant transformation analysis

check button Identification of the aberrant gene expression in precancerous and cancerous lesions by comparing the gene expression of stem-like cells in diseased tissues with normal stem cells
check button Malignant transformation involving gene list.
Entrez IDSymbolReplicatesSpeciesOrganTissueAdj P-valueLog2FCMalignancy
23593HEBP2GSM4909280HumanBreastPrecancer2.06e-08-7.70e-010.0305
23593HEBP2GSM4909286HumanBreastIDC2.79e-103.17e-010.1081
23593HEBP2GSM4909287HumanBreastIDC3.77e-043.00e-010.2057
23593HEBP2GSM4909289HumanBreastIDC2.73e-157.47e-010.1064
23593HEBP2GSM4909290HumanBreastIDC1.63e-155.69e-010.2096
23593HEBP2GSM4909294HumanBreastIDC2.18e-063.59e-020.2022
23593HEBP2GSM4909296HumanBreastIDC1.12e-32-6.69e-010.1524
23593HEBP2GSM4909297HumanBreastIDC9.96e-19-3.74e-010.1517
23593HEBP2GSM4909298HumanBreastIDC1.38e-073.02e-010.1551
23593HEBP2GSM4909301HumanBreastIDC4.80e-031.82e-010.1577
23593HEBP2GSM4909302HumanBreastIDC1.67e-04-3.41e-010.1545
23593HEBP2GSM4909304HumanBreastIDC2.82e-03-3.97e-010.1636
23593HEBP2GSM4909306HumanBreastIDC3.48e-062.83e-010.1564
23593HEBP2GSM4909311HumanBreastIDC1.59e-43-5.24e-010.1534
23593HEBP2GSM4909312HumanBreastIDC2.23e-12-2.96e-010.1552
23593HEBP2GSM4909315HumanBreastIDC4.71e-507.09e-010.21
23593HEBP2GSM4909316HumanBreastIDC2.87e-114.36e-010.21
23593HEBP2GSM4909317HumanBreastIDC7.36e-043.55e-010.1355
23593HEBP2GSM4909319HumanBreastIDC6.34e-50-6.24e-010.1563
23593HEBP2GSM4909320HumanBreastIDC1.73e-07-5.47e-010.1575
Page: 1 2 3 4 5 6 7 8 9 10 11 

check button Transcriptomic changes along malignancy continuum.
TissueExpression DynamicsAbbreviation
BreastThe image shows the transcriptomic changes along malignancy continuum.log2FC in expression of this searched gene in stem-like cells from each diseased tissue sample relative to stem-like cells in normal samples in each tissue plotted against the malignancy continuum. Samples are colored based on if they are from different disease stage.
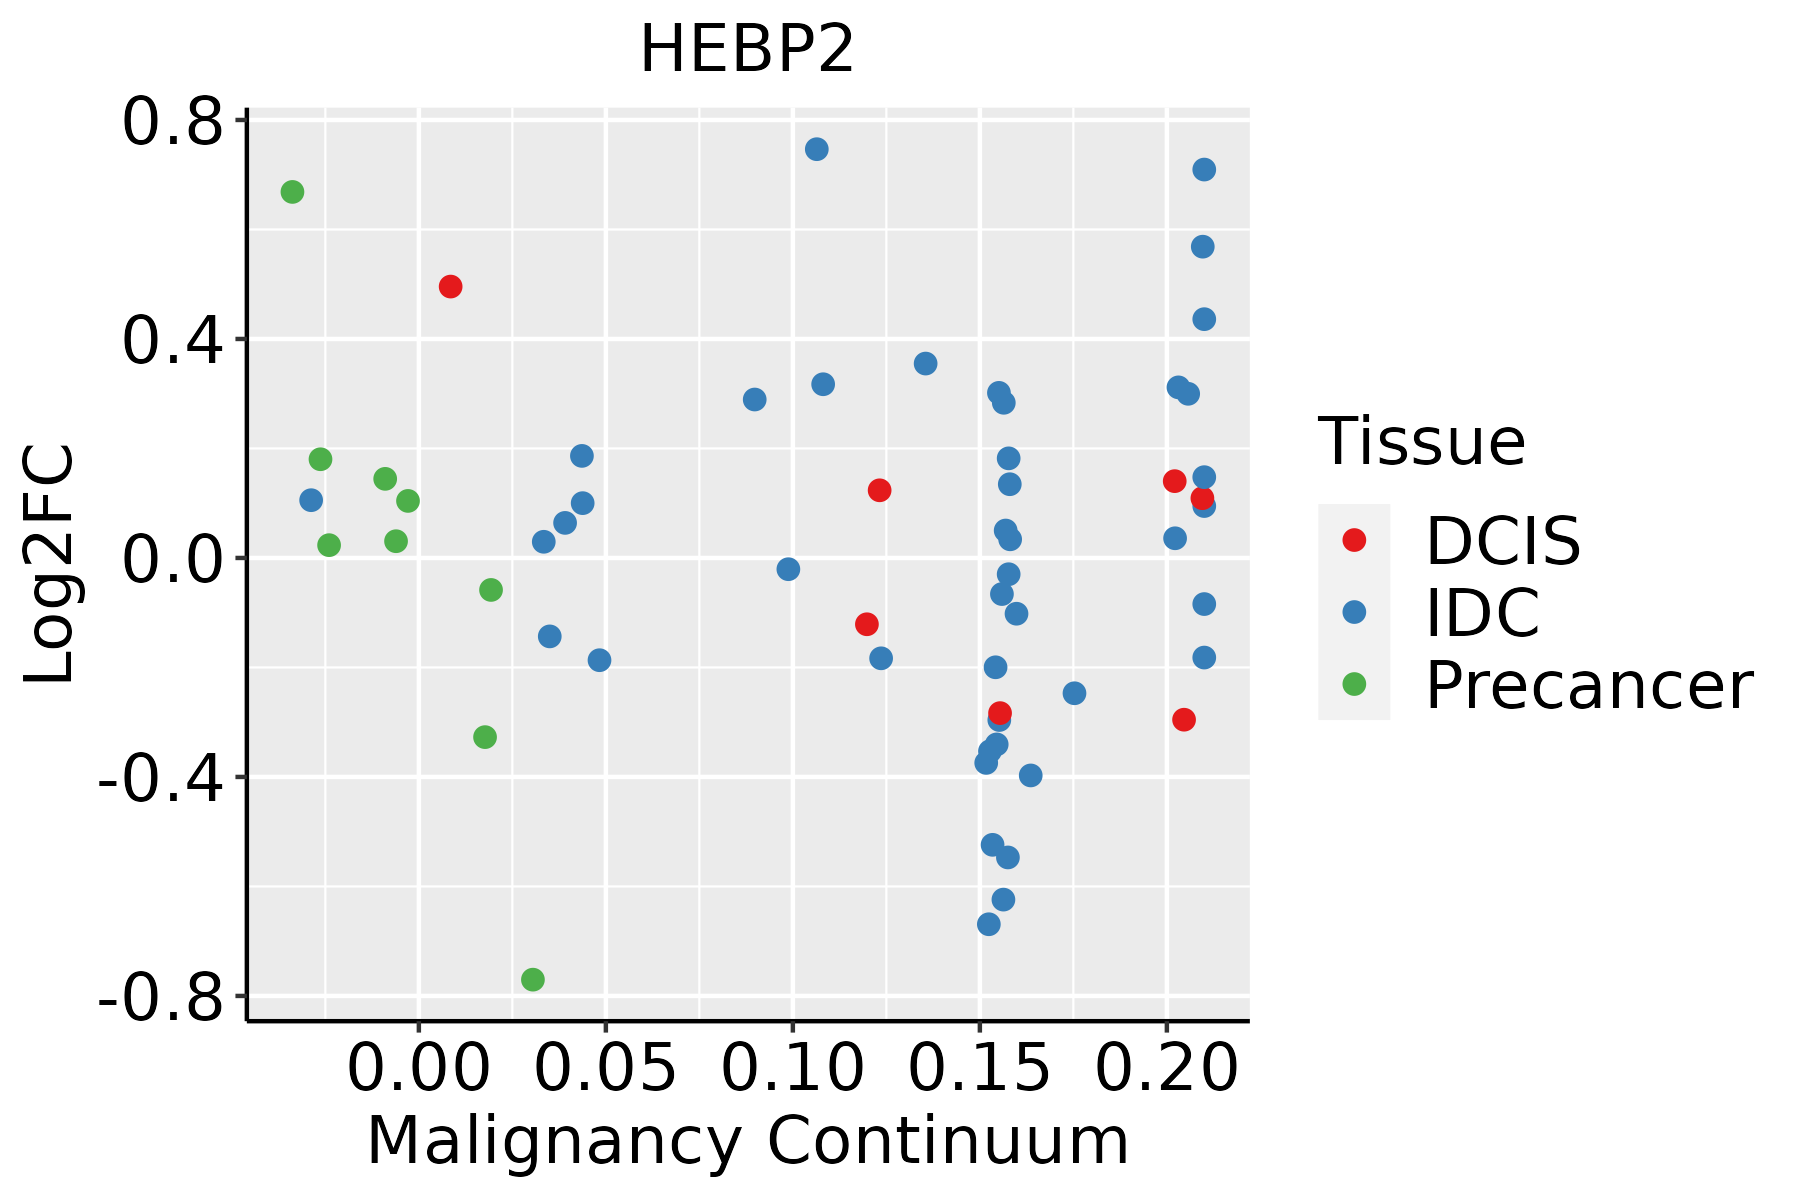
IDC: Invasive ductal carcinoma
DCIS: Ductal carcinoma in situ
Precancer(BRCA1-mut): Precancerous lesion from BRCA1 mutation carriers
Colorectum (GSE201348)The image shows the transcriptomic changes along malignancy continuum.log2FC in expression of this searched gene in stem-like cells from each diseased tissue sample relative to stem-like cells in normal samples in each tissue plotted against the malignancy continuum. Samples are colored based on if they are from different disease stage.FAP: Familial adenomatous polyposis
CRC: Colorectal cancer
Colorectum (HTA11)The image shows the transcriptomic changes along malignancy continuum.log2FC in expression of this searched gene in stem-like cells from each diseased tissue sample relative to stem-like cells in normal samples in each tissue plotted against the malignancy continuum. Samples are colored based on if they are from different disease stage.AD: Adenomas
SER: Sessile serrated lesions
MSI-H: Microsatellite-high colorectal cancer
MSS: Microsatellite stable colorectal cancer
EndometriumThe image shows the transcriptomic changes along malignancy continuum.log2FC in expression of this searched gene in stem-like cells from each diseased tissue sample relative to stem-like cells in normal samples in each tissue plotted against the malignancy continuum. Samples are colored based on if they are from different disease stage.
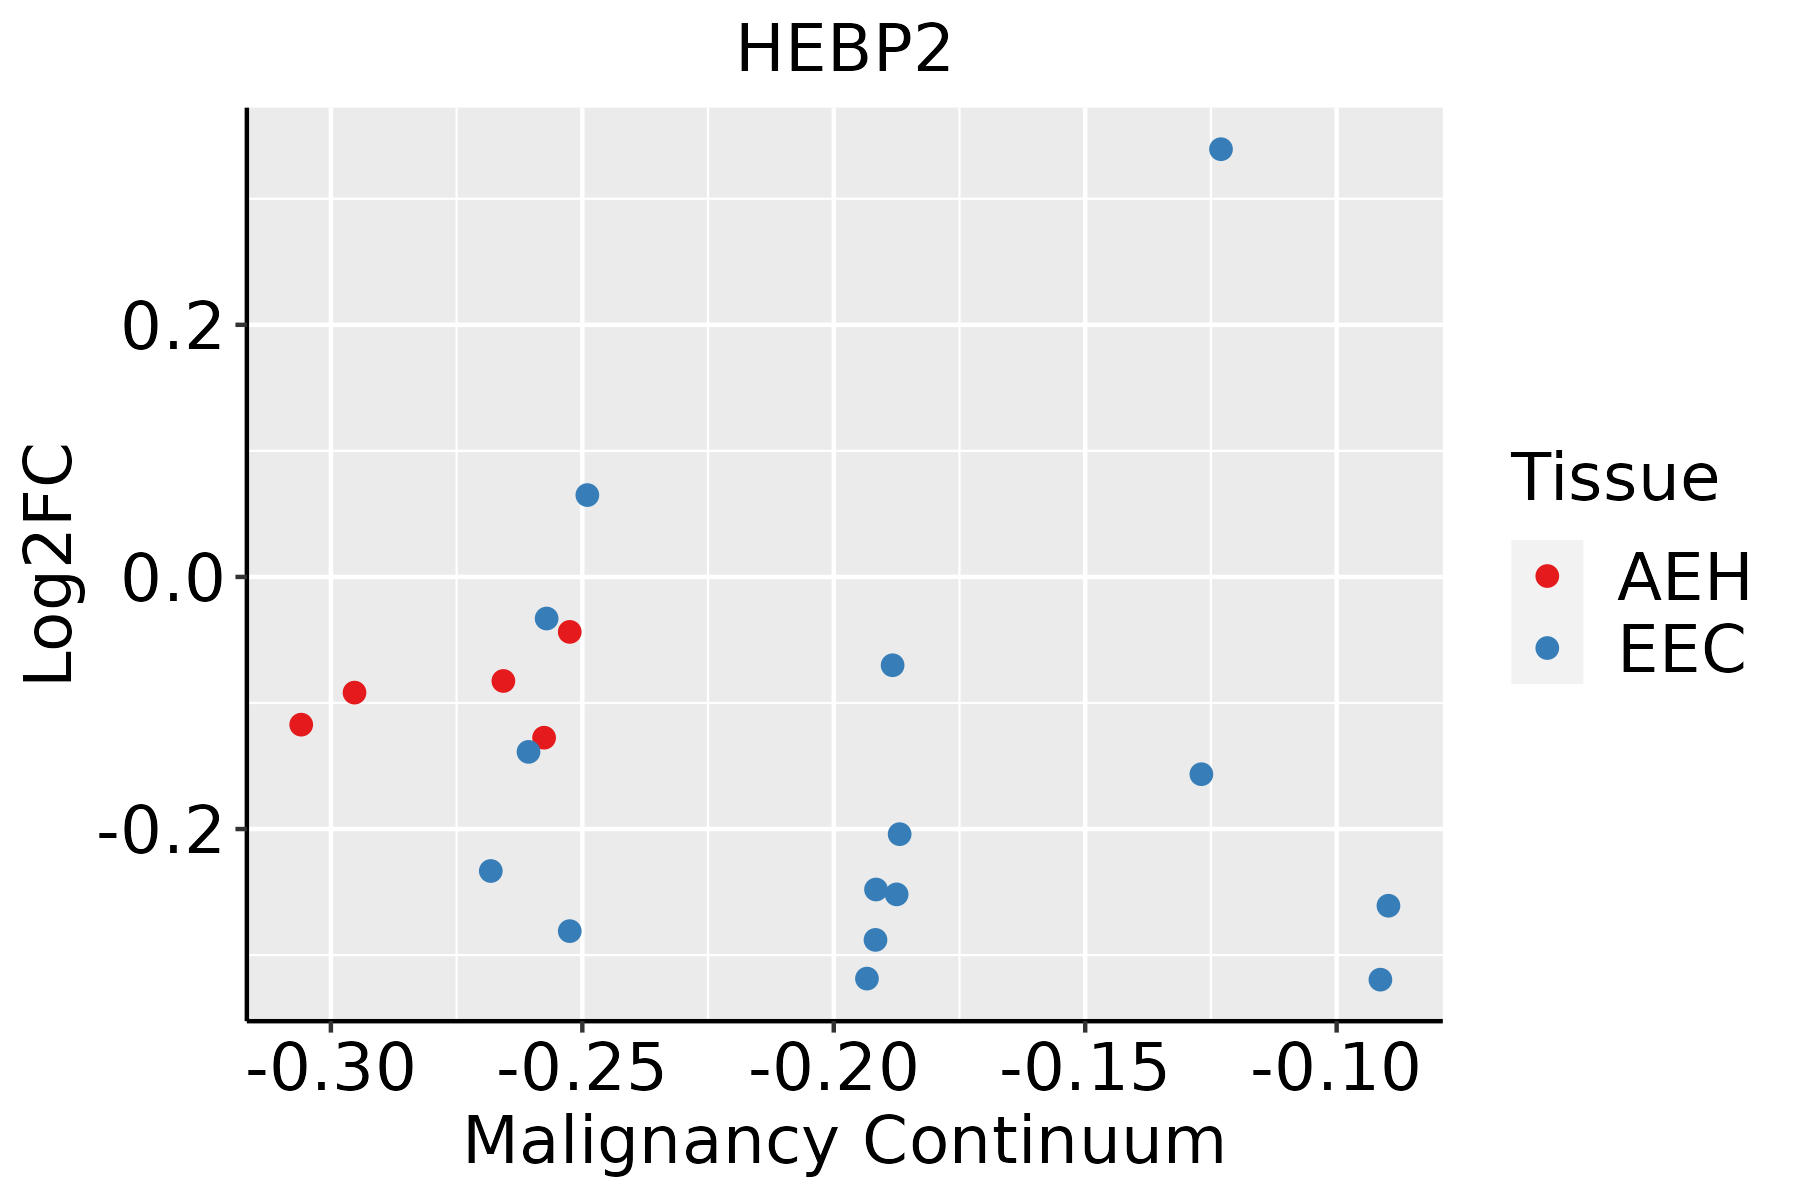
AEH: Atypical endometrial hyperplasia
EEC: Endometrioid Cancer
EsophagusThe image shows the transcriptomic changes along malignancy continuum.log2FC in expression of this searched gene in stem-like cells from each diseased tissue sample relative to stem-like cells in normal samples in each tissue plotted against the malignancy continuum. Samples are colored based on if they are from different disease stage.
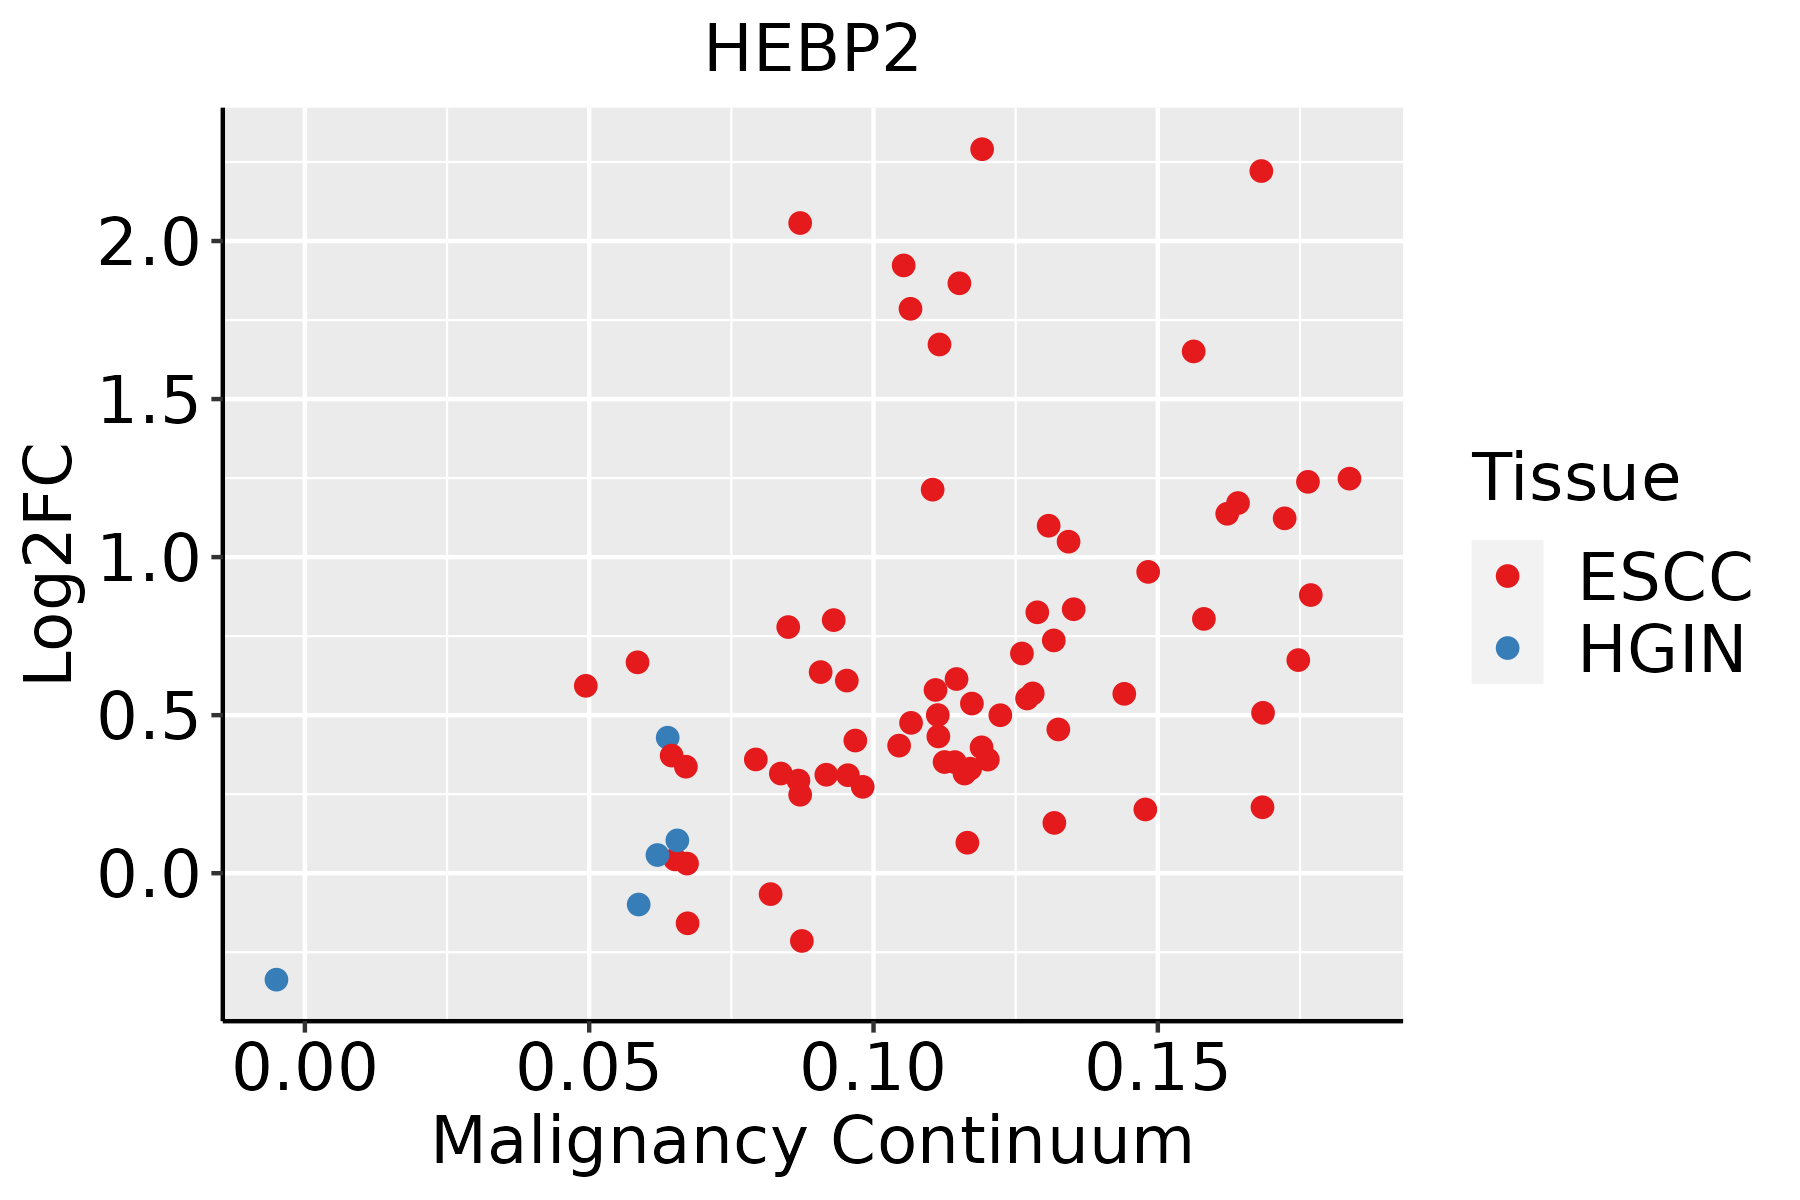
ESCC: Esophageal squamous cell carcinoma
HGIN: High-grade intraepithelial neoplasias
LGIN: Low-grade intraepithelial neoplasias
LiverThe image shows the transcriptomic changes along malignancy continuum.log2FC in expression of this searched gene in stem-like cells from each diseased tissue sample relative to stem-like cells in normal samples in each tissue plotted against the malignancy continuum. Samples are colored based on if they are from different disease stage.
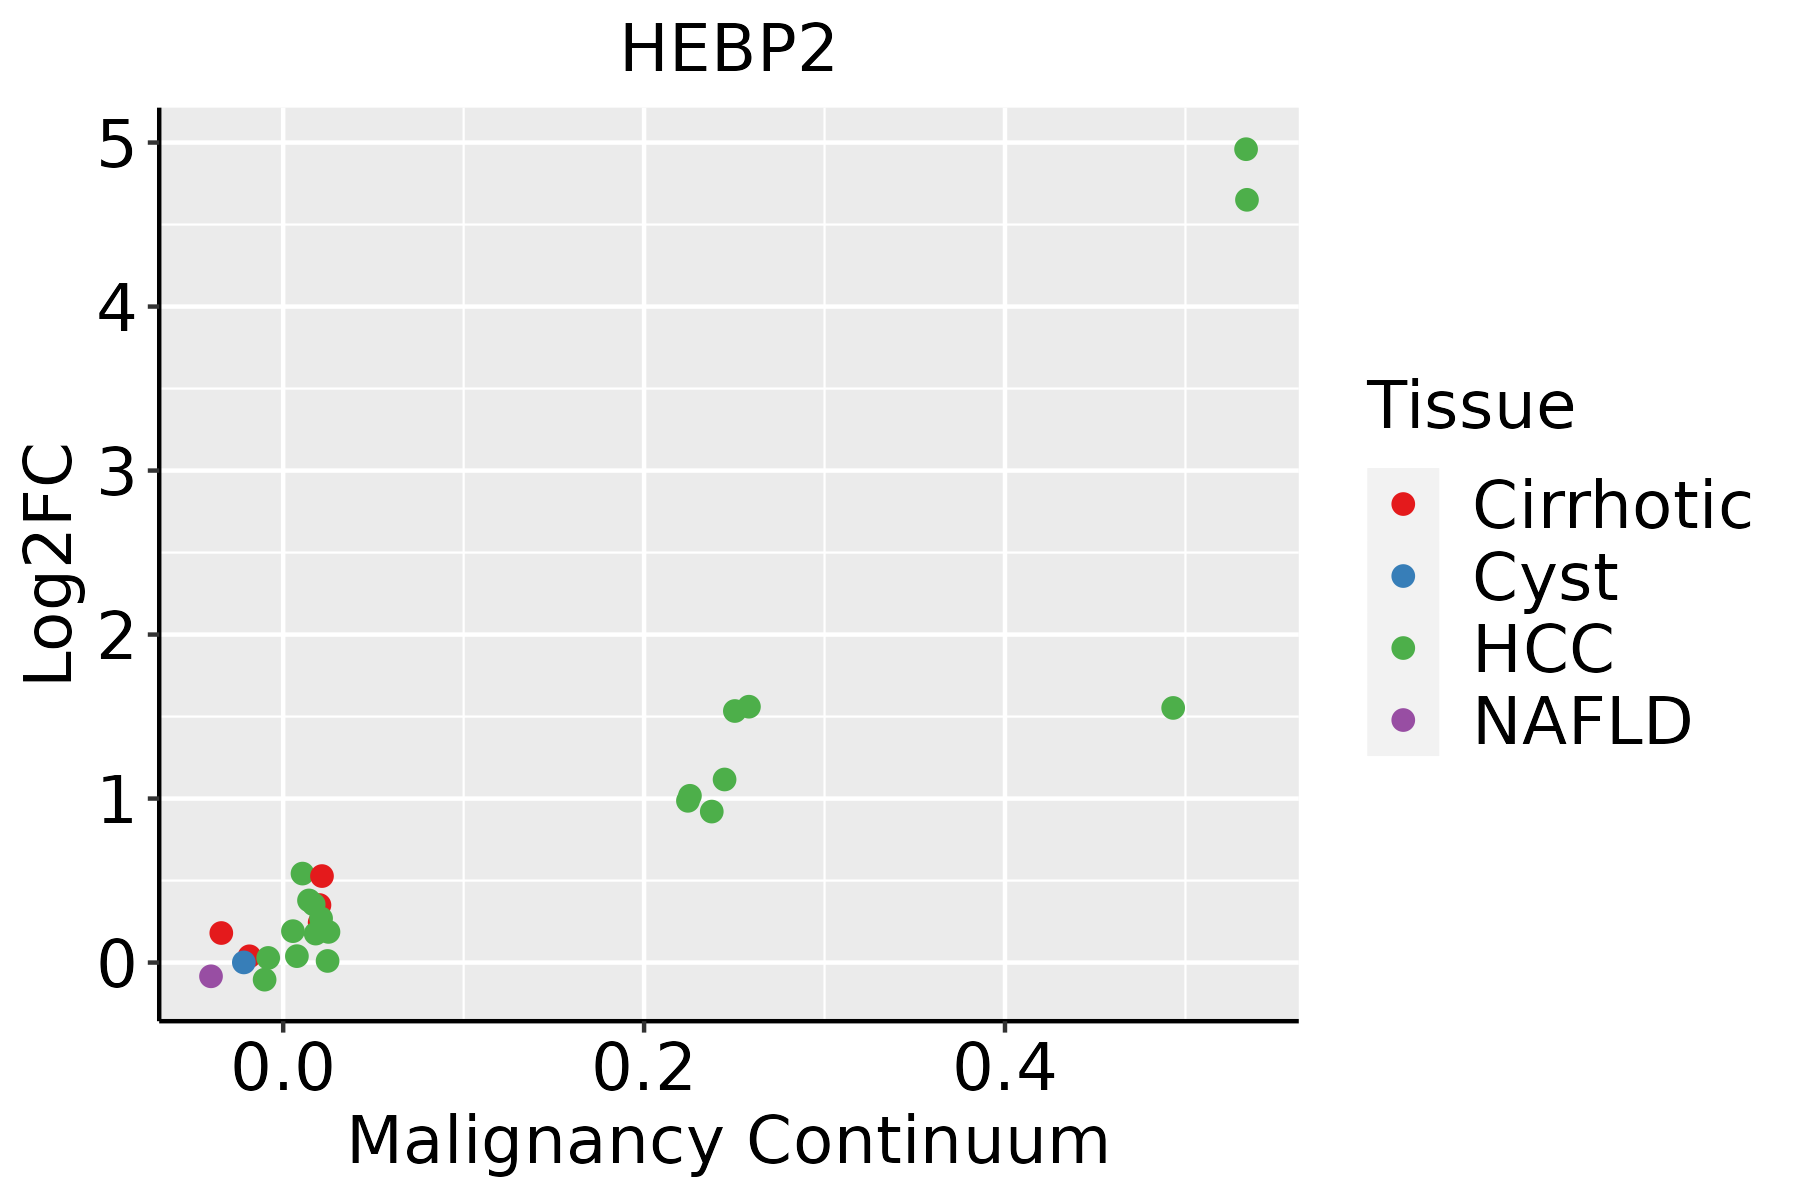
HCC: Hepatocellular carcinoma
NAFLD: Non-alcoholic fatty liver disease
Oral CavityThe image shows the transcriptomic changes along malignancy continuum.log2FC in expression of this searched gene in stem-like cells from each diseased tissue sample relative to stem-like cells in normal samples in each tissue plotted against the malignancy continuum. Samples are colored based on if they are from different disease stage.
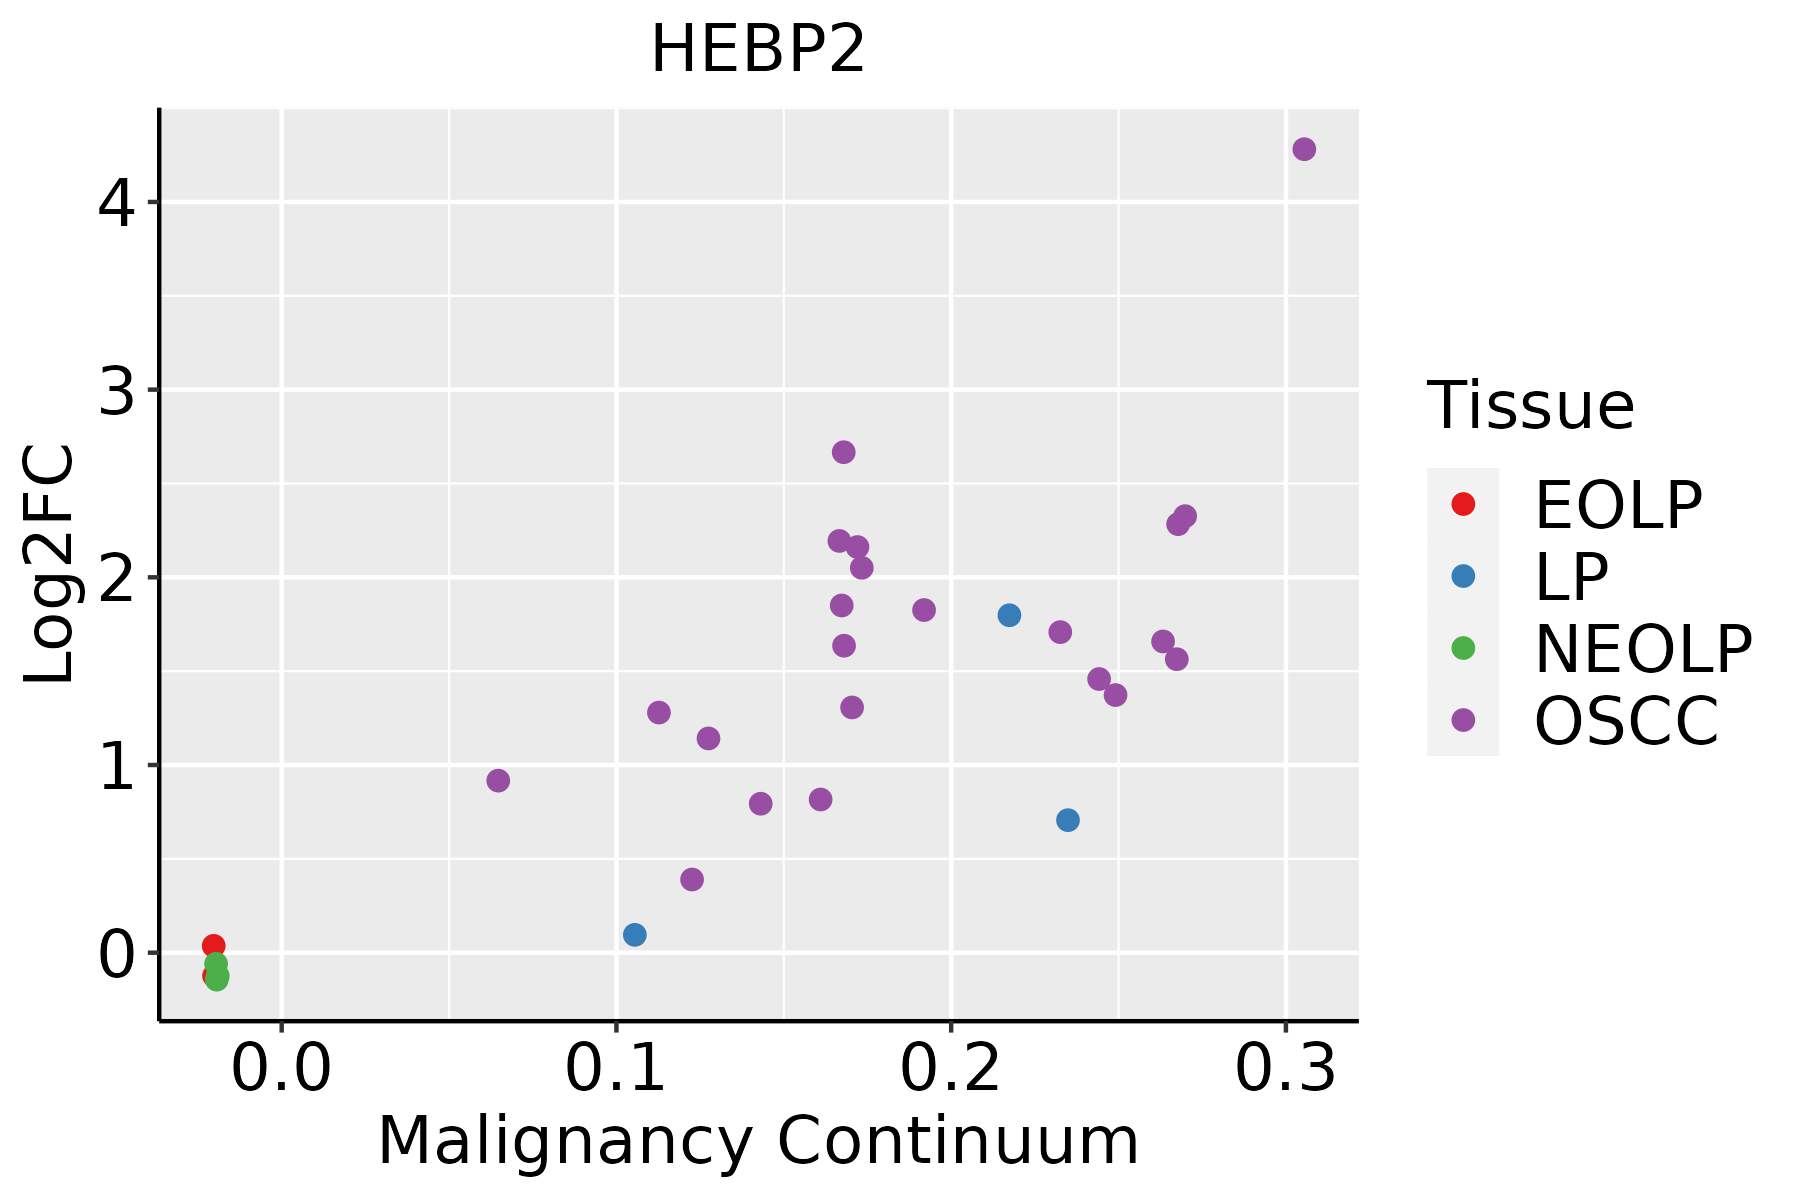
EOLP: Erosive Oral lichen planus
LP: leukoplakia
NEOLP: Non-erosive oral lichen planus
OSCC: Oral squamous cell carcinoma
ProstateThe image shows the transcriptomic changes along malignancy continuum.log2FC in expression of this searched gene in stem-like cells from each diseased tissue sample relative to stem-like cells in normal samples in each tissue plotted against the malignancy continuum. Samples are colored based on if they are from different disease stage.
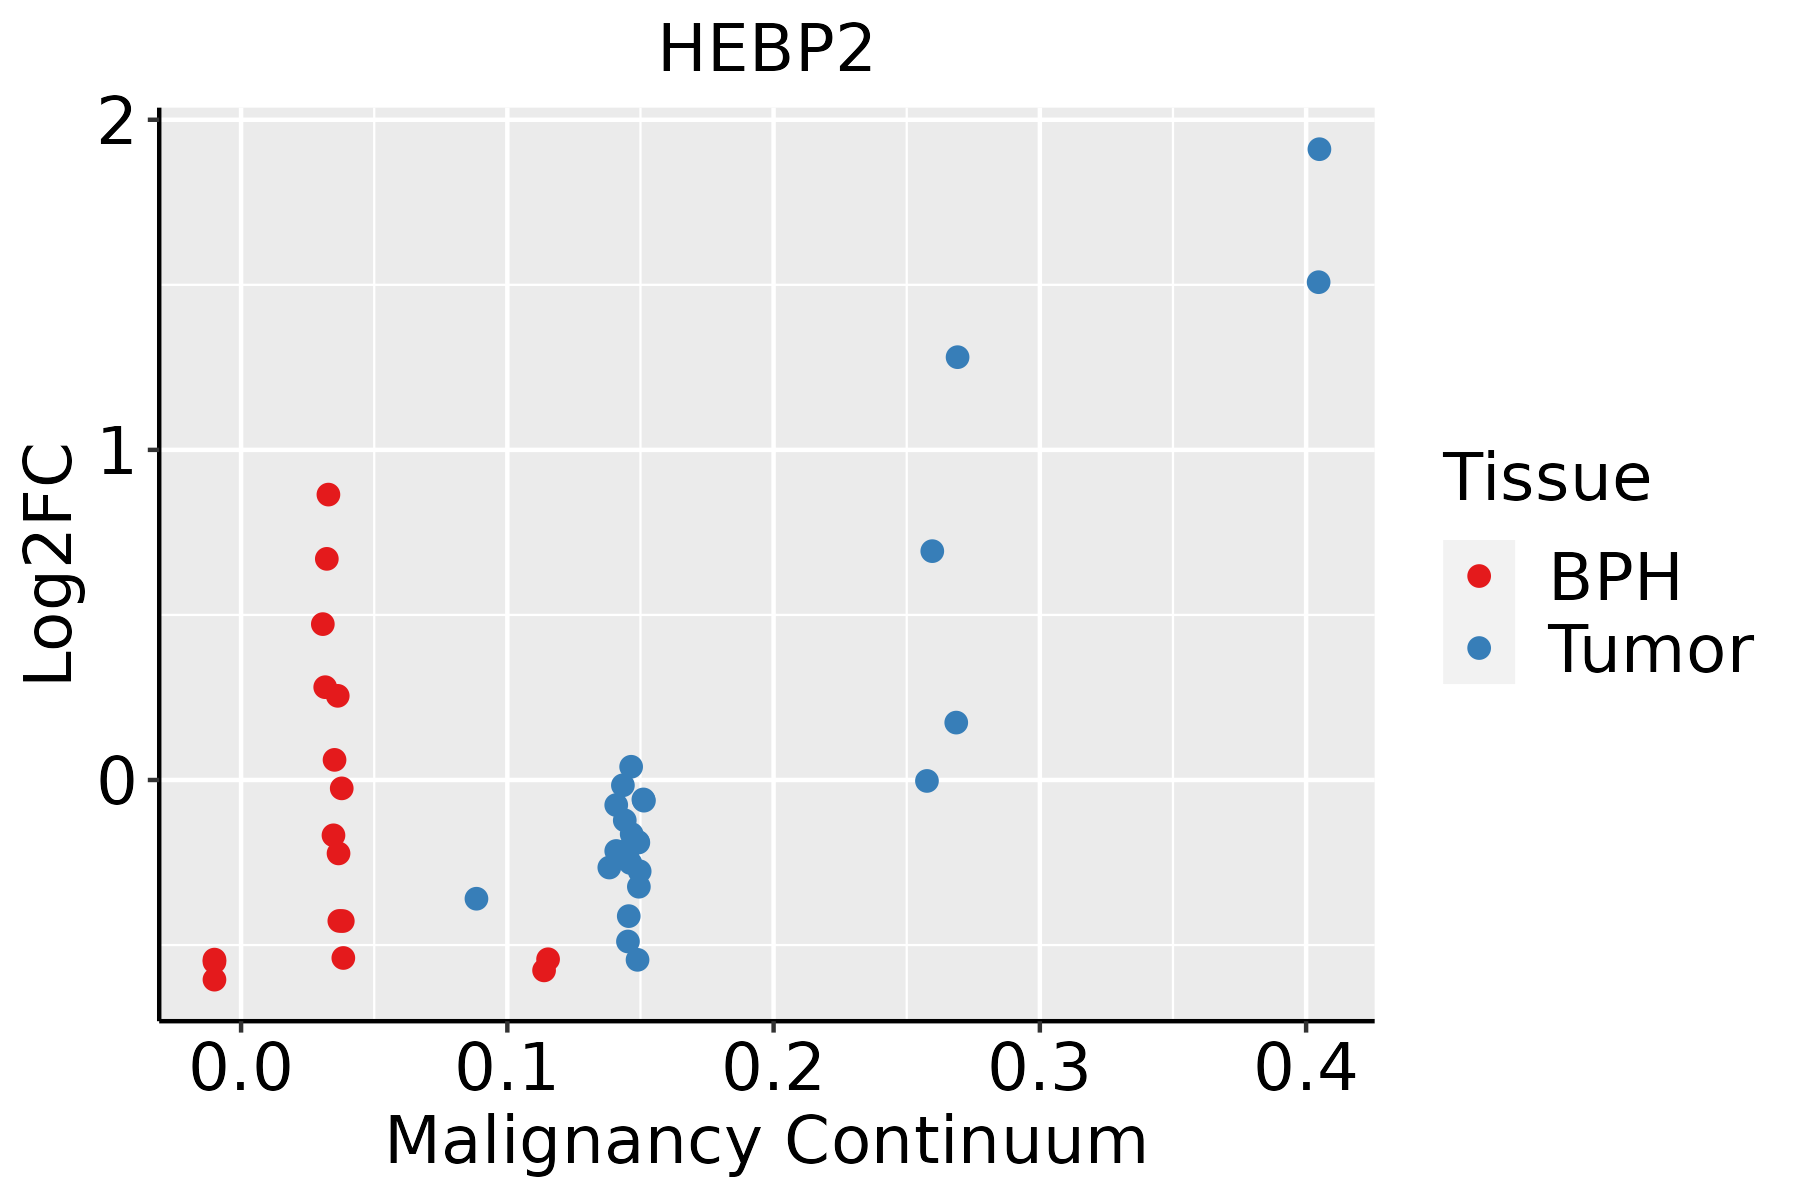
BPH: Benign Prostatic Hyperplasia
SkinThe image shows the transcriptomic changes along malignancy continuum.log2FC in expression of this searched gene in stem-like cells from each diseased tissue sample relative to stem-like cells in normal samples in each tissue plotted against the malignancy continuum. Samples are colored based on if they are from different disease stage.
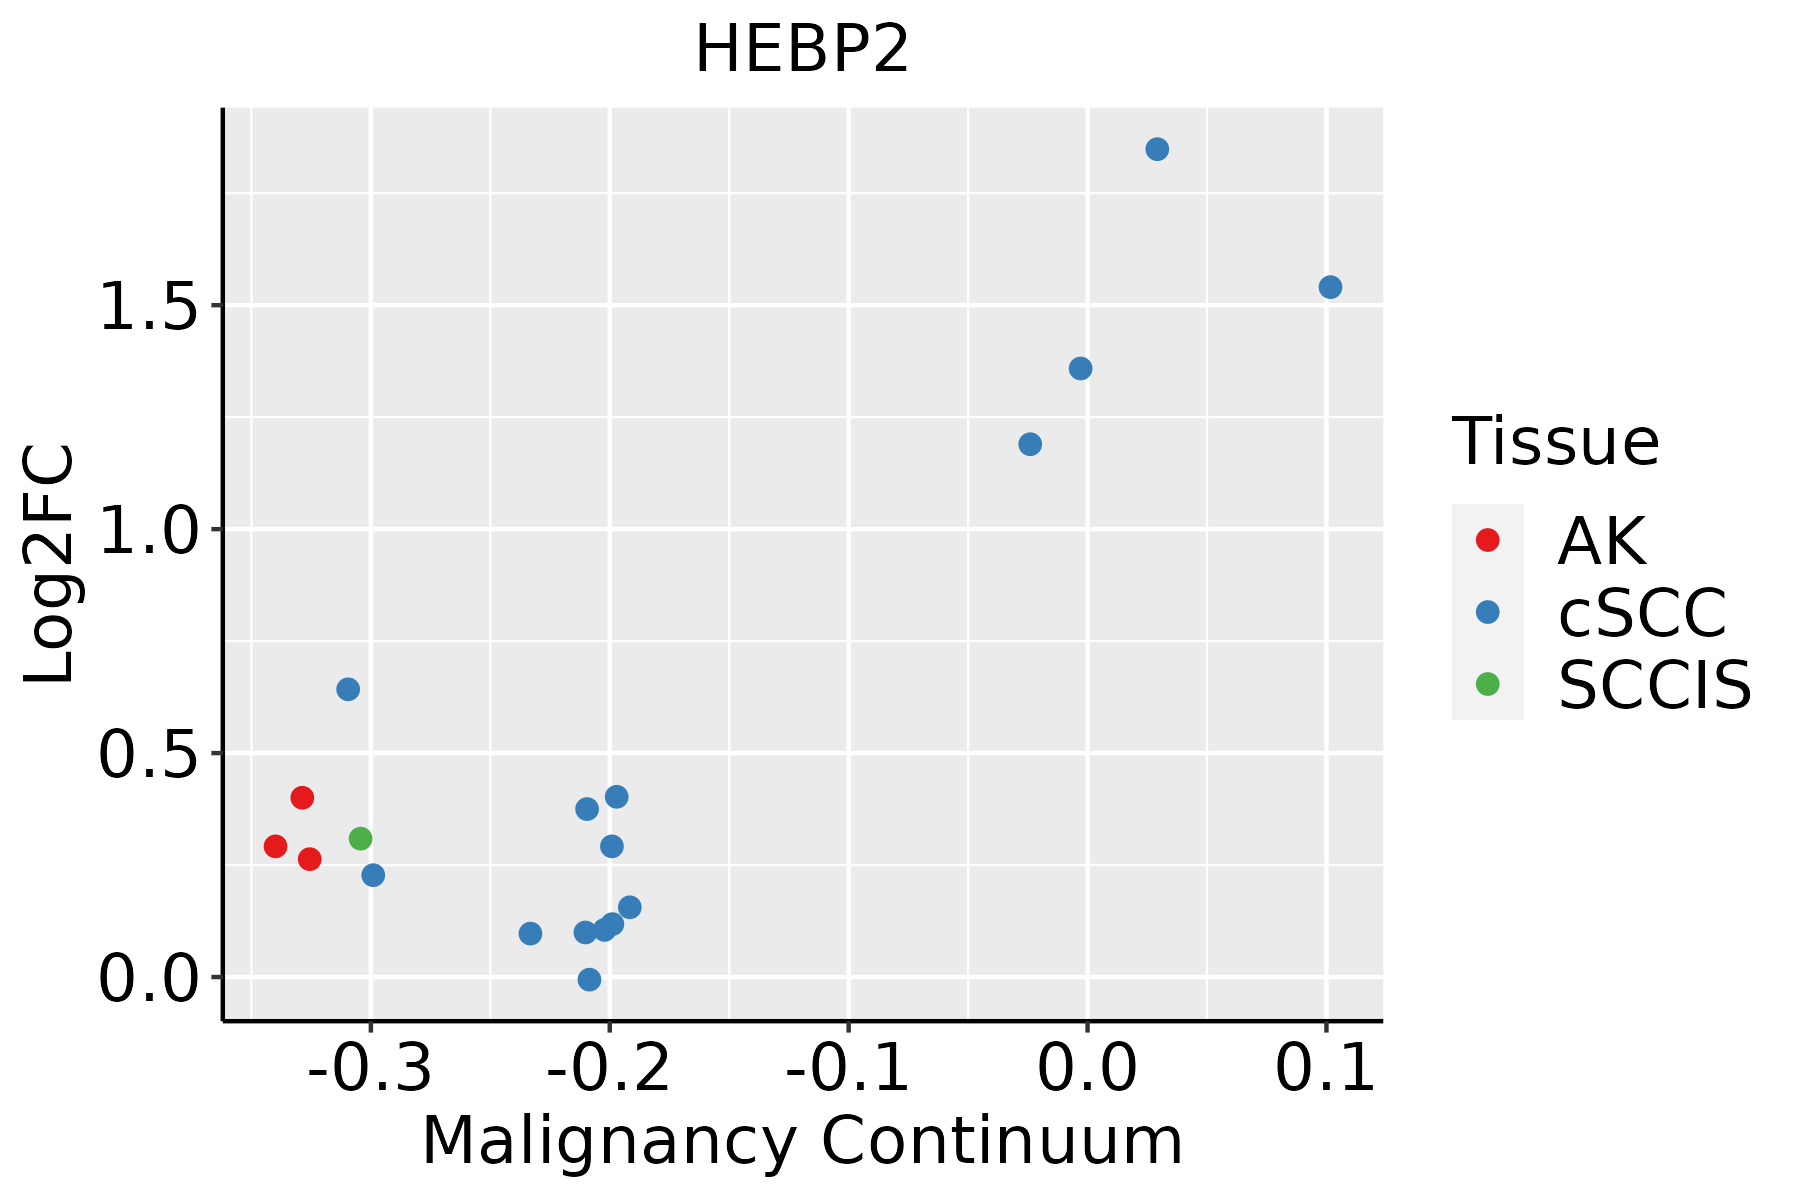
AK: Actinic keratosis
cSCC: Cutaneous squamous cell carcinoma
SCCIS:squamous cell carcinoma in situ
ThyroidThe image shows the transcriptomic changes along malignancy continuum.log2FC in expression of this searched gene in stem-like cells from each diseased tissue sample relative to stem-like cells in normal samples in each tissue plotted against the malignancy continuum. Samples are colored based on if they are from different disease stage.
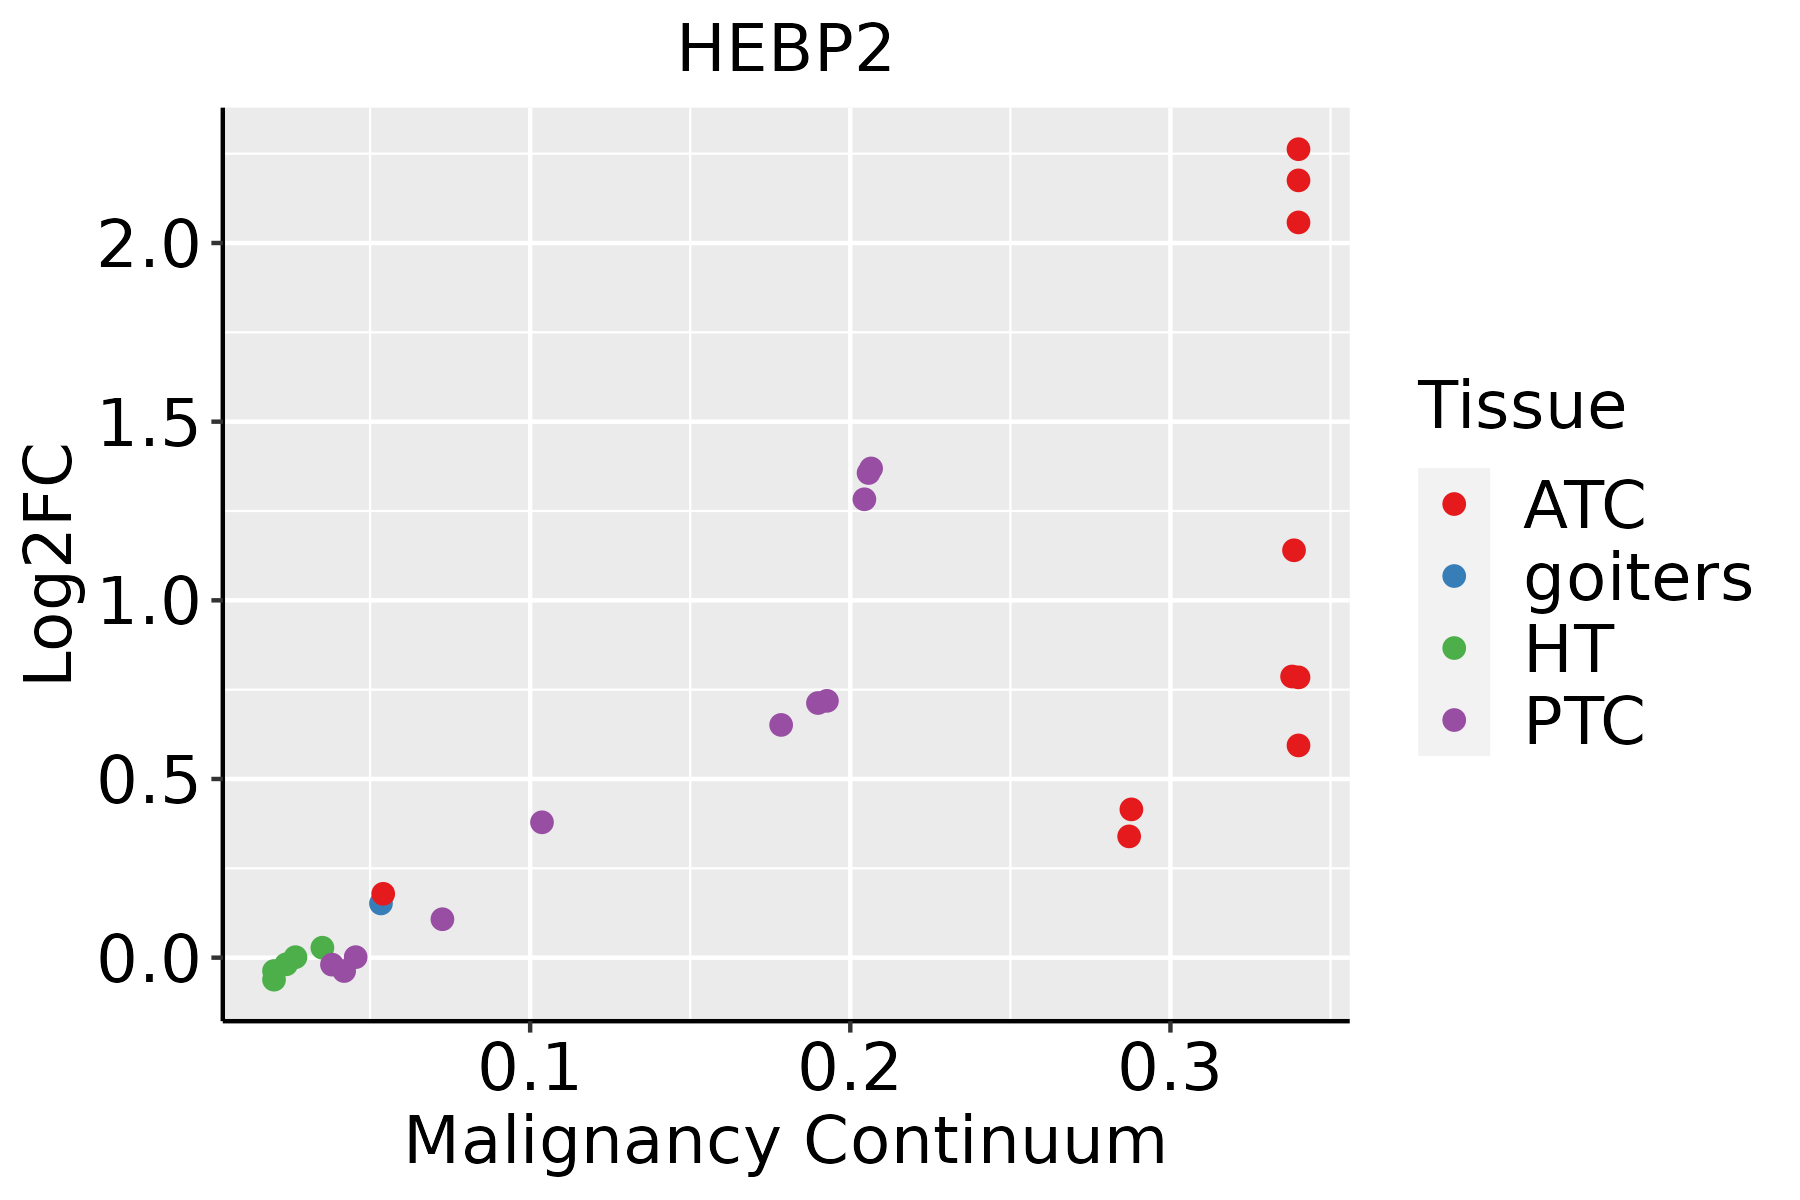
ATC: Anaplastic thyroid cancer
HT: Hashimoto's thyroiditis
PTC: Papillary thyroid cancer
∗log2FC in expression of this searched gene in stem-like cells from each diseased tissue sample relative to stem-like cells in normal samples in each tissue plotted against the malignancy continuum. Samples are colored based on if they are from different disease stage.

Top

Malignant transformation related pathway analysis

check buttonFind out the enriched GO biological processes and KEGG pathways involved in transition from healthy to precancer to cancer
check button Figure of enriched GO biological processes.
TissueDisease StageEnriched GO biological Processes
ColorectumADGO analysis - Figure of enriched GO biological processes: Top 15 enriched GO BP terms are showed in the bar plot of each disease state in each tissue. Each row represents a significant GO biological process which is colored according to the -log10(p.adjust).
ColorectumSERGO analysis - Figure of enriched GO biological processes: Top 15 enriched GO BP terms are showed in the bar plot of each disease state in each tissue. Each row represents a significant GO biological process which is colored according to the -log10(p.adjust).
ColorectumMSSGO analysis - Figure of enriched GO biological processes: Top 15 enriched GO BP terms are showed in the bar plot of each disease state in each tissue. Each row represents a significant GO biological process which is colored according to the -log10(p.adjust).
ColorectumMSI-HGO analysis - Figure of enriched GO biological processes: Top 15 enriched GO BP terms are showed in the bar plot of each disease state in each tissue. Each row represents a significant GO biological process which is colored according to the -log10(p.adjust).
ColorectumFAPGO analysis - Figure of enriched GO biological processes: Top 15 enriched GO BP terms are showed in the bar plot of each disease state in each tissue. Each row represents a significant GO biological process which is colored according to the -log10(p.adjust).
∗Top 15 enriched GO BP terms are showed in the bar plot of each disease state in each tissue. Each row represents a significant GO biological process which is colored according to the -log10(p.adjust).
Page: 1 2 3 4 5 6 7 8 9 

check button Enriched GO biological processes.
GO IDTissueDisease StageDescriptionGene RatioBg Ratiopvaluep.adjustCount
GO:00068398BreastPrecancermitochondrial transport45/1080254/187231.37e-111.88e-0945
GO:00518816BreastPrecancerregulation of mitochondrial membrane potential18/108074/187231.45e-077.82e-0618
GO:00070066BreastPrecancermitochondrial membrane organization20/1080116/187239.88e-062.61e-0420
GO:00905595BreastPrecancerregulation of membrane permeability15/108078/187233.35e-057.29e-0415
GO:0010917BreastPrecancernegative regulation of mitochondrial membrane potential6/108013/187234.39e-059.40e-046
GO:00469025BreastPrecancerregulation of mitochondrial membrane permeability13/108063/187235.13e-051.07e-0313
GO:0045837BreastPrecancernegative regulation of membrane potential6/108014/187237.30e-051.44e-036
GO:0010939BreastPrecancerregulation of necrotic cell death9/108042/187235.42e-046.97e-039
GO:00357945BreastPrecancerpositive regulation of mitochondrial membrane permeability9/108043/187236.51e-047.99e-039
GO:0070265BreastPrecancernecrotic cell death11/108062/187237.54e-049.01e-0311
GO:19057105BreastPrecancerpositive regulation of membrane permeability9/108048/187231.49e-031.54e-029
GO:000683913BreastIDCmitochondrial transport51/1434254/187231.54e-101.83e-0851
GO:005188113BreastIDCregulation of mitochondrial membrane potential19/143474/187232.04e-068.27e-0519
GO:00458371BreastIDCnegative regulation of membrane potential7/143414/187233.23e-057.50e-047
GO:009055913BreastIDCregulation of membrane permeability17/143478/187236.88e-051.40e-0317
GO:000700613BreastIDCmitochondrial membrane organization21/1434116/187231.78e-043.00e-0321
GO:00109171BreastIDCnegative regulation of mitochondrial membrane potential6/143413/187232.14e-043.45e-036
GO:004690213BreastIDCregulation of mitochondrial membrane permeability14/143463/187232.37e-043.75e-0314
GO:190571012BreastIDCpositive regulation of membrane permeability11/143448/187238.22e-049.65e-0311
GO:003579413BreastIDCpositive regulation of mitochondrial membrane permeability10/143443/187231.25e-031.33e-0210
Page: 1 2 3 4 5 6 7 8 

check button Enriched KEGG pathways.
Pathway IDTissueDisease StageDescriptionGene RatioBg Ratiopvaluep.adjustqvalueCount
Page: 1 

Top

Cell-cell communication analysis

check buttonIdentification of potential cell-cell interactions between two cell types and their ligand-receptor pairs for different disease states
LigandReceptorLRpairPathwayTissueDisease Stage
Page: 1 

Top

Single-cell gene regulatory network inference analysis

check buttonFind out the significant the regulons (TFs) and the target genes of each regulon across cell types for different disease states
TFCell TypeTissueDisease StageTarget GeneRSSRegulon Activity
∗The dot plots of a searched regulon are shown for all cell subpopulations in each disease state of each tissue based on the regulon specific score inferred using pySCENIC and by calculating the average expression.
Page: 1 

Top

Somatic mutation of malignant transformation related genes

check buttonAnnotation of somatic variants for genes involved in malignant transformation
Hugo SymbolVariant ClassVariant ClassificationdbSNP RSHGVScHGVSpHGVSp ShortSWISSPROTBIOTYPESIFTPolyPhenTumor Sample BarcodeTissueHistologySexAgeStageTherapy TypesDrugsOutcome
HEBP2SNVMissense_Mutationnovelc.290N>Tp.Ser97Leup.S97LQ9Y5Z4protein_codingdeleterious(0.04)benign(0.062)TCGA-A8-A08H-01Breastbreast invasive carcinomaFemale>=65I/IIUnknownUnknownSD
HEBP2SNVMissense_Mutationnovelc.140N>Gp.Lys47Argp.K47RQ9Y5Z4protein_codingtolerated(0.12)benign(0.009)TCGA-AA-3984-01Colorectumcolon adenocarcinomaFemale<65I/IIUnknownUnknownSD
HEBP2SNVMissense_Mutationnovelc.245N>Cp.Lys82Thrp.K82TQ9Y5Z4protein_codingdeleterious(0.04)possibly_damaging(0.621)TCGA-AZ-4315-01Colorectumcolon adenocarcinomaMale<65I/IIUnknownUnknownSD
HEBP2SNVMissense_Mutationrs768098976c.508N>Ap.Asp170Asnp.D170NQ9Y5Z4protein_codingtolerated(0.52)benign(0.003)TCGA-A5-A0G2-01Endometriumuterine corpus endometrioid carcinomaFemale<65III/IVUnknownUnknownSD
HEBP2SNVMissense_Mutationrs750449654c.613N>Ap.Glu205Lysp.E205KQ9Y5Z4protein_codingtolerated_low_confidence(0.12)benign(0)TCGA-A5-A0G2-01Endometriumuterine corpus endometrioid carcinomaFemale<65III/IVUnknownUnknownSD
HEBP2SNVMissense_Mutationnovelc.450N>Tp.Lys150Asnp.K150NQ9Y5Z4protein_codingtolerated(0.07)probably_damaging(0.99)TCGA-A5-A2K5-01Endometriumuterine corpus endometrioid carcinomaFemale>=65I/IIUnknownUnknownSD
HEBP2SNVMissense_Mutationrs535510705c.277G>Ap.Val93Metp.V93MQ9Y5Z4protein_codingdeleterious(0)probably_damaging(0.994)TCGA-AJ-A3EK-01Endometriumuterine corpus endometrioid carcinomaFemale<65I/IIChemotherapycarboplatinCR
HEBP2SNVMissense_Mutationnovelc.229N>Cp.Asn77Hisp.N77HQ9Y5Z4protein_codingdeleterious(0)probably_damaging(1)TCGA-AX-A06F-01Endometriumuterine corpus endometrioid carcinomaFemale<65III/IVChemotherapycarboplatinSD
HEBP2SNVMissense_Mutationrs768098976c.508N>Ap.Asp170Asnp.D170NQ9Y5Z4protein_codingtolerated(0.52)benign(0.003)TCGA-B5-A0JY-01Endometriumuterine corpus endometrioid carcinomaFemale<65III/IVChemotherapydoxorubicinSD
HEBP2SNVMissense_Mutationnovelc.450N>Tp.Lys150Asnp.K150NQ9Y5Z4protein_codingtolerated(0.07)probably_damaging(0.99)TCGA-BK-A6W3-01Endometriumuterine corpus endometrioid carcinomaFemale<65I/IIUnknownUnknownSD
Page: 1 2 3 

Top

Related drugs of malignant transformation related genes

check buttonIdentification of chemicals and drugs interact with genes involved in malignant transfromation
(DGIdb 4.0)
Entrez IDSymbolCategoryInteraction TypesDrug Claim NameDrug NamePMIDs
Page: 1