
|
|||||
|
 | |
| |
| |
| |
| |
| |
|
Gene: HEATR5A |
Gene summary for HEATR5A |
| Gene information | Species | Human | Gene symbol | HEATR5A | Gene ID | 25938 |
| Gene name | HEAT repeat containing 5A | |
| Gene Alias | C14orf125 | |
| Cytomap | 14q12 | |
| Gene Type | protein-coding | GO ID | GO:0006810 | UniProtAcc | F5H619 |
Top |
Malignant transformation analysis |
| Identification of the aberrant gene expression in precancerous and cancerous lesions by comparing the gene expression of stem-like cells in diseased tissues with normal stem cells |
| Entrez ID | Symbol | Replicates | Species | Organ | Tissue | Adj P-value | Log2FC | Malignancy |
| 25938 | HEATR5A | LZE5T | Human | Esophagus | ESCC | 8.94e-04 | 4.60e-01 | 0.0514 |
| 25938 | HEATR5A | LZE7T | Human | Esophagus | ESCC | 2.63e-02 | 2.01e-01 | 0.0667 |
| 25938 | HEATR5A | LZE20T | Human | Esophagus | ESCC | 2.07e-02 | 1.56e-01 | 0.0662 |
| 25938 | HEATR5A | LZE24T | Human | Esophagus | ESCC | 7.70e-05 | 1.48e-01 | 0.0596 |
| 25938 | HEATR5A | LZE21T | Human | Esophagus | ESCC | 5.27e-04 | 2.47e-01 | 0.0655 |
| 25938 | HEATR5A | P2T-E | Human | Esophagus | ESCC | 1.04e-04 | 5.44e-02 | 0.1177 |
| 25938 | HEATR5A | P5T-E | Human | Esophagus | ESCC | 8.75e-11 | 2.13e-01 | 0.1327 |
| 25938 | HEATR5A | P8T-E | Human | Esophagus | ESCC | 1.62e-20 | 4.20e-01 | 0.0889 |
| 25938 | HEATR5A | P9T-E | Human | Esophagus | ESCC | 3.88e-08 | 1.98e-01 | 0.1131 |
| 25938 | HEATR5A | P10T-E | Human | Esophagus | ESCC | 2.39e-08 | 1.33e-01 | 0.116 |
| 25938 | HEATR5A | P11T-E | Human | Esophagus | ESCC | 3.01e-07 | 3.19e-01 | 0.1426 |
| 25938 | HEATR5A | P12T-E | Human | Esophagus | ESCC | 4.40e-21 | 1.85e-01 | 0.1122 |
| 25938 | HEATR5A | P15T-E | Human | Esophagus | ESCC | 1.11e-15 | 3.26e-01 | 0.1149 |
| 25938 | HEATR5A | P16T-E | Human | Esophagus | ESCC | 4.08e-06 | 4.45e-02 | 0.1153 |
| 25938 | HEATR5A | P19T-E | Human | Esophagus | ESCC | 1.54e-05 | 3.45e-01 | 0.1662 |
| 25938 | HEATR5A | P21T-E | Human | Esophagus | ESCC | 5.03e-10 | 1.36e-01 | 0.1617 |
| 25938 | HEATR5A | P22T-E | Human | Esophagus | ESCC | 5.70e-15 | 1.06e-01 | 0.1236 |
| 25938 | HEATR5A | P23T-E | Human | Esophagus | ESCC | 6.82e-13 | 3.45e-01 | 0.108 |
| 25938 | HEATR5A | P24T-E | Human | Esophagus | ESCC | 4.17e-14 | 1.55e-01 | 0.1287 |
| 25938 | HEATR5A | P26T-E | Human | Esophagus | ESCC | 1.09e-10 | 1.69e-01 | 0.1276 |
| Page: 1 2 3 4 |
| Tissue | Expression Dynamics | Abbreviation |
| Esophagus | 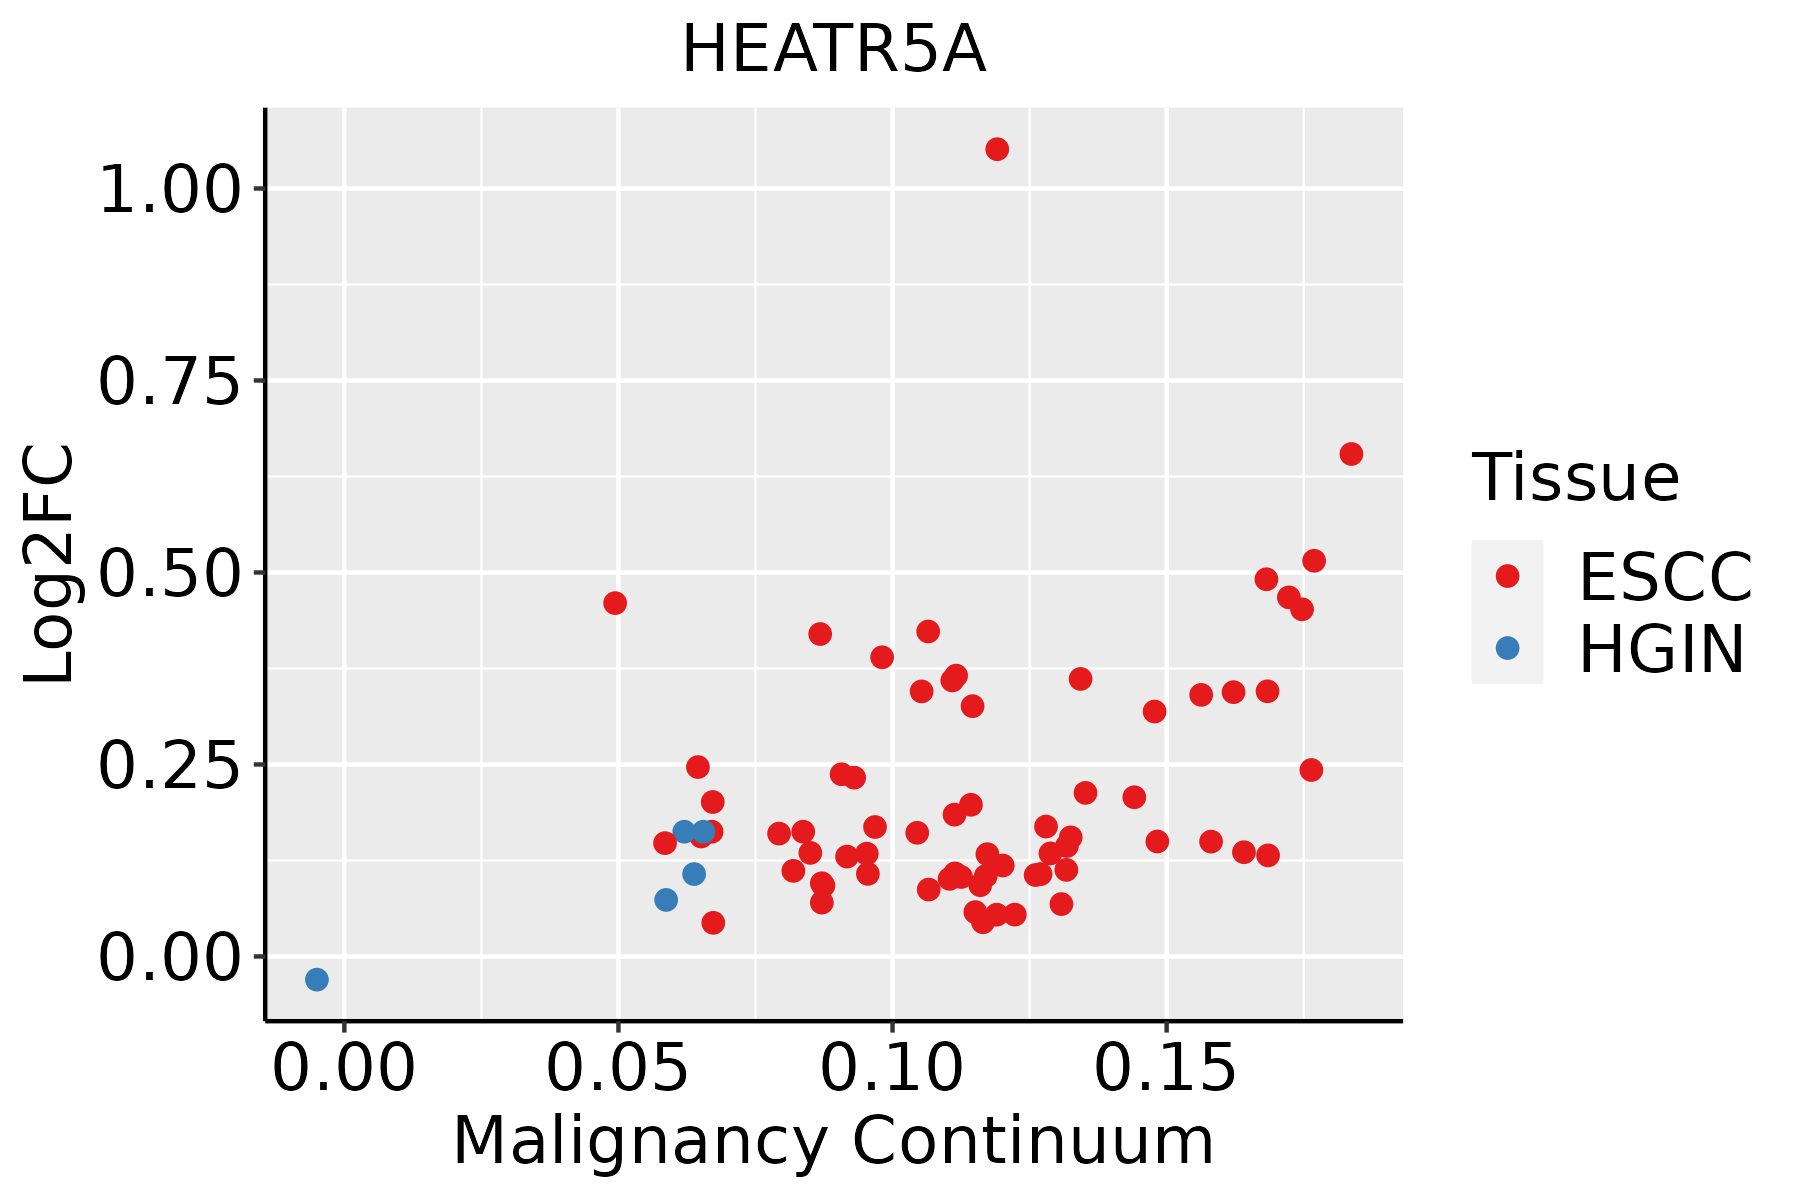 | ESCC: Esophageal squamous cell carcinoma |
| HGIN: High-grade intraepithelial neoplasias | ||
| LGIN: Low-grade intraepithelial neoplasias | ||
| Liver | 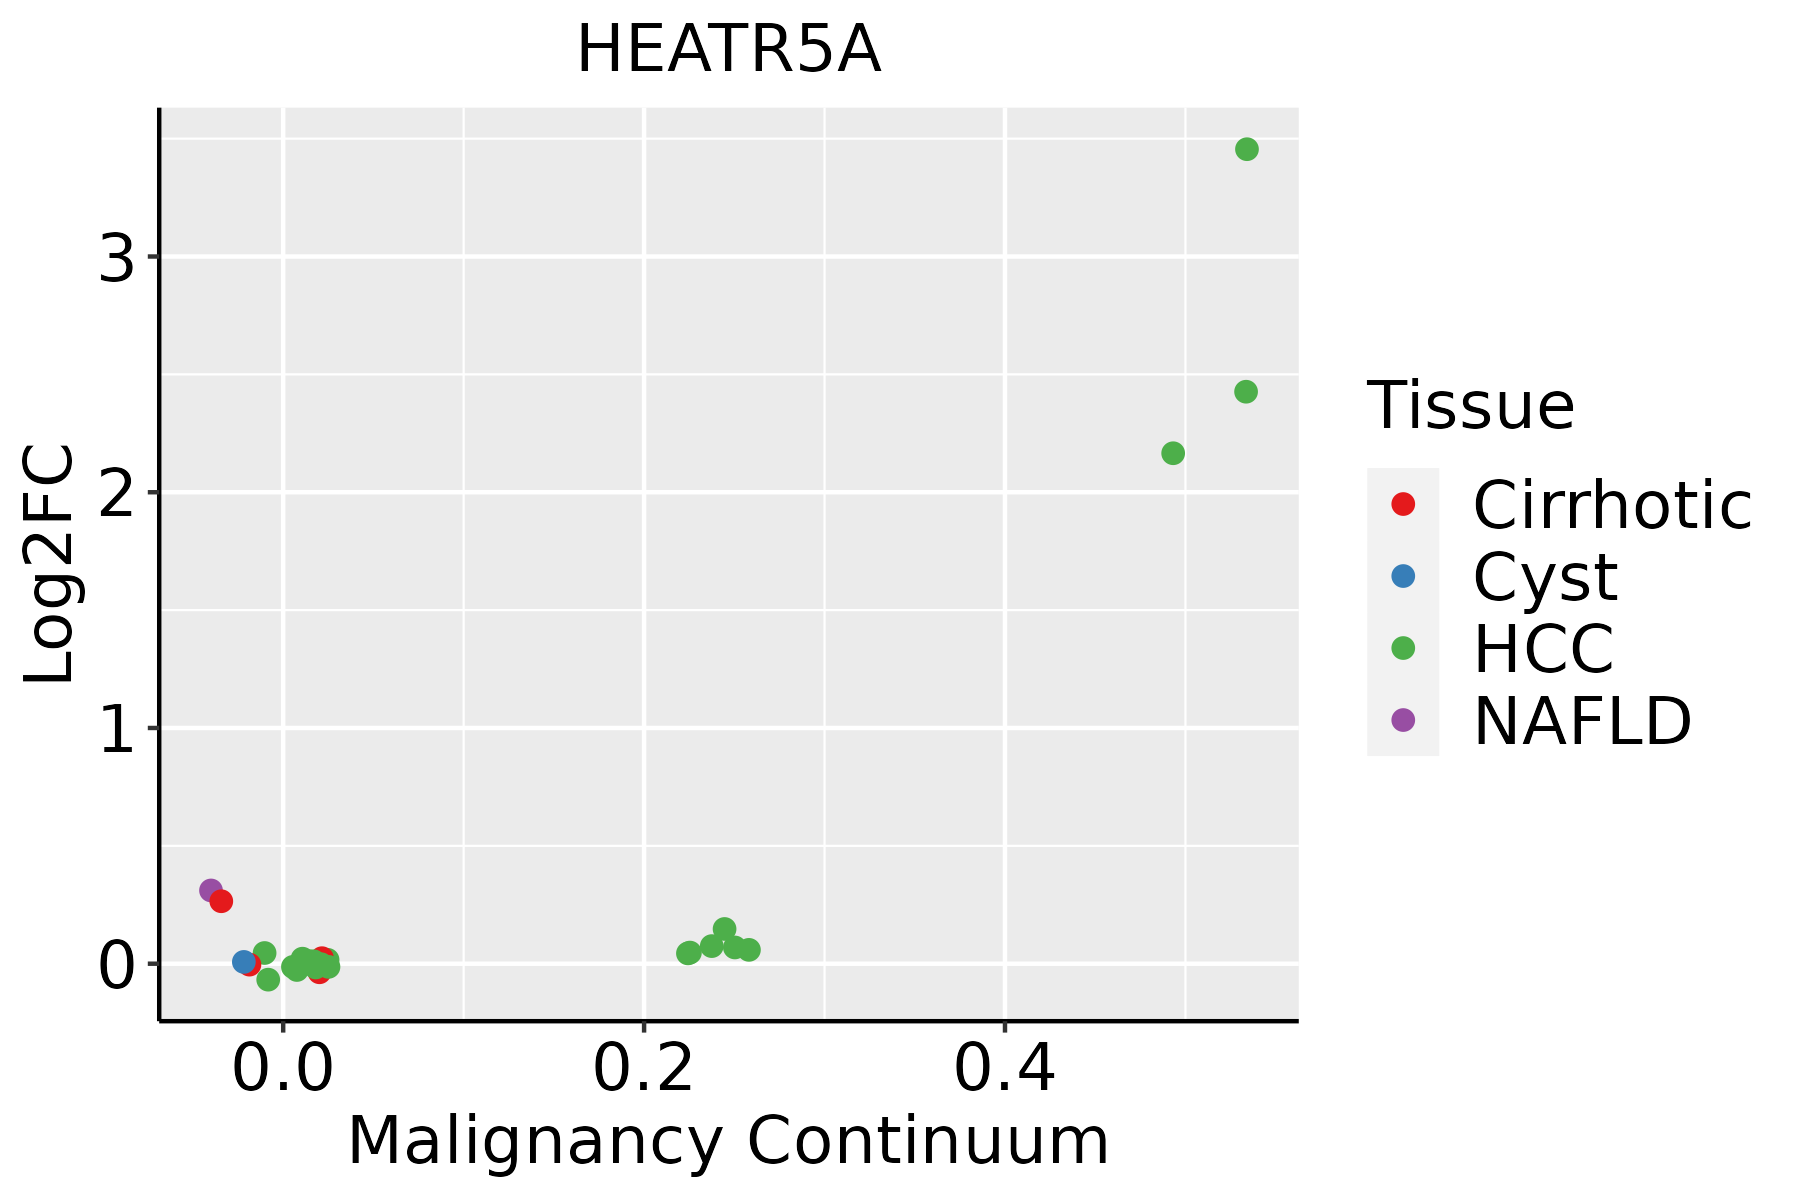 | HCC: Hepatocellular carcinoma |
| NAFLD: Non-alcoholic fatty liver disease | ||
| Lung | 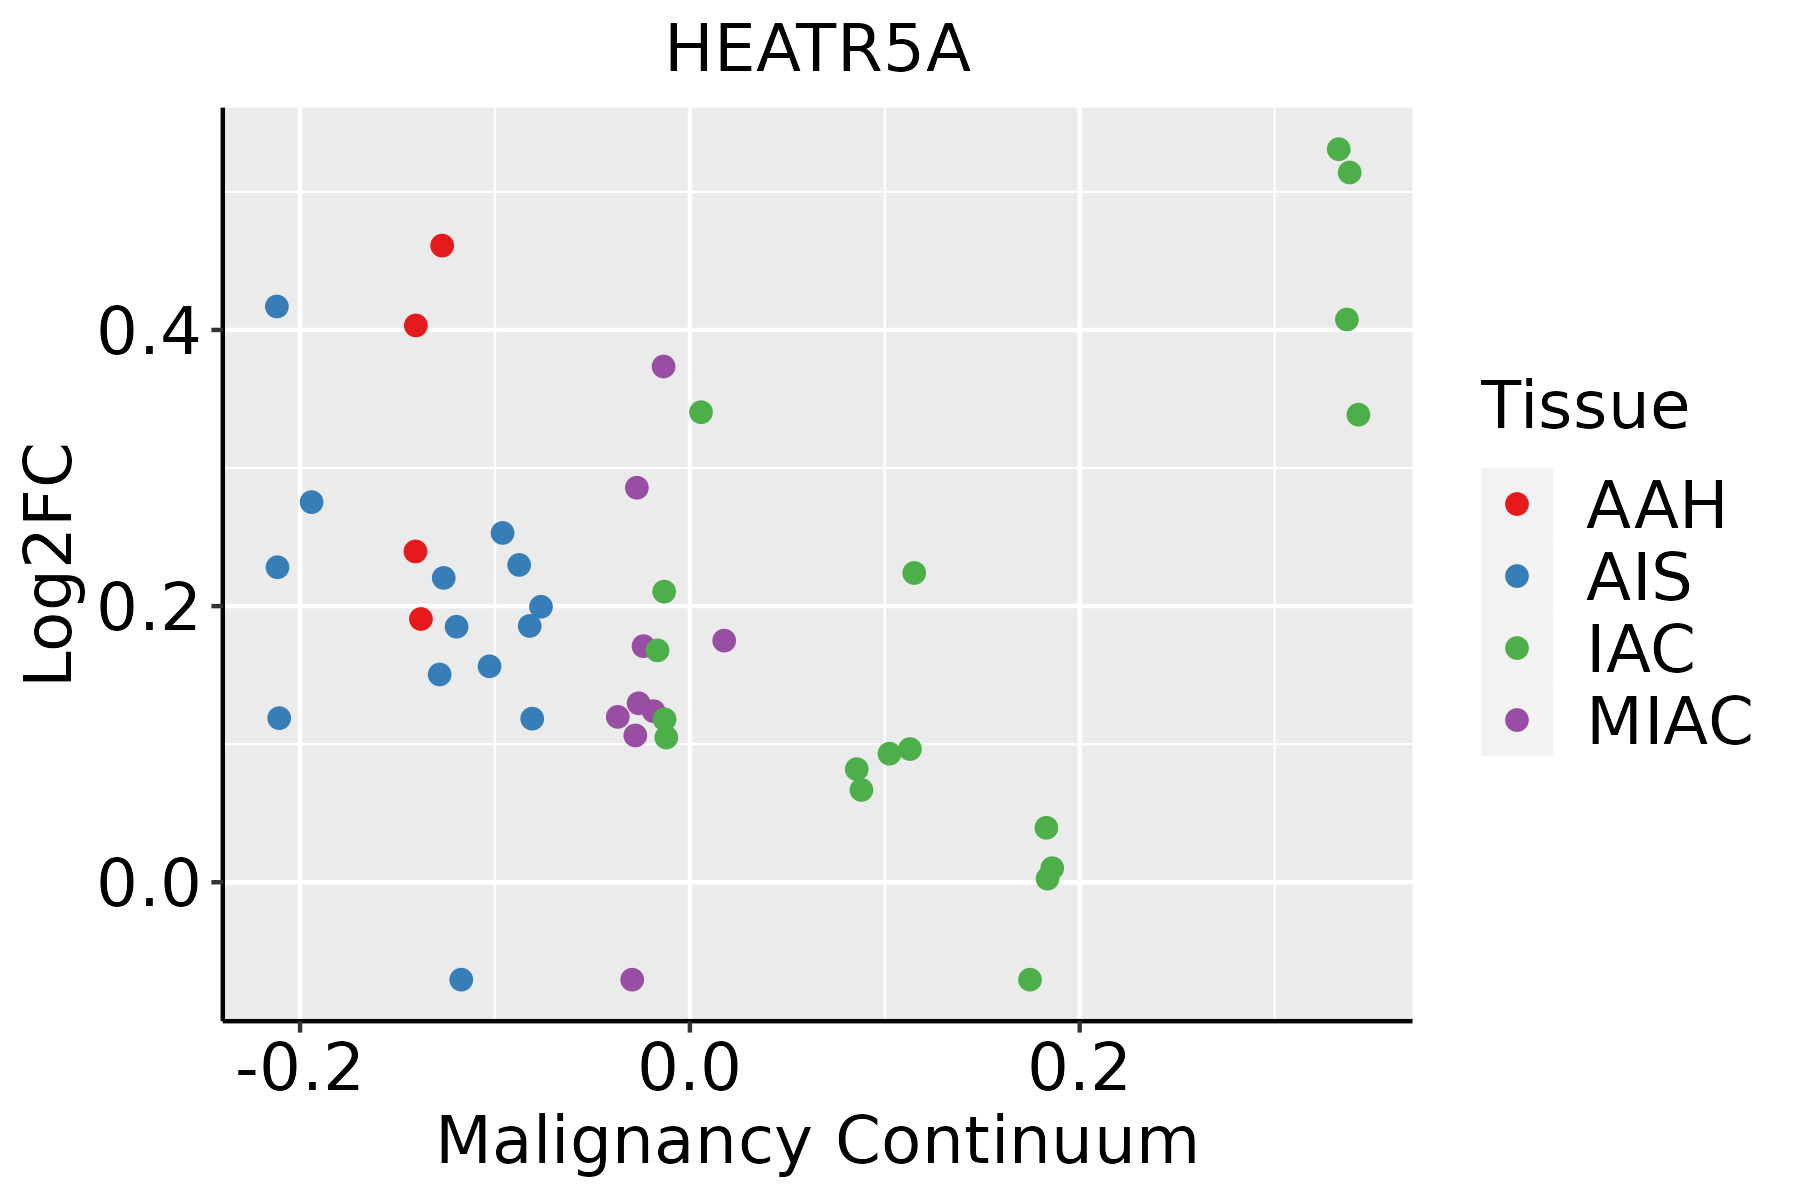 | AAH: Atypical adenomatous hyperplasia |
| AIS: Adenocarcinoma in situ | ||
| IAC: Invasive lung adenocarcinoma | ||
| MIA: Minimally invasive adenocarcinoma |
| ∗log2FC in expression of this searched gene in stem-like cells from each diseased tissue sample relative to stem-like cells in normal samples in each tissue plotted against the malignancy continuum. Samples are colored based on if they are from different disease stage. |
Top |
Malignant transformation related pathway analysis |
| Find out the enriched GO biological processes and KEGG pathways involved in transition from healthy to precancer to cancer |
| Tissue | Disease Stage | Enriched GO biological Processes |
| Colorectum | AD |  |
| Colorectum | SER |  |
| Colorectum | MSS |  |
| Colorectum | MSI-H |  |
| Colorectum | FAP |  |
| ∗Top 15 enriched GO BP terms are showed in the bar plot of each disease state in each tissue. Each row represents a significant GO biological process which is colored according to the -log10(p.adjust). |
| Page: 1 2 3 4 5 6 7 8 9 |
| GO ID | Tissue | Disease Stage | Description | Gene Ratio | Bg Ratio | pvalue | p.adjust | Count |
| GO:001619715 | Esophagus | ESCC | endosomal transport | 168/8552 | 230/18723 | 2.28e-17 | 1.93e-15 | 168 |
| GO:001648210 | Esophagus | ESCC | cytosolic transport | 124/8552 | 168/18723 | 9.69e-14 | 4.69e-12 | 124 |
| GO:00421477 | Esophagus | ESCC | retrograde transport, endosome to Golgi | 63/8552 | 91/18723 | 4.58e-06 | 4.87e-05 | 63 |
| GO:00164825 | Liver | NAFLD | cytosolic transport | 34/1882 | 168/18723 | 5.52e-05 | 1.25e-03 | 34 |
| GO:00161975 | Liver | NAFLD | endosomal transport | 41/1882 | 230/18723 | 2.02e-04 | 3.53e-03 | 41 |
| GO:00421474 | Liver | NAFLD | retrograde transport, endosome to Golgi | 19/1882 | 91/18723 | 1.55e-03 | 1.67e-02 | 19 |
| GO:001619721 | Liver | HCC | endosomal transport | 154/7958 | 230/18723 | 4.74e-14 | 2.95e-12 | 154 |
| GO:001648221 | Liver | HCC | cytosolic transport | 117/7958 | 168/18723 | 8.83e-13 | 4.48e-11 | 117 |
| GO:004214721 | Liver | HCC | retrograde transport, endosome to Golgi | 61/7958 | 91/18723 | 1.94e-06 | 2.68e-05 | 61 |
| GO:00164826 | Lung | IAC | cytosolic transport | 37/2061 | 168/18723 | 2.74e-05 | 7.26e-04 | 37 |
| GO:00161976 | Lung | IAC | endosomal transport | 43/2061 | 230/18723 | 3.53e-04 | 5.50e-03 | 43 |
| GO:001648212 | Lung | AIS | cytosolic transport | 35/1849 | 168/18723 | 1.57e-05 | 5.63e-04 | 35 |
| GO:001619712 | Lung | AIS | endosomal transport | 38/1849 | 230/18723 | 1.08e-03 | 1.41e-02 | 38 |
| Page: 1 |
| Pathway ID | Tissue | Disease Stage | Description | Gene Ratio | Bg Ratio | pvalue | p.adjust | qvalue | Count |
| Page: 1 |
Top |
Cell-cell communication analysis |
| Identification of potential cell-cell interactions between two cell types and their ligand-receptor pairs for different disease states |
| Ligand | Receptor | LRpair | Pathway | Tissue | Disease Stage |
| Page: 1 |
Top |
Single-cell gene regulatory network inference analysis |
| Find out the significant the regulons (TFs) and the target genes of each regulon across cell types for different disease states |
| TF | Cell Type | Tissue | Disease Stage | Target Gene | RSS | Regulon Activity |
| ∗The dot plots of a searched regulon are shown for all cell subpopulations in each disease state of each tissue based on the regulon specific score inferred using pySCENIC and by calculating the average expression. |
| Page: 1 |
Top |
Somatic mutation of malignant transformation related genes |
| Annotation of somatic variants for genes involved in malignant transformation |
| Hugo Symbol | Variant Class | Variant Classification | dbSNP RS | HGVSc | HGVSp | HGVSp Short | SWISSPROT | BIOTYPE | SIFT | PolyPhen | Tumor Sample Barcode | Tissue | Histology | Sex | Age | Stage | Therapy Types | Drugs | Outcome |
| HEATR5A | SNV | Missense_Mutation | novel | c.2704G>C | p.Asp902His | p.D902H | protein_coding | deleterious(0) | probably_damaging(0.987) | TCGA-5L-AAT0-01 | Breast | breast invasive carcinoma | Female | <65 | I/II | Hormone Therapy | tamoxiphen | SD | |
| HEATR5A | SNV | Missense_Mutation | rs755830117 | c.5833N>T | p.Arg1945Cys | p.R1945C | protein_coding | tolerated(0.06) | benign(0.316) | TCGA-A2-A0YJ-01 | Breast | breast invasive carcinoma | Female | <65 | III/IV | Chemotherapy | cytoxan | PD | |
| HEATR5A | SNV | Missense_Mutation | rs763891115 | c.3278N>T | p.Cys1093Phe | p.C1093F | protein_coding | deleterious(0) | probably_damaging(1) | TCGA-A2-A1FW-01 | Breast | breast invasive carcinoma | Female | <65 | III/IV | Chemotherapy | cytoxan | SD | |
| HEATR5A | SNV | Missense_Mutation | c.4003N>C | p.Glu1335Gln | p.E1335Q | protein_coding | deleterious(0) | possibly_damaging(0.826) | TCGA-A7-A0DA-01 | Breast | breast invasive carcinoma | Female | <65 | I/II | Chemotherapy | adriamycin | SD | ||
| HEATR5A | SNV | Missense_Mutation | rs372569181 | c.1195N>A | p.Val399Ile | p.V399I | protein_coding | tolerated(0.43) | benign(0.013) | TCGA-A8-A08S-01 | Breast | breast invasive carcinoma | Female | >=65 | I/II | Hormone Therapy | anastrozole | SD | |
| HEATR5A | SNV | Missense_Mutation | rs762790566 | c.4636G>C | p.Ala1546Pro | p.A1546P | protein_coding | tolerated(0.24) | benign(0) | TCGA-A8-A095-01 | Breast | breast invasive carcinoma | Female | <65 | I/II | Chemotherapy | 5-fluorouracil | CR | |
| HEATR5A | SNV | Missense_Mutation | c.2813N>A | p.Ser938Tyr | p.S938Y | protein_coding | deleterious(0) | possibly_damaging(0.575) | TCGA-AN-A046-01 | Breast | breast invasive carcinoma | Female | >=65 | I/II | Unknown | Unknown | SD | ||
| HEATR5A | SNV | Missense_Mutation | rs763891115 | c.3278N>T | p.Cys1093Phe | p.C1093F | protein_coding | deleterious(0) | probably_damaging(1) | TCGA-AN-A0G0-01 | Breast | breast invasive carcinoma | Female | <65 | I/II | Unknown | Unknown | SD | |
| HEATR5A | SNV | Missense_Mutation | novel | c.4298N>A | p.Arg1433Lys | p.R1433K | protein_coding | tolerated(0.94) | benign(0.001) | TCGA-AO-A0J9-01 | Breast | breast invasive carcinoma | Female | <65 | III/IV | Chemotherapy | cyclophosphamide | PD | |
| HEATR5A | SNV | Missense_Mutation | novel | c.3839N>A | p.Ala1280Asp | p.A1280D | protein_coding | deleterious(0) | probably_damaging(0.991) | TCGA-B6-A0RS-01 | Breast | breast invasive carcinoma | Female | <65 | I/II | Unknown | Unknown | PD |
| Page: 1 2 3 4 5 6 7 8 9 10 11 12 13 14 15 16 |
Top |
Related drugs of malignant transformation related genes |
| Identification of chemicals and drugs interact with genes involved in malignant transfromation |
| (DGIdb 4.0) |
| Entrez ID | Symbol | Category | Interaction Types | Drug Claim Name | Drug Name | PMIDs |
| Page: 1 |

Copyright 2023-Present -The University of Texas Health Science Center at Houston |