
|
|||||
|
 | |
| |
| |
| |
| |
| |
|
Gene: HEATR3 |
Gene summary for HEATR3 |
| Gene information | Species | Human | Gene symbol | HEATR3 | Gene ID | 55027 |
| Gene name | HEAT repeat containing 3 | |
| Gene Alias | SYO1 | |
| Cytomap | 16q12.1 | |
| Gene Type | protein-coding | GO ID | GO:0006606 | UniProtAcc | Q7Z4Q2 |
Top |
Malignant transformation analysis |
| Identification of the aberrant gene expression in precancerous and cancerous lesions by comparing the gene expression of stem-like cells in diseased tissues with normal stem cells |
| Entrez ID | Symbol | Replicates | Species | Organ | Tissue | Adj P-value | Log2FC | Malignancy |
| 55027 | HEATR3 | HCC1_Meng | Human | Liver | HCC | 8.34e-16 | 2.59e-02 | 0.0246 |
| 55027 | HEATR3 | HCC2_Meng | Human | Liver | HCC | 3.90e-03 | 3.27e-02 | 0.0107 |
| 55027 | HEATR3 | HCC1 | Human | Liver | HCC | 2.13e-15 | 1.36e+00 | 0.5336 |
| 55027 | HEATR3 | HCC2 | Human | Liver | HCC | 2.20e-37 | 3.10e+00 | 0.5341 |
| 55027 | HEATR3 | HCC5 | Human | Liver | HCC | 1.20e-31 | 2.04e+00 | 0.4932 |
| 55027 | HEATR3 | S014 | Human | Liver | HCC | 3.68e-03 | 1.51e-01 | 0.2254 |
| 55027 | HEATR3 | S015 | Human | Liver | HCC | 1.59e-04 | 2.29e-01 | 0.2375 |
| 55027 | HEATR3 | S016 | Human | Liver | HCC | 2.41e-02 | 1.23e-01 | 0.2243 |
| 55027 | HEATR3 | S028 | Human | Liver | HCC | 7.96e-10 | 3.58e-01 | 0.2503 |
| 55027 | HEATR3 | S029 | Human | Liver | HCC | 1.51e-08 | 2.90e-01 | 0.2581 |
| Page: 1 |
| Tissue | Expression Dynamics | Abbreviation |
| Liver | 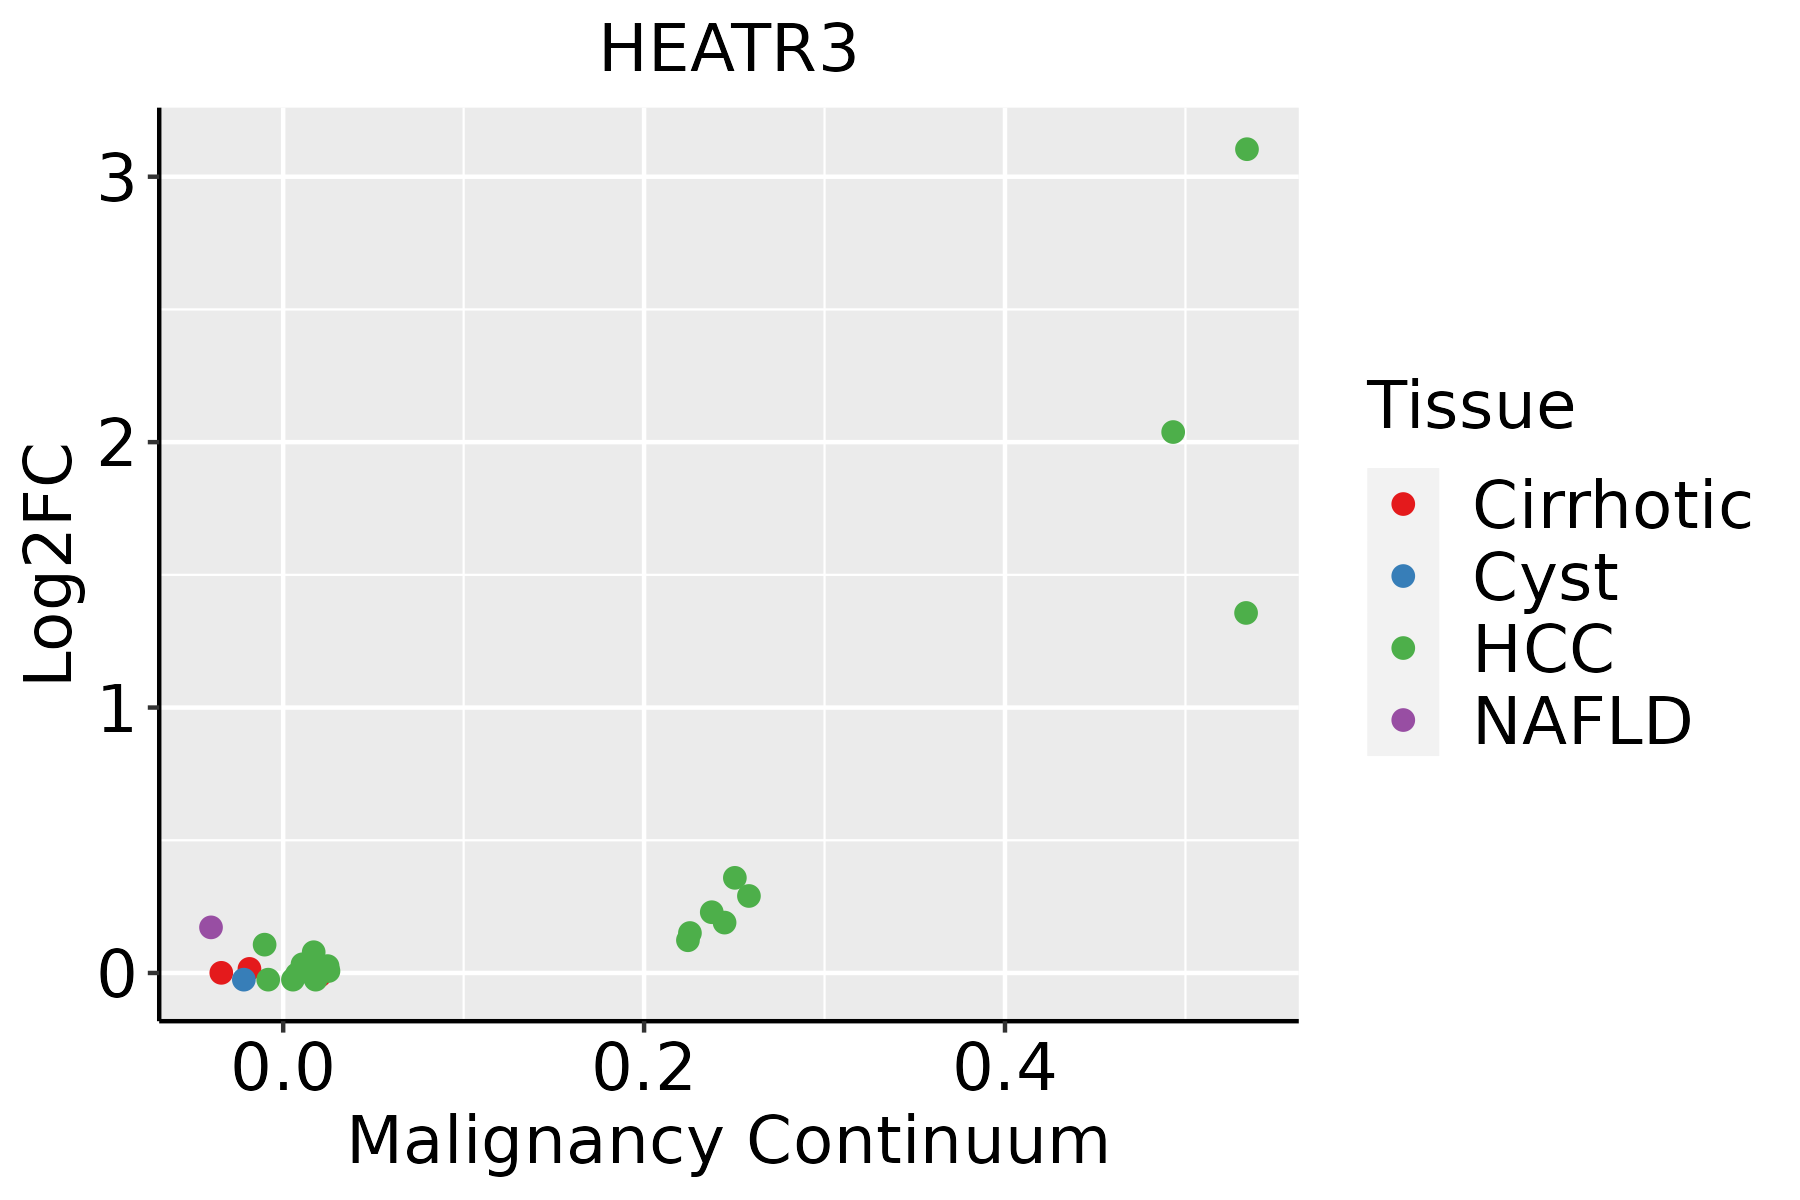 | HCC: Hepatocellular carcinoma |
| NAFLD: Non-alcoholic fatty liver disease |
| ∗log2FC in expression of this searched gene in stem-like cells from each diseased tissue sample relative to stem-like cells in normal samples in each tissue plotted against the malignancy continuum. Samples are colored based on if they are from different disease stage. |
Top |
Malignant transformation related pathway analysis |
| Find out the enriched GO biological processes and KEGG pathways involved in transition from healthy to precancer to cancer |
| Tissue | Disease Stage | Enriched GO biological Processes |
| Colorectum | AD |  |
| Colorectum | SER |  |
| Colorectum | MSS |  |
| Colorectum | MSI-H |  |
| Colorectum | FAP |  |
| ∗Top 15 enriched GO BP terms are showed in the bar plot of each disease state in each tissue. Each row represents a significant GO biological process which is colored according to the -log10(p.adjust). |
| Page: 1 2 3 4 5 6 7 8 9 |
| GO ID | Tissue | Disease Stage | Description | Gene Ratio | Bg Ratio | pvalue | p.adjust | Count |
| GO:002261322 | Liver | HCC | ribonucleoprotein complex biogenesis | 355/7958 | 463/18723 | 7.76e-52 | 4.92e-48 | 355 |
| GO:004225422 | Liver | HCC | ribosome biogenesis | 246/7958 | 299/18723 | 4.99e-46 | 1.58e-42 | 246 |
| GO:007259422 | Liver | HCC | establishment of protein localization to organelle | 299/7958 | 422/18723 | 1.06e-32 | 6.10e-30 | 299 |
| GO:000691322 | Liver | HCC | nucleocytoplasmic transport | 208/7958 | 301/18723 | 5.51e-21 | 8.12e-19 | 208 |
| GO:005116922 | Liver | HCC | nuclear transport | 208/7958 | 301/18723 | 5.51e-21 | 8.12e-19 | 208 |
| GO:003450421 | Liver | HCC | protein localization to nucleus | 194/7958 | 290/18723 | 2.84e-17 | 2.85e-15 | 194 |
| GO:004227322 | Liver | HCC | ribosomal large subunit biogenesis | 64/7958 | 72/18723 | 2.31e-16 | 2.03e-14 | 64 |
| GO:001703811 | Liver | HCC | protein import | 140/7958 | 206/18723 | 1.12e-13 | 6.46e-12 | 140 |
| GO:005117011 | Liver | HCC | import into nucleus | 102/7958 | 159/18723 | 2.78e-08 | 6.39e-07 | 102 |
| GO:00066066 | Liver | HCC | protein import into nucleus | 99/7958 | 155/18723 | 6.12e-08 | 1.28e-06 | 99 |
| Page: 1 |
| Pathway ID | Tissue | Disease Stage | Description | Gene Ratio | Bg Ratio | pvalue | p.adjust | qvalue | Count |
| Page: 1 |
Top |
Cell-cell communication analysis |
| Identification of potential cell-cell interactions between two cell types and their ligand-receptor pairs for different disease states |
| Ligand | Receptor | LRpair | Pathway | Tissue | Disease Stage |
| Page: 1 |
Top |
Single-cell gene regulatory network inference analysis |
| Find out the significant the regulons (TFs) and the target genes of each regulon across cell types for different disease states |
| TF | Cell Type | Tissue | Disease Stage | Target Gene | RSS | Regulon Activity |
| ∗The dot plots of a searched regulon are shown for all cell subpopulations in each disease state of each tissue based on the regulon specific score inferred using pySCENIC and by calculating the average expression. |
| Page: 1 |
Top |
Somatic mutation of malignant transformation related genes |
| Annotation of somatic variants for genes involved in malignant transformation |
| Hugo Symbol | Variant Class | Variant Classification | dbSNP RS | HGVSc | HGVSp | HGVSp Short | SWISSPROT | BIOTYPE | SIFT | PolyPhen | Tumor Sample Barcode | Tissue | Histology | Sex | Age | Stage | Therapy Types | Drugs | Outcome |
| HEATR3 | SNV | Missense_Mutation | novel | c.1997G>A | p.Arg666Lys | p.R666K | Q7Z4Q2 | protein_coding | tolerated(0.11) | probably_damaging(0.978) | TCGA-AN-A04D-01 | Breast | breast invasive carcinoma | Female | <65 | I/II | Unknown | Unknown | SD |
| HEATR3 | SNV | Missense_Mutation | novel | c.1885N>C | p.Ala629Pro | p.A629P | Q7Z4Q2 | protein_coding | deleterious(0.03) | benign(0.203) | TCGA-AR-A0TY-01 | Breast | breast invasive carcinoma | Female | <65 | I/II | Unspecific | Paclitaxel | PD |
| HEATR3 | SNV | Missense_Mutation | novel | c.815T>G | p.Ile272Ser | p.I272S | Q7Z4Q2 | protein_coding | tolerated(0.25) | benign(0.001) | TCGA-2W-A8YY-01 | Cervix | cervical & endocervical cancer | Female | <65 | I/II | Chemotherapy | cisplatin | CR |
| HEATR3 | SNV | Missense_Mutation | c.50C>T | p.Thr17Met | p.T17M | Q7Z4Q2 | protein_coding | deleterious(0) | benign(0.164) | TCGA-DR-A0ZM-01 | Cervix | cervical & endocervical cancer | Female | <65 | III/IV | Unspecific | Cisplatin | SD | |
| HEATR3 | insertion | Nonsense_Mutation | novel | c.984_985insTAAT | p.Gly329Ter | p.G329* | Q7Z4Q2 | protein_coding | TCGA-DS-A1OB-01 | Cervix | cervical & endocervical cancer | Female | <65 | I/II | Chemotherapy | carboplatin | PD | ||
| HEATR3 | insertion | Nonsense_Mutation | novel | c.985_986insTCCTTTA | p.Gly329ValfsTer3 | p.G329Vfs*3 | Q7Z4Q2 | protein_coding | TCGA-DS-A1OB-01 | Cervix | cervical & endocervical cancer | Female | <65 | I/II | Chemotherapy | carboplatin | PD | ||
| HEATR3 | SNV | Missense_Mutation | c.526N>G | p.Arg176Gly | p.R176G | Q7Z4Q2 | protein_coding | tolerated(0.05) | benign(0.024) | TCGA-A6-2686-01 | Colorectum | colon adenocarcinoma | Female | >=65 | I/II | Unknown | Unknown | SD | |
| HEATR3 | SNV | Missense_Mutation | c.1174N>A | p.Glu392Lys | p.E392K | Q7Z4Q2 | protein_coding | deleterious(0.01) | probably_damaging(0.994) | TCGA-AA-3975-01 | Colorectum | colon adenocarcinoma | Male | >=65 | I/II | Unknown | Unknown | SD | |
| HEATR3 | SNV | Missense_Mutation | c.1539N>C | p.Glu513Asp | p.E513D | Q7Z4Q2 | protein_coding | deleterious(0.02) | probably_damaging(0.991) | TCGA-AA-A00N-01 | Colorectum | colon adenocarcinoma | Male | >=65 | I/II | Unknown | Unknown | PD | |
| HEATR3 | SNV | Missense_Mutation | novel | c.316C>T | p.Leu106Phe | p.L106F | Q7Z4Q2 | protein_coding | deleterious(0) | probably_damaging(0.999) | TCGA-CA-6717-01 | Colorectum | colon adenocarcinoma | Male | <65 | I/II | Chemotherapy | oxaliplatin | CR |
| Page: 1 2 3 4 5 6 |
Top |
Related drugs of malignant transformation related genes |
| Identification of chemicals and drugs interact with genes involved in malignant transfromation |
| (DGIdb 4.0) |
| Entrez ID | Symbol | Category | Interaction Types | Drug Claim Name | Drug Name | PMIDs |
| Page: 1 |

Copyright 2023-Present -The University of Texas Health Science Center at Houston |