Schematic overview of the cellular and molecular mechanisms involved in the cancer progression, including the proposed cellular and molecular mechanisms in cancer cells trajectory. AT1: alveolar type 1 cells; AT2: alveolar type 2 cells; AAH: atypical adenomatous hyperplasia; AIS: adenocarcinoma in situ; MIA: minimally invasive adenocarcinoma; IA: invasive adenocarcinoma; EMT: epithelial-mesenchymal transition

Home

Download

Statistics

Help

Contact

Center for Computational Systems Medicine
leaf

Gene summary

leaf

Malignant transformation analysis

leaf

Malignant transformation related pathway analysis

leaf

Cell-cell communication analysis

leaf

Single-cell gene regulatory network inference analysis

leaf

Somatic mutation of malignant transformation related genes

leaf

Related drugs of malignant transformation related genes

Gene: HDLBP

Gene summary for HDLBP

check button Gene summary.

Gene informationSpeciesHuman
Gene symbol

HDLBP

Gene ID

3069

Gene namehigh density lipoprotein binding protein
Gene AliasHBP
Cytomap2q37.3
Gene Typeprotein-coding
GO ID

GO:0006066

UniProtAcc

Q00341


Top

Malignant transformation analysis

check button Identification of the aberrant gene expression in precancerous and cancerous lesions by comparing the gene expression of stem-like cells in diseased tissues with normal stem cells
check button Malignant transformation involving gene list.
Entrez IDSymbolReplicatesSpeciesOrganTissueAdj P-valueLog2FCMalignancy
3069HDLBPGSM4909281HumanBreastIDC2.42e-032.35e-010.21
3069HDLBPGSM4909285HumanBreastIDC3.02e-021.85e-010.21
3069HDLBPGSM4909288HumanBreastIDC3.70e-063.04e-010.0988
3069HDLBPGSM4909291HumanBreastIDC6.92e-237.01e-010.1753
3069HDLBPGSM4909293HumanBreastIDC8.24e-041.36e-010.1581
3069HDLBPGSM4909296HumanBreastIDC6.70e-04-4.14e-020.1524
3069HDLBPGSM4909297HumanBreastIDC2.66e-08-2.97e-010.1517
3069HDLBPGSM4909309HumanBreastIDC1.41e-03-1.85e-010.0483
3069HDLBPGSM4909311HumanBreastIDC6.19e-23-7.79e-020.1534
3069HDLBPGSM4909312HumanBreastIDC3.18e-069.91e-040.1552
3069HDLBPGSM4909318HumanBreastIDC5.33e-053.67e-010.2031
3069HDLBPGSM4909319HumanBreastIDC1.01e-28-1.97e-010.1563
3069HDLBPGSM4909320HumanBreastIDC1.09e-04-1.67e-010.1575
3069HDLBPGSM4909321HumanBreastIDC2.90e-12-3.20e-010.1559
3069HDLBPM2HumanBreastIDC8.26e-136.77e-010.21
3069HDLBPM5HumanBreastIDC4.16e-046.01e-010.1598
3069HDLBPNCCBC14HumanBreastDCIS8.18e-193.58e-010.2021
3069HDLBPNCCBC2HumanBreastDCIS2.66e-037.94e-020.1554
3069HDLBPNCCBC3HumanBreastDCIS1.51e-021.24e-010.1198
3069HDLBPNCCBC5HumanBreastDCIS7.70e-15-1.08e-010.2046
Page: 1 2 3 4 5 6 7 8 9 10 11 12 

check button Transcriptomic changes along malignancy continuum.
TissueExpression DynamicsAbbreviation
BreastThe image shows the transcriptomic changes along malignancy continuum.log2FC in expression of this searched gene in stem-like cells from each diseased tissue sample relative to stem-like cells in normal samples in each tissue plotted against the malignancy continuum. Samples are colored based on if they are from different disease stage.
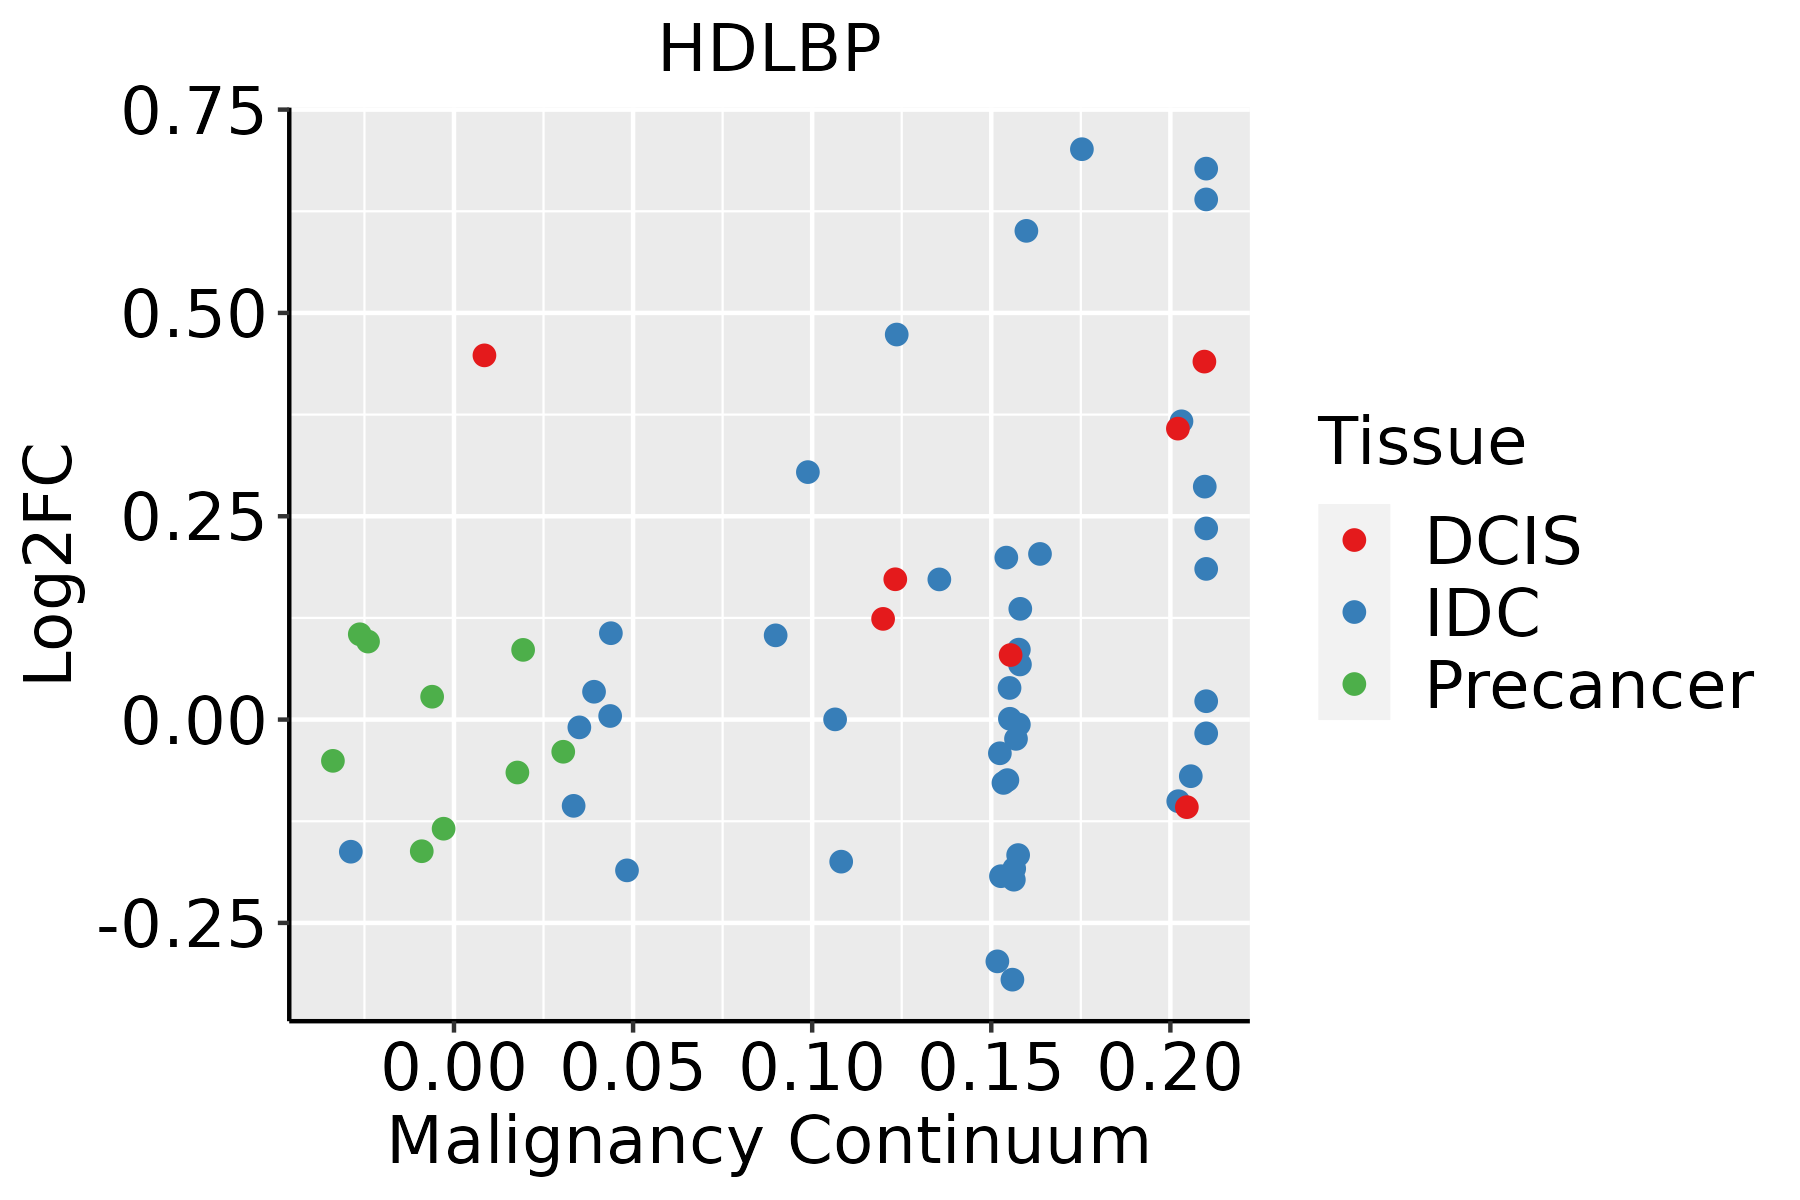
IDC: Invasive ductal carcinoma
DCIS: Ductal carcinoma in situ
Precancer(BRCA1-mut): Precancerous lesion from BRCA1 mutation carriers
Colorectum (GSE201348)The image shows the transcriptomic changes along malignancy continuum.log2FC in expression of this searched gene in stem-like cells from each diseased tissue sample relative to stem-like cells in normal samples in each tissue plotted against the malignancy continuum. Samples are colored based on if they are from different disease stage.FAP: Familial adenomatous polyposis
CRC: Colorectal cancer
Colorectum (HTA11)The image shows the transcriptomic changes along malignancy continuum.log2FC in expression of this searched gene in stem-like cells from each diseased tissue sample relative to stem-like cells in normal samples in each tissue plotted against the malignancy continuum. Samples are colored based on if they are from different disease stage.AD: Adenomas
SER: Sessile serrated lesions
MSI-H: Microsatellite-high colorectal cancer
MSS: Microsatellite stable colorectal cancer
EsophagusThe image shows the transcriptomic changes along malignancy continuum.log2FC in expression of this searched gene in stem-like cells from each diseased tissue sample relative to stem-like cells in normal samples in each tissue plotted against the malignancy continuum. Samples are colored based on if they are from different disease stage.
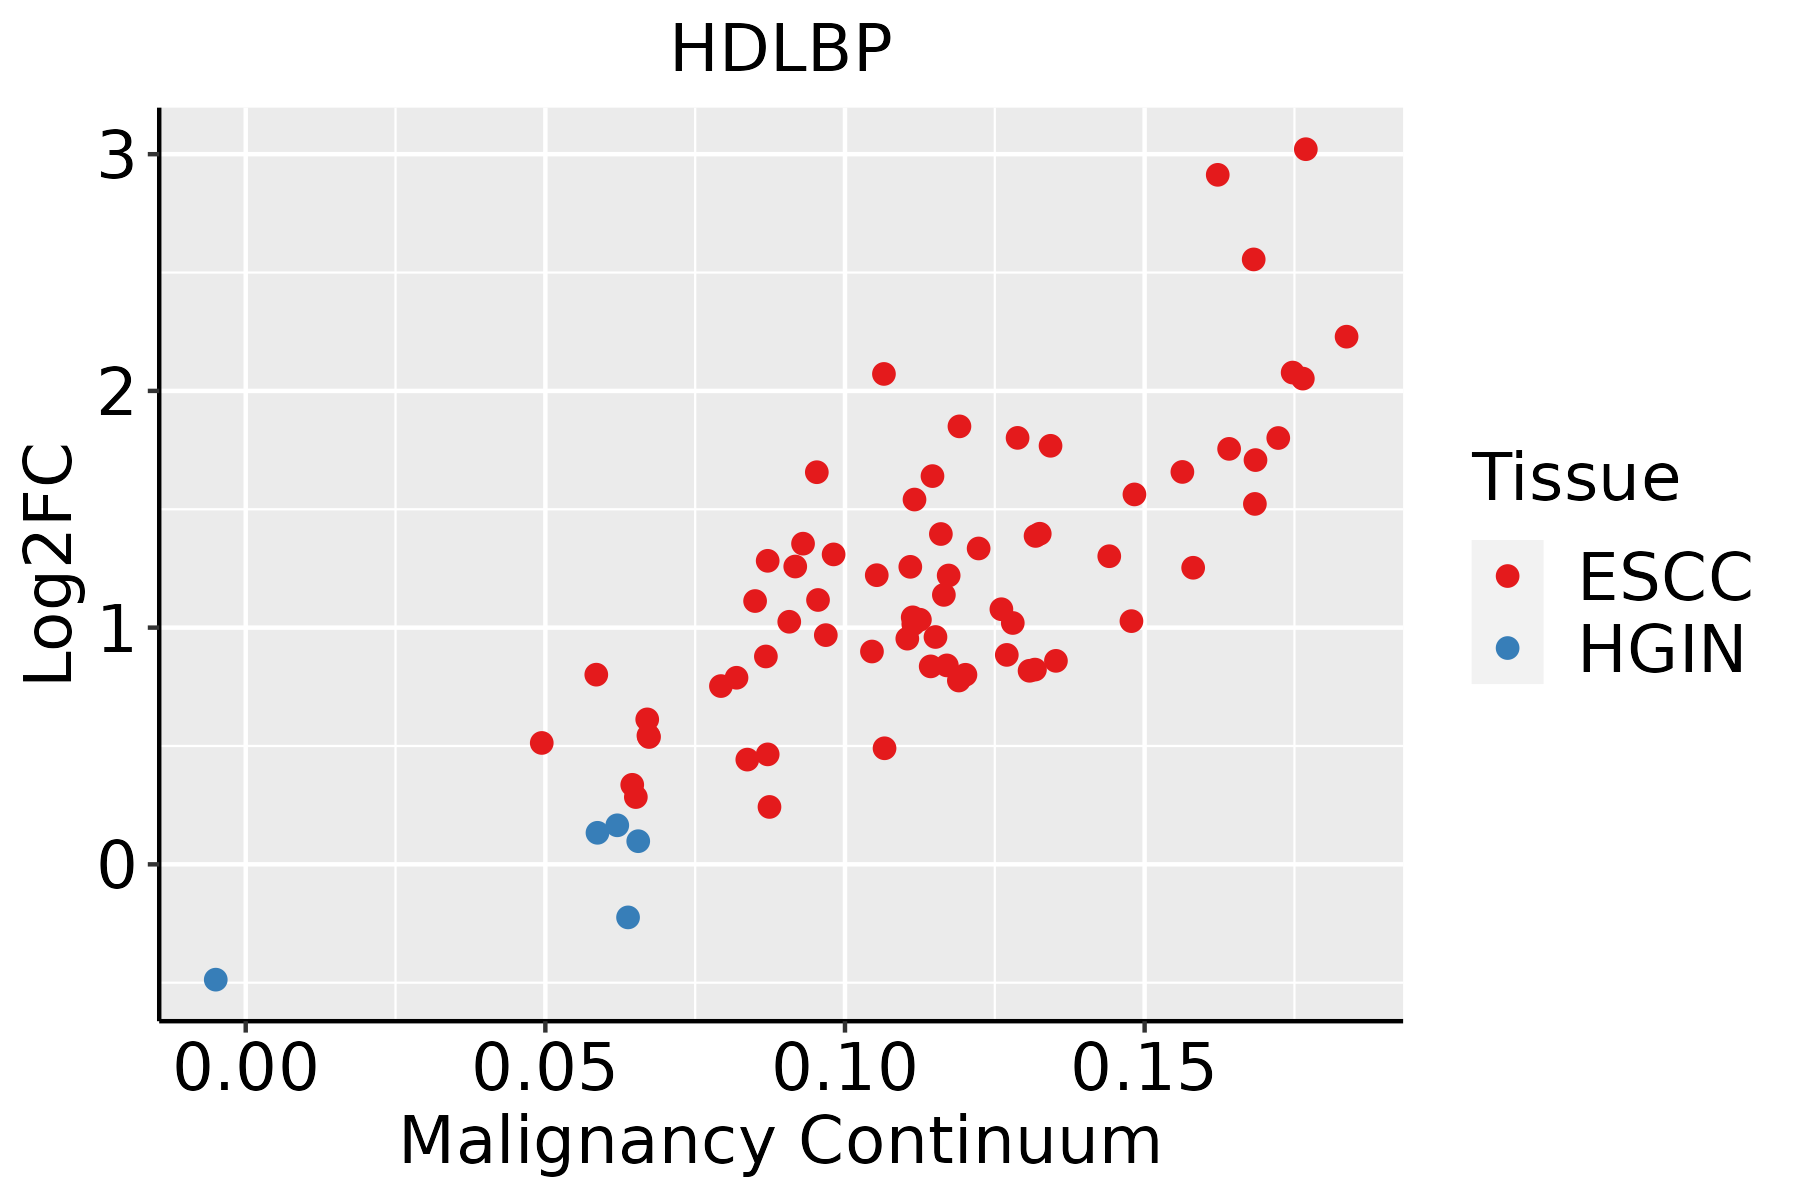
ESCC: Esophageal squamous cell carcinoma
HGIN: High-grade intraepithelial neoplasias
LGIN: Low-grade intraepithelial neoplasias
LiverThe image shows the transcriptomic changes along malignancy continuum.log2FC in expression of this searched gene in stem-like cells from each diseased tissue sample relative to stem-like cells in normal samples in each tissue plotted against the malignancy continuum. Samples are colored based on if they are from different disease stage.
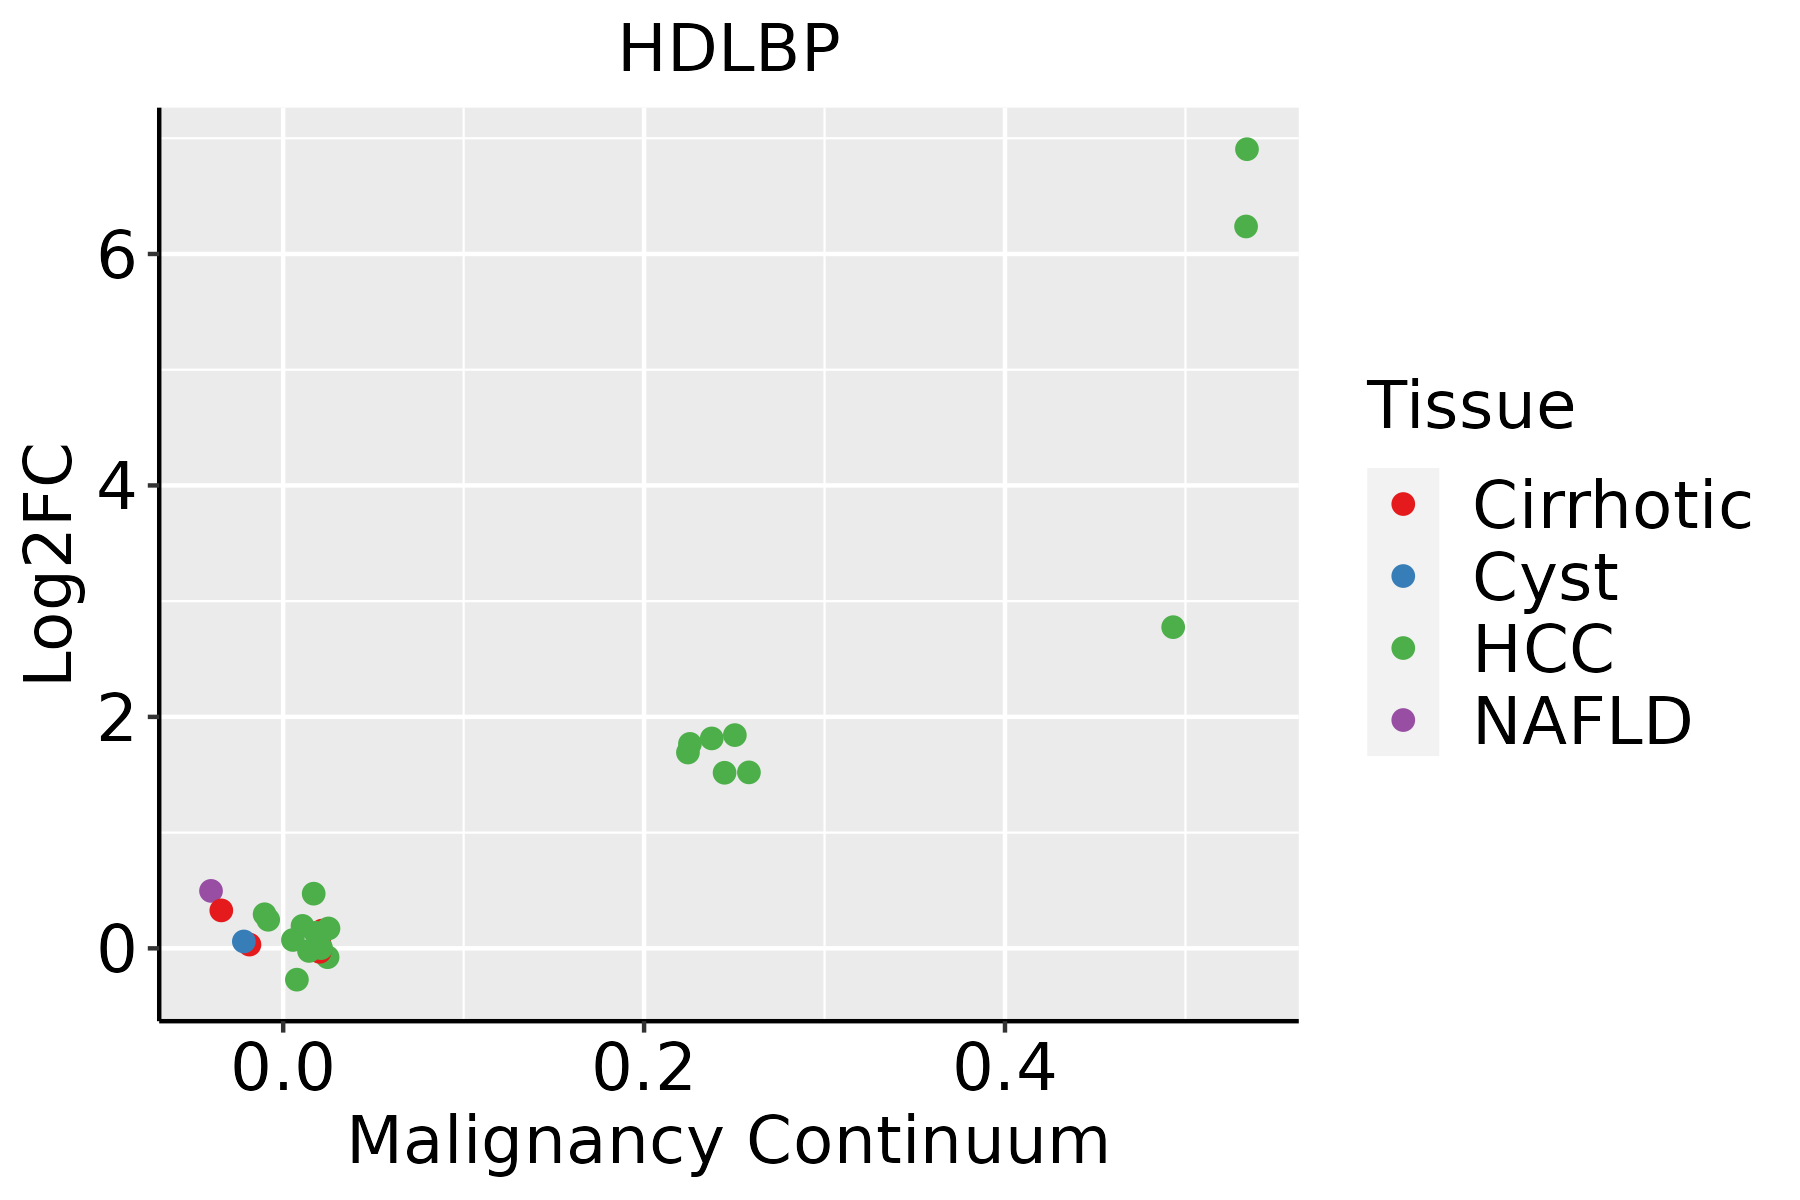
HCC: Hepatocellular carcinoma
NAFLD: Non-alcoholic fatty liver disease
Oral CavityThe image shows the transcriptomic changes along malignancy continuum.log2FC in expression of this searched gene in stem-like cells from each diseased tissue sample relative to stem-like cells in normal samples in each tissue plotted against the malignancy continuum. Samples are colored based on if they are from different disease stage.EOLP: Erosive Oral lichen planus
LP: leukoplakia
NEOLP: Non-erosive oral lichen planus
OSCC: Oral squamous cell carcinoma
ProstateThe image shows the transcriptomic changes along malignancy continuum.log2FC in expression of this searched gene in stem-like cells from each diseased tissue sample relative to stem-like cells in normal samples in each tissue plotted against the malignancy continuum. Samples are colored based on if they are from different disease stage.BPH: Benign Prostatic Hyperplasia
SkinThe image shows the transcriptomic changes along malignancy continuum.log2FC in expression of this searched gene in stem-like cells from each diseased tissue sample relative to stem-like cells in normal samples in each tissue plotted against the malignancy continuum. Samples are colored based on if they are from different disease stage.
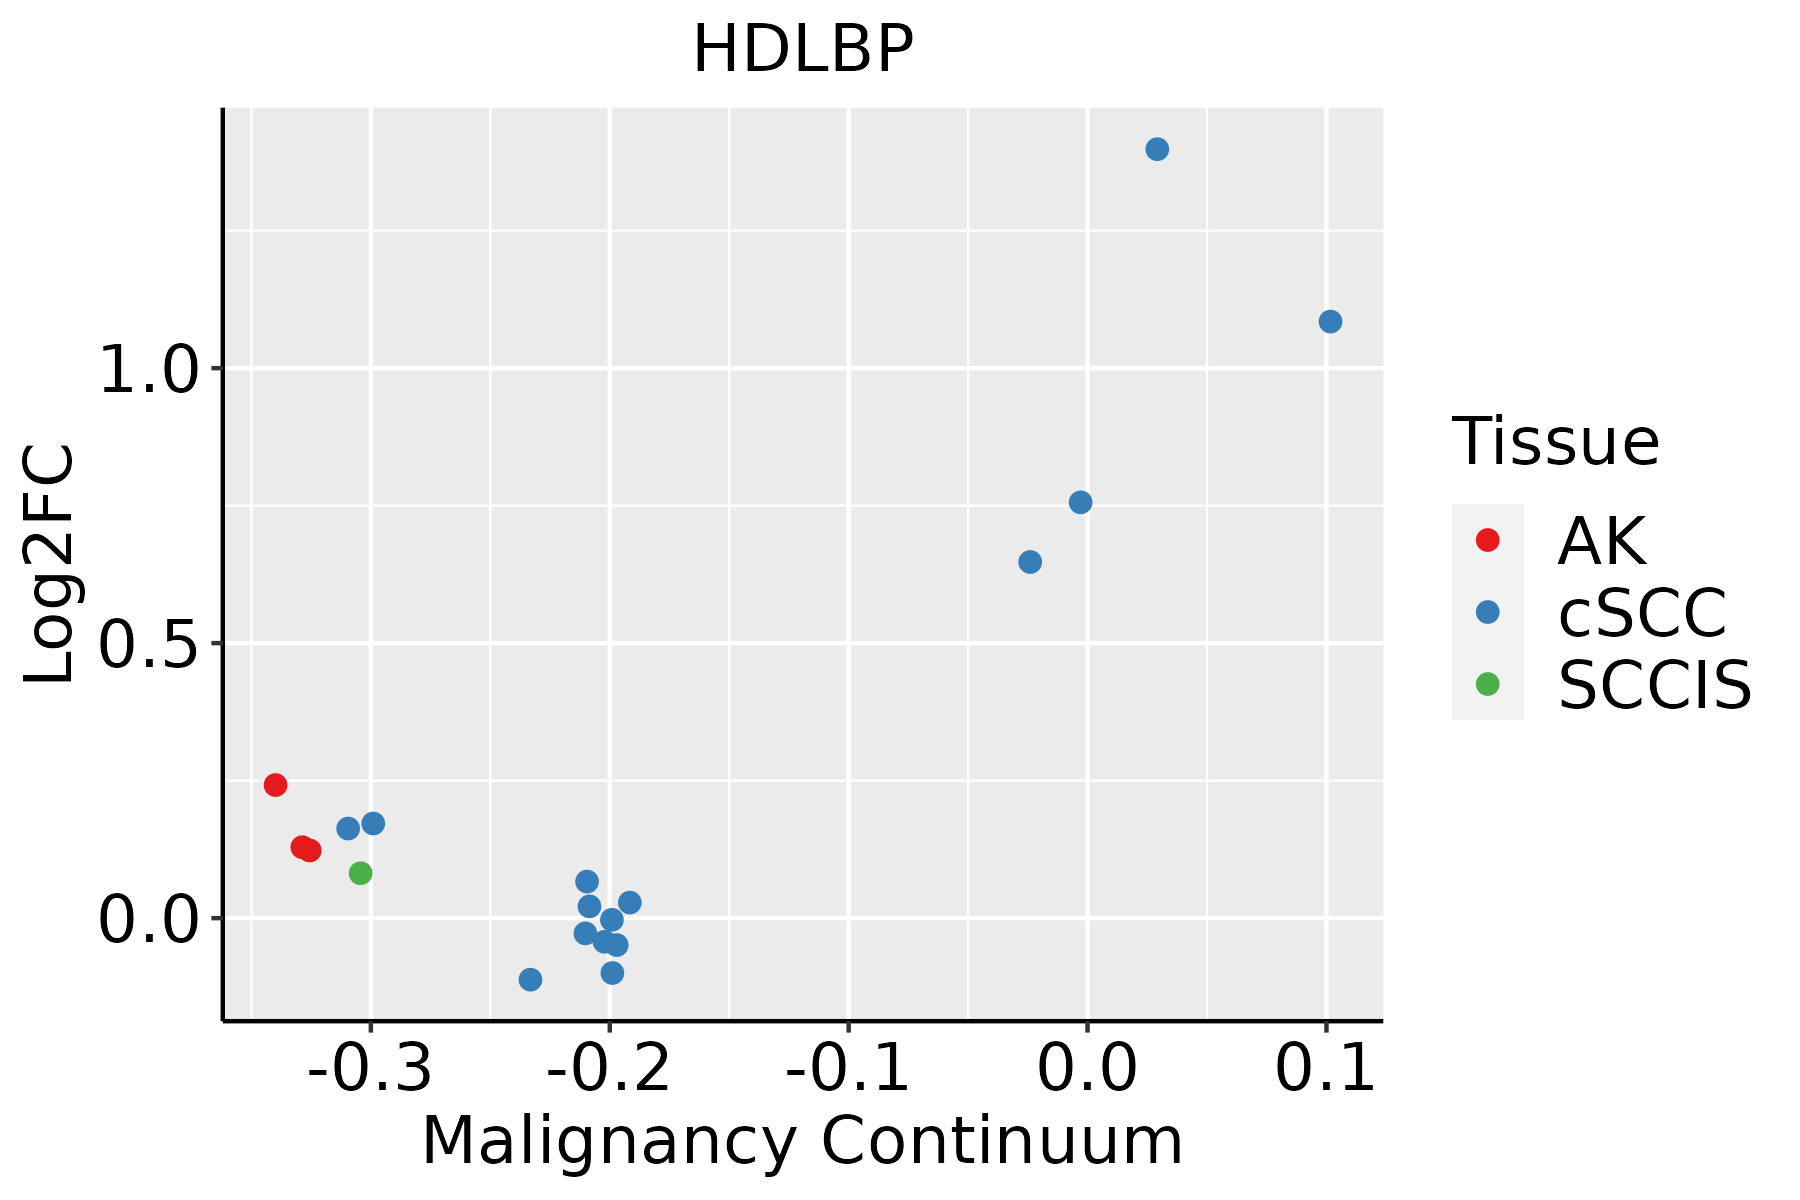
AK: Actinic keratosis
cSCC: Cutaneous squamous cell carcinoma
SCCIS:squamous cell carcinoma in situ
ThyroidThe image shows the transcriptomic changes along malignancy continuum.log2FC in expression of this searched gene in stem-like cells from each diseased tissue sample relative to stem-like cells in normal samples in each tissue plotted against the malignancy continuum. Samples are colored based on if they are from different disease stage.ATC: Anaplastic thyroid cancer
HT: Hashimoto's thyroiditis
PTC: Papillary thyroid cancer
∗log2FC in expression of this searched gene in stem-like cells from each diseased tissue sample relative to stem-like cells in normal samples in each tissue plotted against the malignancy continuum. Samples are colored based on if they are from different disease stage.

Top

Malignant transformation related pathway analysis

check buttonFind out the enriched GO biological processes and KEGG pathways involved in transition from healthy to precancer to cancer
check button Figure of enriched GO biological processes.
TissueDisease StageEnriched GO biological Processes
ColorectumADGO analysis - Figure of enriched GO biological processes: Top 15 enriched GO BP terms are showed in the bar plot of each disease state in each tissue. Each row represents a significant GO biological process which is colored according to the -log10(p.adjust).
ColorectumSERGO analysis - Figure of enriched GO biological processes: Top 15 enriched GO BP terms are showed in the bar plot of each disease state in each tissue. Each row represents a significant GO biological process which is colored according to the -log10(p.adjust).
ColorectumMSSGO analysis - Figure of enriched GO biological processes: Top 15 enriched GO BP terms are showed in the bar plot of each disease state in each tissue. Each row represents a significant GO biological process which is colored according to the -log10(p.adjust).
ColorectumMSI-HGO analysis - Figure of enriched GO biological processes: Top 15 enriched GO BP terms are showed in the bar plot of each disease state in each tissue. Each row represents a significant GO biological process which is colored according to the -log10(p.adjust).
ColorectumFAPGO analysis - Figure of enriched GO biological processes: Top 15 enriched GO BP terms are showed in the bar plot of each disease state in each tissue. Each row represents a significant GO biological process which is colored according to the -log10(p.adjust).
∗Top 15 enriched GO BP terms are showed in the bar plot of each disease state in each tissue. Each row represents a significant GO biological process which is colored according to the -log10(p.adjust).
Page: 1 2 3 4 5 6 7 8 9 

check button Enriched GO biological processes.
GO IDTissueDisease StageDescriptionGene RatioBg Ratiopvaluep.adjustCount
GO:0006066ColorectumADalcohol metabolic process106/3918353/187233.02e-055.57e-04106
GO:0010876ColorectumADlipid localization120/3918448/187231.59e-031.33e-02120
GO:0006869ColorectumADlipid transport108/3918398/187231.67e-031.39e-02108
GO:0008202ColorectumADsteroid metabolic process85/3918319/187238.07e-034.75e-0285
GO:00060661ColorectumSERalcohol metabolic process79/2897353/187233.50e-045.50e-0379
GO:00060662ColorectumMSSalcohol metabolic process92/3467353/187232.57e-043.46e-0392
GO:00108761ColorectumMSSlipid localization104/3467448/187236.76e-034.38e-02104
GO:00068691ColorectumFAPlipid transport81/2622398/187232.84e-043.76e-0381
GO:00108762ColorectumFAPlipid localization85/2622448/187231.92e-031.63e-0285
GO:00060663ColorectumFAPalcohol metabolic process69/2622353/187232.29e-031.85e-0269
GO:00068692ColorectumCRClipid transport63/2078398/187232.36e-032.26e-0263
GO:00060664ColorectumCRCalcohol metabolic process57/2078353/187232.37e-032.27e-0257
GO:00108763ColorectumCRClipid localization68/2078448/187234.60e-033.58e-0268
GO:00060668EsophagusESCCalcohol metabolic process202/8552353/187237.32e-067.26e-05202
GO:19026524EsophagusESCCsecondary alcohol metabolic process87/8552147/187236.58e-043.50e-0387
GO:00082034EsophagusESCCcholesterol metabolic process79/8552137/187233.11e-031.29e-0279
GO:00161254EsophagusESCCsterol metabolic process86/8552152/187234.37e-031.73e-0286
GO:00082023LiverNAFLDsteroid metabolic process69/1882319/187235.90e-101.28e-0769
GO:00108765LiverNAFLDlipid localization79/1882448/187234.75e-072.92e-0579
GO:00068694LiverNAFLDlipid transport71/1882398/187231.16e-065.59e-0571
Page: 1 2 3 

check button Enriched KEGG pathways.
Pathway IDTissueDisease StageDescriptionGene RatioBg Ratiopvaluep.adjustqvalueCount
Page: 1 

Top

Cell-cell communication analysis

check buttonIdentification of potential cell-cell interactions between two cell types and their ligand-receptor pairs for different disease states
LigandReceptorLRpairPathwayTissueDisease Stage
Page: 1 

Top

Single-cell gene regulatory network inference analysis

check buttonFind out the significant the regulons (TFs) and the target genes of each regulon across cell types for different disease states
TFCell TypeTissueDisease StageTarget GeneRSSRegulon Activity
∗The dot plots of a searched regulon are shown for all cell subpopulations in each disease state of each tissue based on the regulon specific score inferred using pySCENIC and by calculating the average expression.
Page: 1 

Top

Somatic mutation of malignant transformation related genes

check buttonAnnotation of somatic variants for genes involved in malignant transformation
Hugo SymbolVariant ClassVariant ClassificationdbSNP RSHGVScHGVSpHGVSp ShortSWISSPROTBIOTYPESIFTPolyPhenTumor Sample BarcodeTissueHistologySexAgeStageTherapy TypesDrugsOutcome
HDLBPSNVMissense_Mutationc.436N>Gp.Arg146Glyp.R146Gprotein_codingtolerated(0.23)benign(0.003)TCGA-A2-A0D1-01Breastbreast invasive carcinomaFemale>=65I/IIChemotherapytaxotereSD
HDLBPSNVMissense_Mutationrs145714274c.2867N>Ap.Arg956Glnp.R956Qprotein_codingtolerated(0.11)possibly_damaging(0.908)TCGA-A2-A0T2-01Breastbreast invasive carcinomaFemale>=65III/IVChemotherapyxelodaPD
HDLBPSNVMissense_Mutationc.824N>Gp.Glu275Glyp.E275Gprotein_codingdeleterious(0)benign(0.169)TCGA-A8-A09Z-01Breastbreast invasive carcinomaFemale>=65I/IIUnknownUnknownSD
HDLBPSNVMissense_Mutationc.2737N>Ap.Glu913Lysp.E913Kprotein_codingtolerated(0.15)benign(0.254)TCGA-AC-A23H-01Breastbreast invasive carcinomaFemale>=65I/IIUnknownUnknownPD
HDLBPSNVMissense_Mutationc.2735N>Ap.Arg912Lysp.R912Kprotein_codingtolerated(0.14)benign(0.052)TCGA-AC-A23H-01Breastbreast invasive carcinomaFemale>=65I/IIUnknownUnknownPD
HDLBPSNVMissense_Mutationnovelc.335G>Tp.Gly112Valp.G112Vprotein_codingdeleterious(0)possibly_damaging(0.847)TCGA-AC-A7VC-01Breastbreast invasive carcinomaFemale<65I/IIUnknownUnknownSD
HDLBPSNVMissense_Mutationrs776943175c.2701N>Tp.Arg901Trpp.R901Wprotein_codingdeleterious(0.03)probably_damaging(0.934)TCGA-AN-A046-01Breastbreast invasive carcinomaFemale>=65I/IIUnknownUnknownSD
HDLBPSNVMissense_Mutationc.1873G>Cp.Glu625Glnp.E625Qprotein_codingdeleterious(0.01)benign(0.073)TCGA-AN-A0XW-01Breastbreast invasive carcinomaFemale<65III/IVUnknownUnknownSD
HDLBPSNVMissense_Mutationrs767410138c.97N>Ap.Glu33Lysp.E33Kprotein_codingtolerated(0.16)benign(0.127)TCGA-AO-A0JC-01Breastbreast invasive carcinomaFemale<65I/IIChemotherapyfluorouracilSD
HDLBPSNVMissense_Mutationnovelc.2838N>Tp.Arg946Serp.R946Sprotein_codingtolerated(0.26)benign(0.011)TCGA-BH-A0B6-01Breastbreast invasive carcinomaFemale<65I/IIUnknownUnknownSD
Page: 1 2 3 4 5 6 7 8 9 10 11 12 13 14 15 16 17 18 19 20 

Top

Related drugs of malignant transformation related genes

check buttonIdentification of chemicals and drugs interact with genes involved in malignant transfromation
(DGIdb 4.0)
Entrez IDSymbolCategoryInteraction TypesDrug Claim NameDrug NamePMIDs
Page: 1