
|
|||||
|
 | |
| |
| |
| |
| |
| |
|
Gene: HDHD5 |
Gene summary for HDHD5 |
| Gene information | Species | Human | Gene symbol | HDHD5 | Gene ID | 27440 |
| Gene name | haloacid dehalogenase like hydrolase domain containing 5 | |
| Gene Alias | CECR5 | |
| Cytomap | 22q11.1 | |
| Gene Type | protein-coding | GO ID | GO:0006629 | UniProtAcc | Q9BXW7 |
Top |
Malignant transformation analysis |
| Identification of the aberrant gene expression in precancerous and cancerous lesions by comparing the gene expression of stem-like cells in diseased tissues with normal stem cells |
| Entrez ID | Symbol | Replicates | Species | Organ | Tissue | Adj P-value | Log2FC | Malignancy |
| 27440 | HDHD5 | S014 | Human | Liver | HCC | 4.30e-33 | 9.47e-01 | 0.2254 |
| 27440 | HDHD5 | S015 | Human | Liver | HCC | 3.61e-30 | 1.17e+00 | 0.2375 |
| 27440 | HDHD5 | S016 | Human | Liver | HCC | 1.26e-33 | 9.59e-01 | 0.2243 |
| 27440 | HDHD5 | S027 | Human | Liver | HCC | 1.63e-09 | 7.69e-01 | 0.2446 |
| 27440 | HDHD5 | S028 | Human | Liver | HCC | 7.68e-27 | 9.47e-01 | 0.2503 |
| 27440 | HDHD5 | S029 | Human | Liver | HCC | 9.37e-31 | 1.11e+00 | 0.2581 |
| Page: 1 |
| Tissue | Expression Dynamics | Abbreviation |
| Liver | 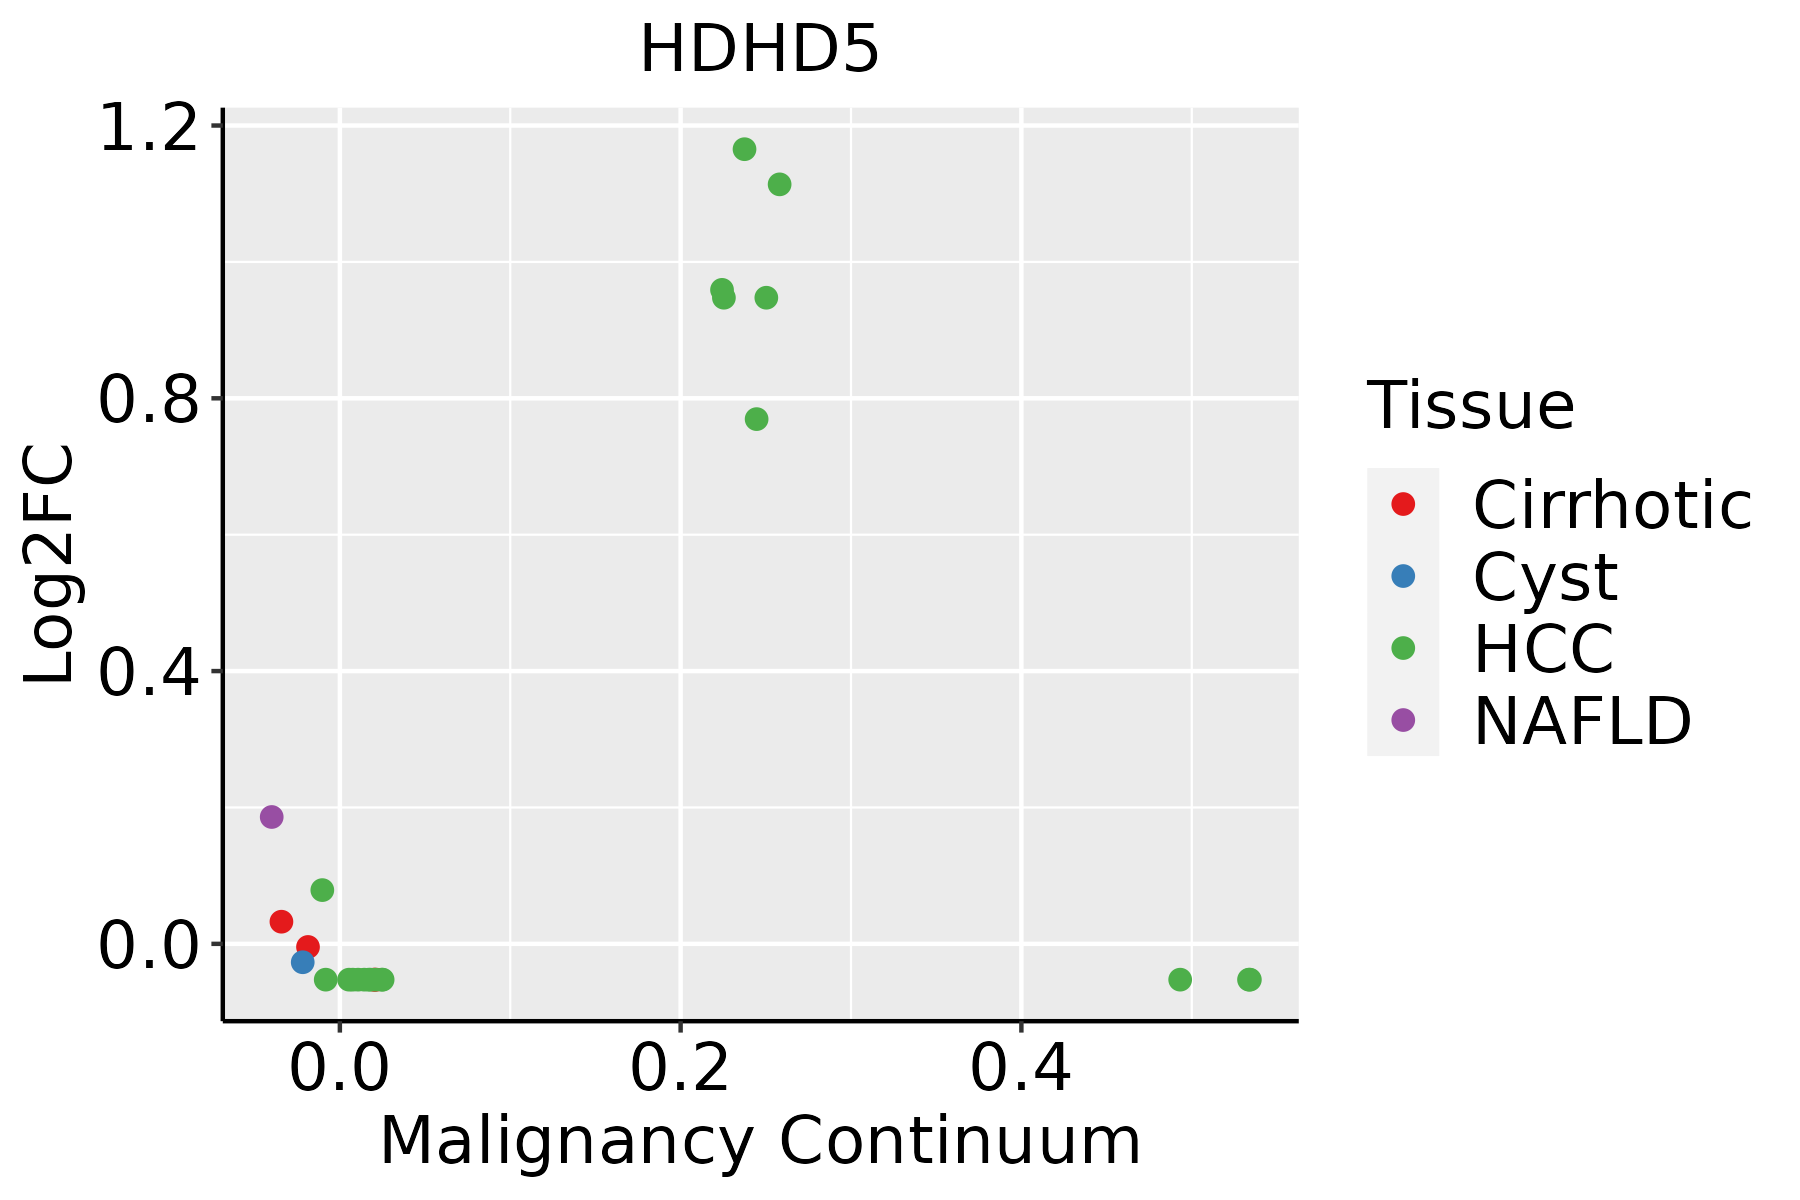 | HCC: Hepatocellular carcinoma |
| NAFLD: Non-alcoholic fatty liver disease |
| ∗log2FC in expression of this searched gene in stem-like cells from each diseased tissue sample relative to stem-like cells in normal samples in each tissue plotted against the malignancy continuum. Samples are colored based on if they are from different disease stage. |
Top |
Malignant transformation related pathway analysis |
| Find out the enriched GO biological processes and KEGG pathways involved in transition from healthy to precancer to cancer |
| Tissue | Disease Stage | Enriched GO biological Processes |
| Colorectum | AD |  |
| Colorectum | SER |  |
| Colorectum | MSS |  |
| Colorectum | MSI-H |  |
| Colorectum | FAP |  |
| ∗Top 15 enriched GO BP terms are showed in the bar plot of each disease state in each tissue. Each row represents a significant GO biological process which is colored according to the -log10(p.adjust). |
| Page: 1 2 3 4 5 6 7 8 9 |
| GO ID | Tissue | Disease Stage | Description | Gene Ratio | Bg Ratio | pvalue | p.adjust | Count |
| GO:00086542 | Liver | HCC | phospholipid biosynthetic process | 150/7958 | 253/18723 | 4.77e-08 | 1.03e-06 | 150 |
| GO:00066444 | Liver | HCC | phospholipid metabolic process | 214/7958 | 383/18723 | 7.25e-08 | 1.48e-06 | 214 |
| GO:004648611 | Liver | HCC | glycerolipid metabolic process | 215/7958 | 392/18723 | 4.54e-07 | 7.49e-06 | 215 |
| GO:004501711 | Liver | HCC | glycerolipid biosynthetic process | 143/7958 | 252/18723 | 3.27e-06 | 4.31e-05 | 143 |
| GO:00066504 | Liver | HCC | glycerophospholipid metabolic process | 168/7958 | 306/18723 | 7.27e-06 | 8.62e-05 | 168 |
| GO:004647411 | Liver | HCC | glycerophospholipid biosynthetic process | 121/7958 | 211/18723 | 9.12e-06 | 1.06e-04 | 121 |
| Page: 1 |
| Pathway ID | Tissue | Disease Stage | Description | Gene Ratio | Bg Ratio | pvalue | p.adjust | qvalue | Count |
| Page: 1 |
Top |
Cell-cell communication analysis |
| Identification of potential cell-cell interactions between two cell types and their ligand-receptor pairs for different disease states |
| Ligand | Receptor | LRpair | Pathway | Tissue | Disease Stage |
| Page: 1 |
Top |
Single-cell gene regulatory network inference analysis |
| Find out the significant the regulons (TFs) and the target genes of each regulon across cell types for different disease states |
| TF | Cell Type | Tissue | Disease Stage | Target Gene | RSS | Regulon Activity |
| ∗The dot plots of a searched regulon are shown for all cell subpopulations in each disease state of each tissue based on the regulon specific score inferred using pySCENIC and by calculating the average expression. |
| Page: 1 |
Top |
Somatic mutation of malignant transformation related genes |
| Annotation of somatic variants for genes involved in malignant transformation |
| Hugo Symbol | Variant Class | Variant Classification | dbSNP RS | HGVSc | HGVSp | HGVSp Short | SWISSPROT | BIOTYPE | SIFT | PolyPhen | Tumor Sample Barcode | Tissue | Histology | Sex | Age | Stage | Therapy Types | Drugs | Outcome |
| HDHD5 | SNV | Missense_Mutation | rs769218856 | c.563N>A | p.Arg188His | p.R188H | Q9BXW7 | protein_coding | tolerated(0.12) | benign(0.015) | TCGA-A2-A0YT-01 | Breast | breast invasive carcinoma | Female | <65 | III/IV | Hormone Therapy | arimidex | SD |
| HDHD5 | SNV | Missense_Mutation | c.186N>C | p.Arg62Ser | p.R62S | Q9BXW7 | protein_coding | tolerated(0.67) | benign(0.038) | TCGA-A8-A06O-01 | Breast | breast invasive carcinoma | Female | <65 | I/II | Hormone Therapy | letrozole | SD | |
| HDHD5 | insertion | Nonsense_Mutation | novel | c.266_267insCTAGTCCT | p.Asn90Ter | p.N90* | Q9BXW7 | protein_coding | TCGA-A8-A07Z-01 | Breast | breast invasive carcinoma | Female | >=65 | I/II | Unspecific | Exemestane | SD | ||
| HDHD5 | SNV | Missense_Mutation | rs779267988 | c.469N>A | p.Val157Met | p.V157M | Q9BXW7 | protein_coding | tolerated(0.14) | benign(0.043) | TCGA-2W-A8YY-01 | Cervix | cervical & endocervical cancer | Female | <65 | I/II | Chemotherapy | cisplatin | CR |
| HDHD5 | SNV | Missense_Mutation | rs377264272 | c.230N>T | p.Ser77Phe | p.S77F | Q9BXW7 | protein_coding | deleterious(0.01) | possibly_damaging(0.863) | TCGA-HM-A4S6-01 | Cervix | cervical & endocervical cancer | Female | <65 | III/IV | Chemotherapy | cisplatin | CR |
| HDHD5 | SNV | Missense_Mutation | rs774799143 | c.1093G>A | p.Val365Ile | p.V365I | Q9BXW7 | protein_coding | tolerated(0.08) | possibly_damaging(0.465) | TCGA-AA-3864-01 | Colorectum | colon adenocarcinoma | Male | >=65 | I/II | Unknown | Unknown | SD |
| HDHD5 | SNV | Missense_Mutation | rs749947487 | c.487G>A | p.Ala163Thr | p.A163T | Q9BXW7 | protein_coding | tolerated(0.08) | benign(0.141) | TCGA-CM-4746-01 | Colorectum | colon adenocarcinoma | Male | <65 | I/II | Unknown | Unknown | SD |
| HDHD5 | SNV | Missense_Mutation | rs773813838 | c.998C>T | p.Thr333Met | p.T333M | Q9BXW7 | protein_coding | tolerated(0.13) | benign(0.063) | TCGA-G4-6320-01 | Colorectum | colon adenocarcinoma | Male | >=65 | III/IV | Chemotherapy | oxaliplatin | SD |
| HDHD5 | SNV | Missense_Mutation | c.555N>G | p.Asp185Glu | p.D185E | Q9BXW7 | protein_coding | tolerated(0.33) | benign(0.009) | TCGA-AG-3898-01 | Colorectum | rectum adenocarcinoma | Male | <65 | I/II | Unknown | Unknown | SD | |
| HDHD5 | SNV | Missense_Mutation | novel | c.628G>T | p.Asp210Tyr | p.D210Y | Q9BXW7 | protein_coding | deleterious(0) | probably_damaging(1) | TCGA-AP-A0LM-01 | Endometrium | uterine corpus endometrioid carcinoma | Female | <65 | III/IV | Chemotherapy | cisplatin | SD |
| Page: 1 2 3 4 |
Top |
Related drugs of malignant transformation related genes |
| Identification of chemicals and drugs interact with genes involved in malignant transfromation |
| (DGIdb 4.0) |
| Entrez ID | Symbol | Category | Interaction Types | Drug Claim Name | Drug Name | PMIDs |
| Page: 1 |

Copyright 2023-Present -The University of Texas Health Science Center at Houston |