Schematic overview of the cellular and molecular mechanisms involved in the cancer progression, including the proposed cellular and molecular mechanisms in cancer cells trajectory. AT1: alveolar type 1 cells; AT2: alveolar type 2 cells; AAH: atypical adenomatous hyperplasia; AIS: adenocarcinoma in situ; MIA: minimally invasive adenocarcinoma; IA: invasive adenocarcinoma; EMT: epithelial-mesenchymal transition

Home

Download

Statistics

Help

Contact

Center for Computational Systems Medicine
leaf

Gene summary

leaf

Malignant transformation analysis

leaf

Malignant transformation related pathway analysis

leaf

Cell-cell communication analysis

leaf

Single-cell gene regulatory network inference analysis

leaf

Somatic mutation of malignant transformation related genes

leaf

Related drugs of malignant transformation related genes

Gene: HDGF

Gene summary for HDGF

check button Gene summary.

Gene informationSpeciesHuman
Gene symbol

HDGF

Gene ID

3068

Gene nameheparin binding growth factor
Gene AliasHMG1L2
Cytomap1q23.1
Gene Typeprotein-coding
GO ID

GO:0000122

UniProtAcc

P51858


Top

Malignant transformation analysis

check button Identification of the aberrant gene expression in precancerous and cancerous lesions by comparing the gene expression of stem-like cells in diseased tissues with normal stem cells
check button Malignant transformation involving gene list.
Entrez IDSymbolReplicatesSpeciesOrganTissueAdj P-valueLog2FCMalignancy
3068HDGFHTA11_3410_2000001011HumanColorectumAD4.08e-093.37e-010.0155
3068HDGFHTA11_2487_2000001011HumanColorectumSER1.79e-189.02e-01-0.1808
3068HDGFHTA11_1938_2000001011HumanColorectumAD6.47e-241.13e+00-0.0811
3068HDGFHTA11_78_2000001011HumanColorectumAD1.14e-076.15e-01-0.1088
3068HDGFHTA11_347_2000001011HumanColorectumAD1.42e-371.01e+00-0.1954
3068HDGFHTA11_411_2000001011HumanColorectumSER1.29e-091.14e+00-0.2602
3068HDGFHTA11_3361_2000001011HumanColorectumAD6.36e-035.16e-01-0.1207
3068HDGFHTA11_83_2000001011HumanColorectumSER1.03e-161.04e+00-0.1526
3068HDGFHTA11_696_2000001011HumanColorectumAD7.93e-186.88e-01-0.1464
3068HDGFHTA11_866_2000001011HumanColorectumAD2.37e-044.18e-01-0.1001
3068HDGFHTA11_1391_2000001011HumanColorectumAD1.82e-191.01e+00-0.059
3068HDGFHTA11_2992_2000001011HumanColorectumSER7.64e-099.81e-01-0.1706
3068HDGFHTA11_5212_2000001011HumanColorectumAD2.45e-086.41e-01-0.2061
3068HDGFHTA11_5216_2000001011HumanColorectumSER3.11e-025.62e-01-0.1462
3068HDGFHTA11_546_2000001011HumanColorectumAD2.46e-118.57e-01-0.0842
3068HDGFHTA11_7862_2000001011HumanColorectumAD3.95e-055.12e-01-0.0179
3068HDGFHTA11_866_3004761011HumanColorectumAD7.74e-157.25e-010.096
3068HDGFHTA11_4255_2000001011HumanColorectumSER5.60e-088.55e-010.0446
3068HDGFHTA11_8622_2000001021HumanColorectumSER5.65e-045.37e-010.0528
3068HDGFHTA11_7663_2000001011HumanColorectumSER6.18e-067.41e-010.0131
Page: 1 2 3 4 5 6 7 8 9 10 

check button Transcriptomic changes along malignancy continuum.
TissueExpression DynamicsAbbreviation
Colorectum (GSE201348)The image shows the transcriptomic changes along malignancy continuum.log2FC in expression of this searched gene in stem-like cells from each diseased tissue sample relative to stem-like cells in normal samples in each tissue plotted against the malignancy continuum. Samples are colored based on if they are from different disease stage.FAP: Familial adenomatous polyposis
CRC: Colorectal cancer
Colorectum (HTA11)The image shows the transcriptomic changes along malignancy continuum.log2FC in expression of this searched gene in stem-like cells from each diseased tissue sample relative to stem-like cells in normal samples in each tissue plotted against the malignancy continuum. Samples are colored based on if they are from different disease stage.AD: Adenomas
SER: Sessile serrated lesions
MSI-H: Microsatellite-high colorectal cancer
MSS: Microsatellite stable colorectal cancer
EndometriumThe image shows the transcriptomic changes along malignancy continuum.log2FC in expression of this searched gene in stem-like cells from each diseased tissue sample relative to stem-like cells in normal samples in each tissue plotted against the malignancy continuum. Samples are colored based on if they are from different disease stage.
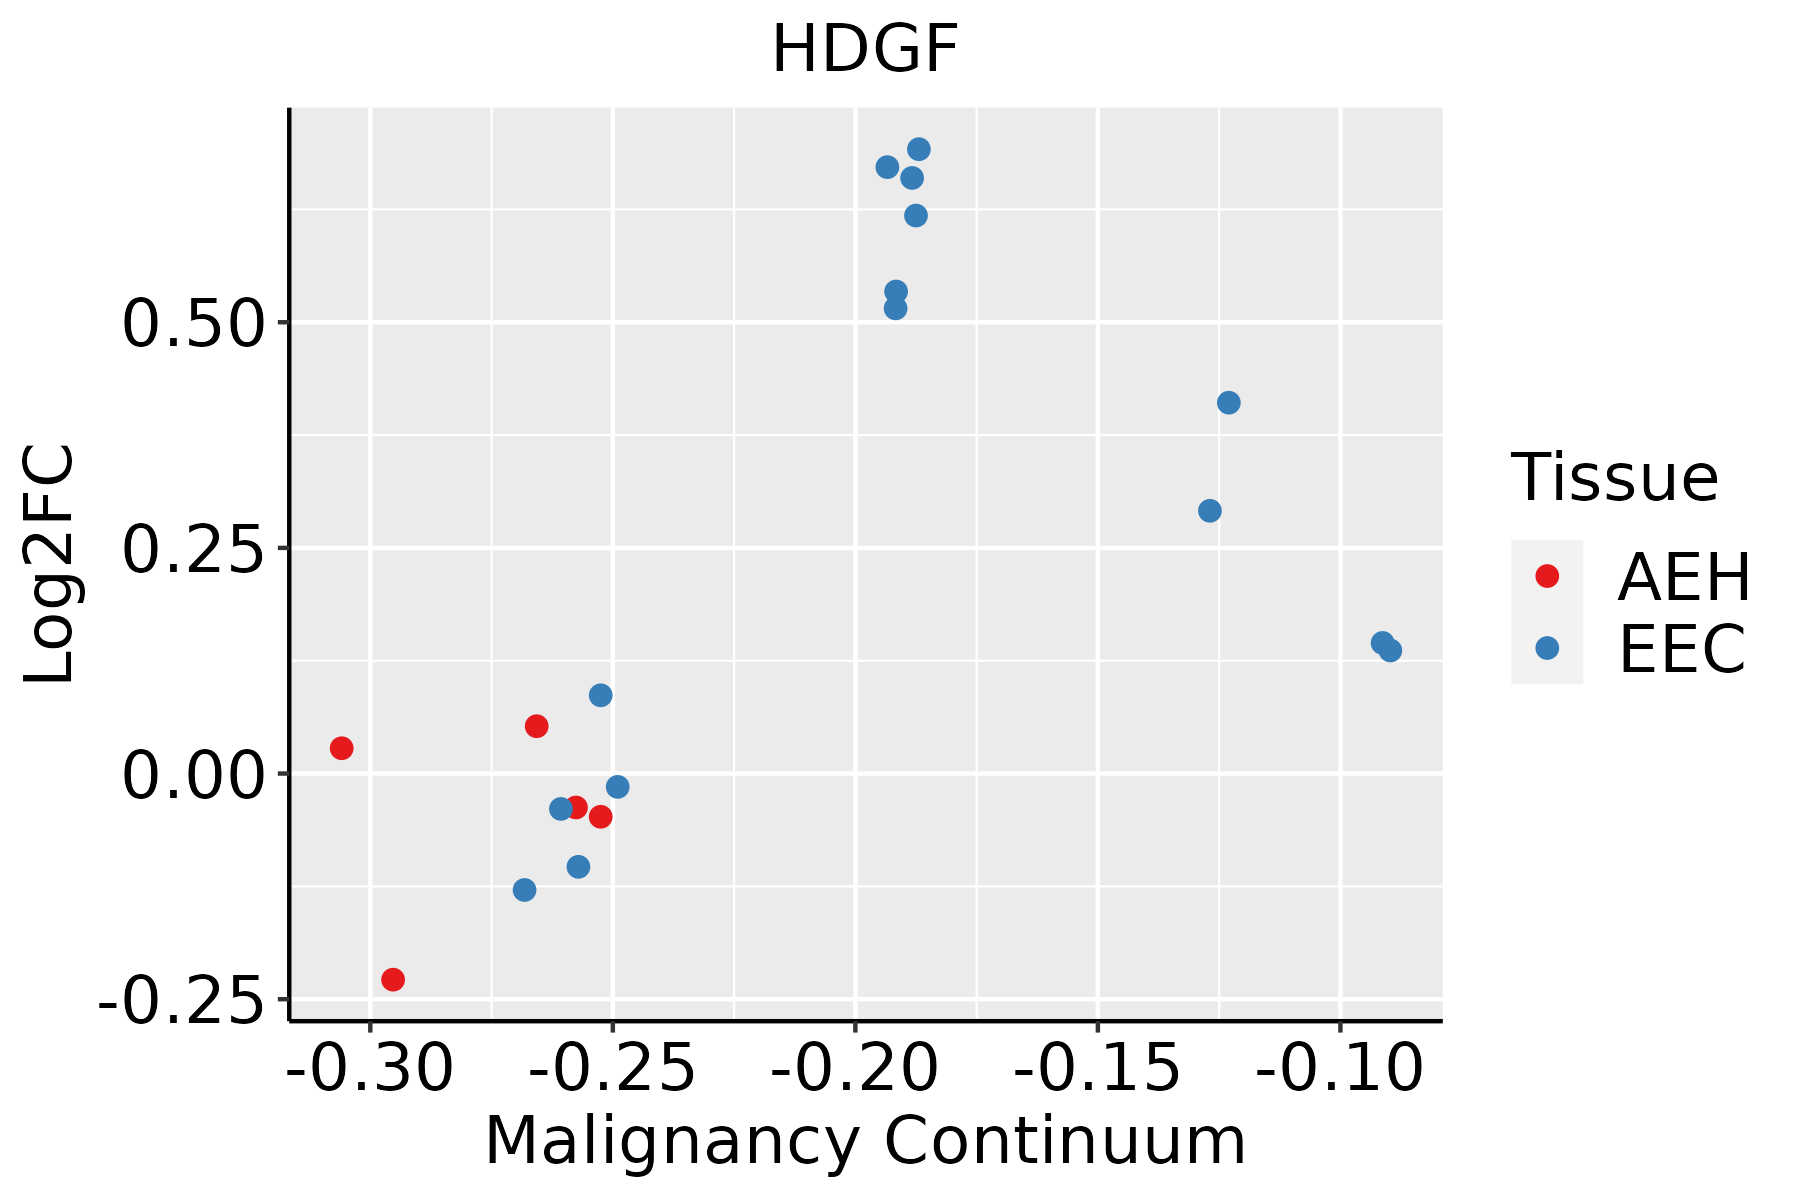
AEH: Atypical endometrial hyperplasia
EEC: Endometrioid Cancer
EsophagusThe image shows the transcriptomic changes along malignancy continuum.log2FC in expression of this searched gene in stem-like cells from each diseased tissue sample relative to stem-like cells in normal samples in each tissue plotted against the malignancy continuum. Samples are colored based on if they are from different disease stage.
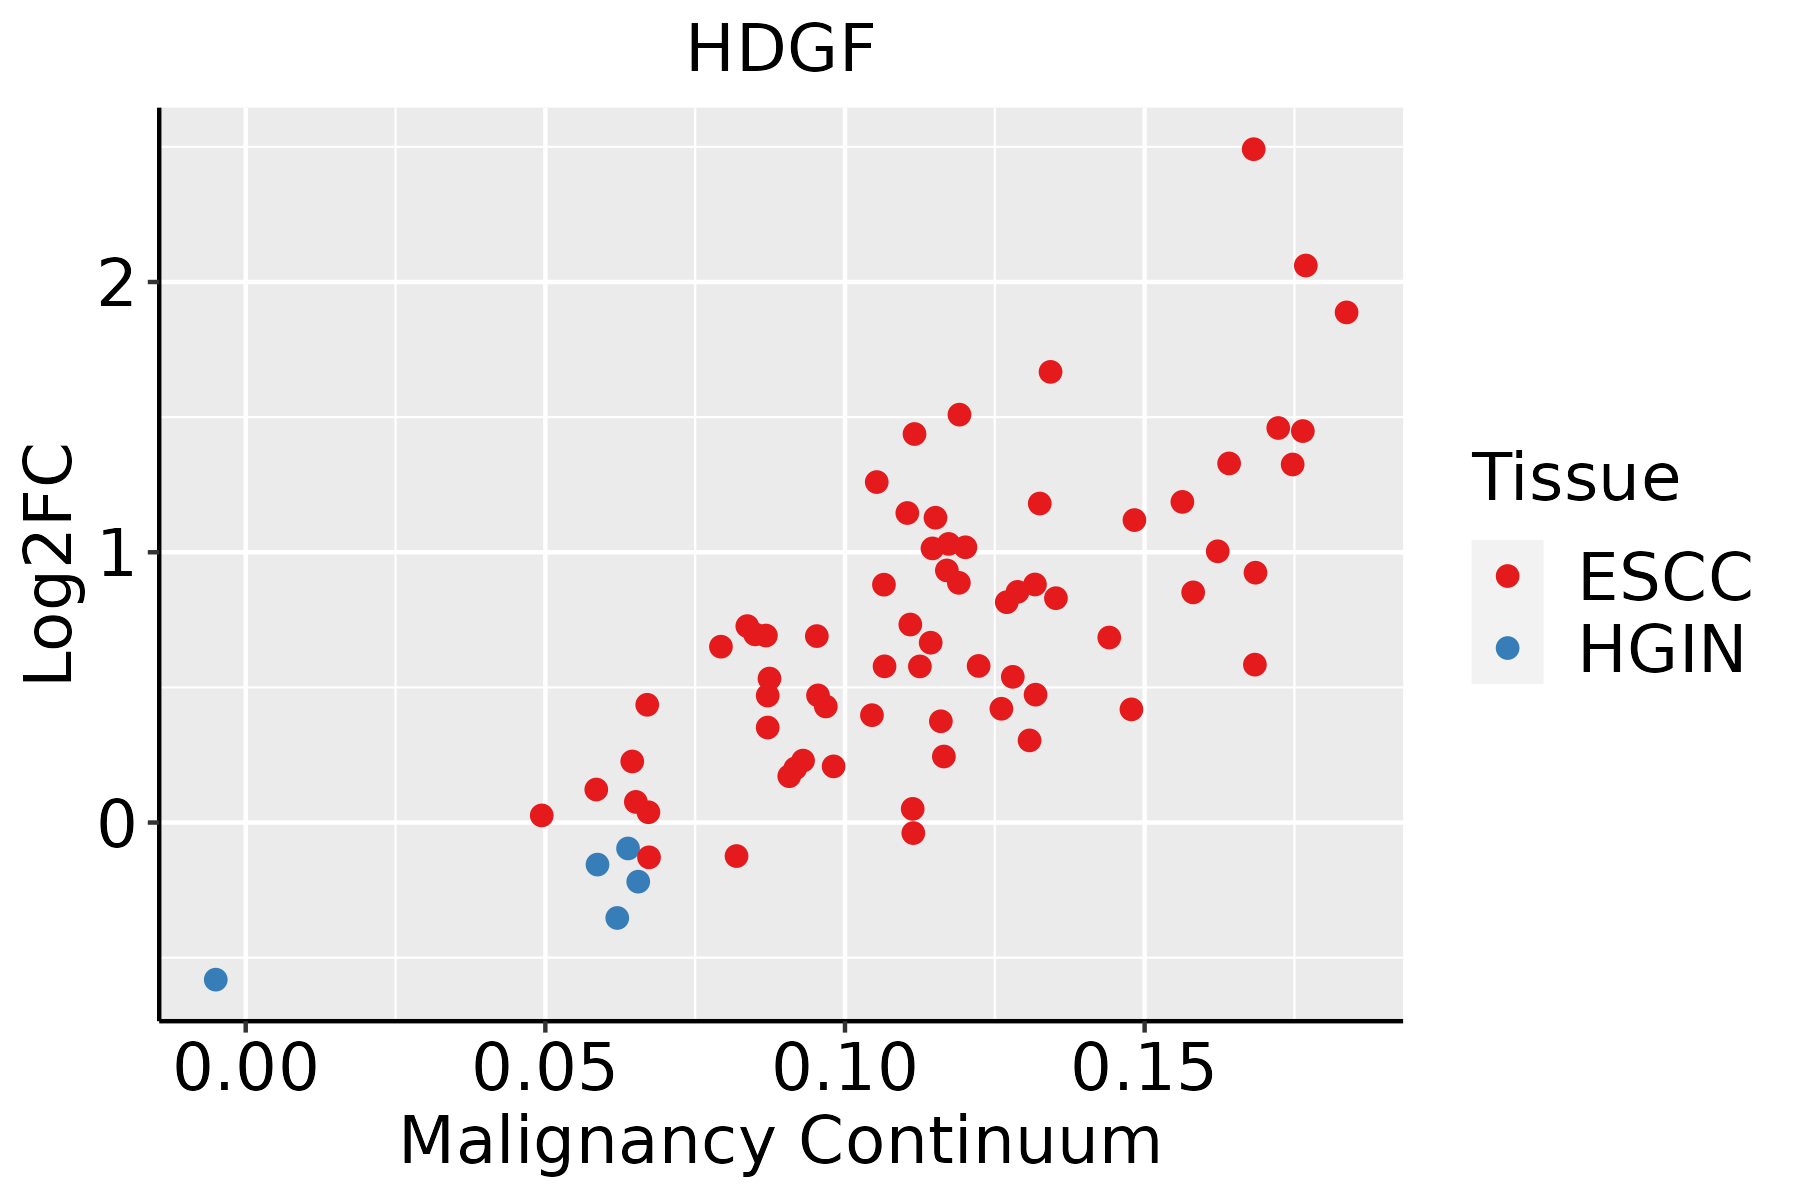
ESCC: Esophageal squamous cell carcinoma
HGIN: High-grade intraepithelial neoplasias
LGIN: Low-grade intraepithelial neoplasias
LiverThe image shows the transcriptomic changes along malignancy continuum.log2FC in expression of this searched gene in stem-like cells from each diseased tissue sample relative to stem-like cells in normal samples in each tissue plotted against the malignancy continuum. Samples are colored based on if they are from different disease stage.
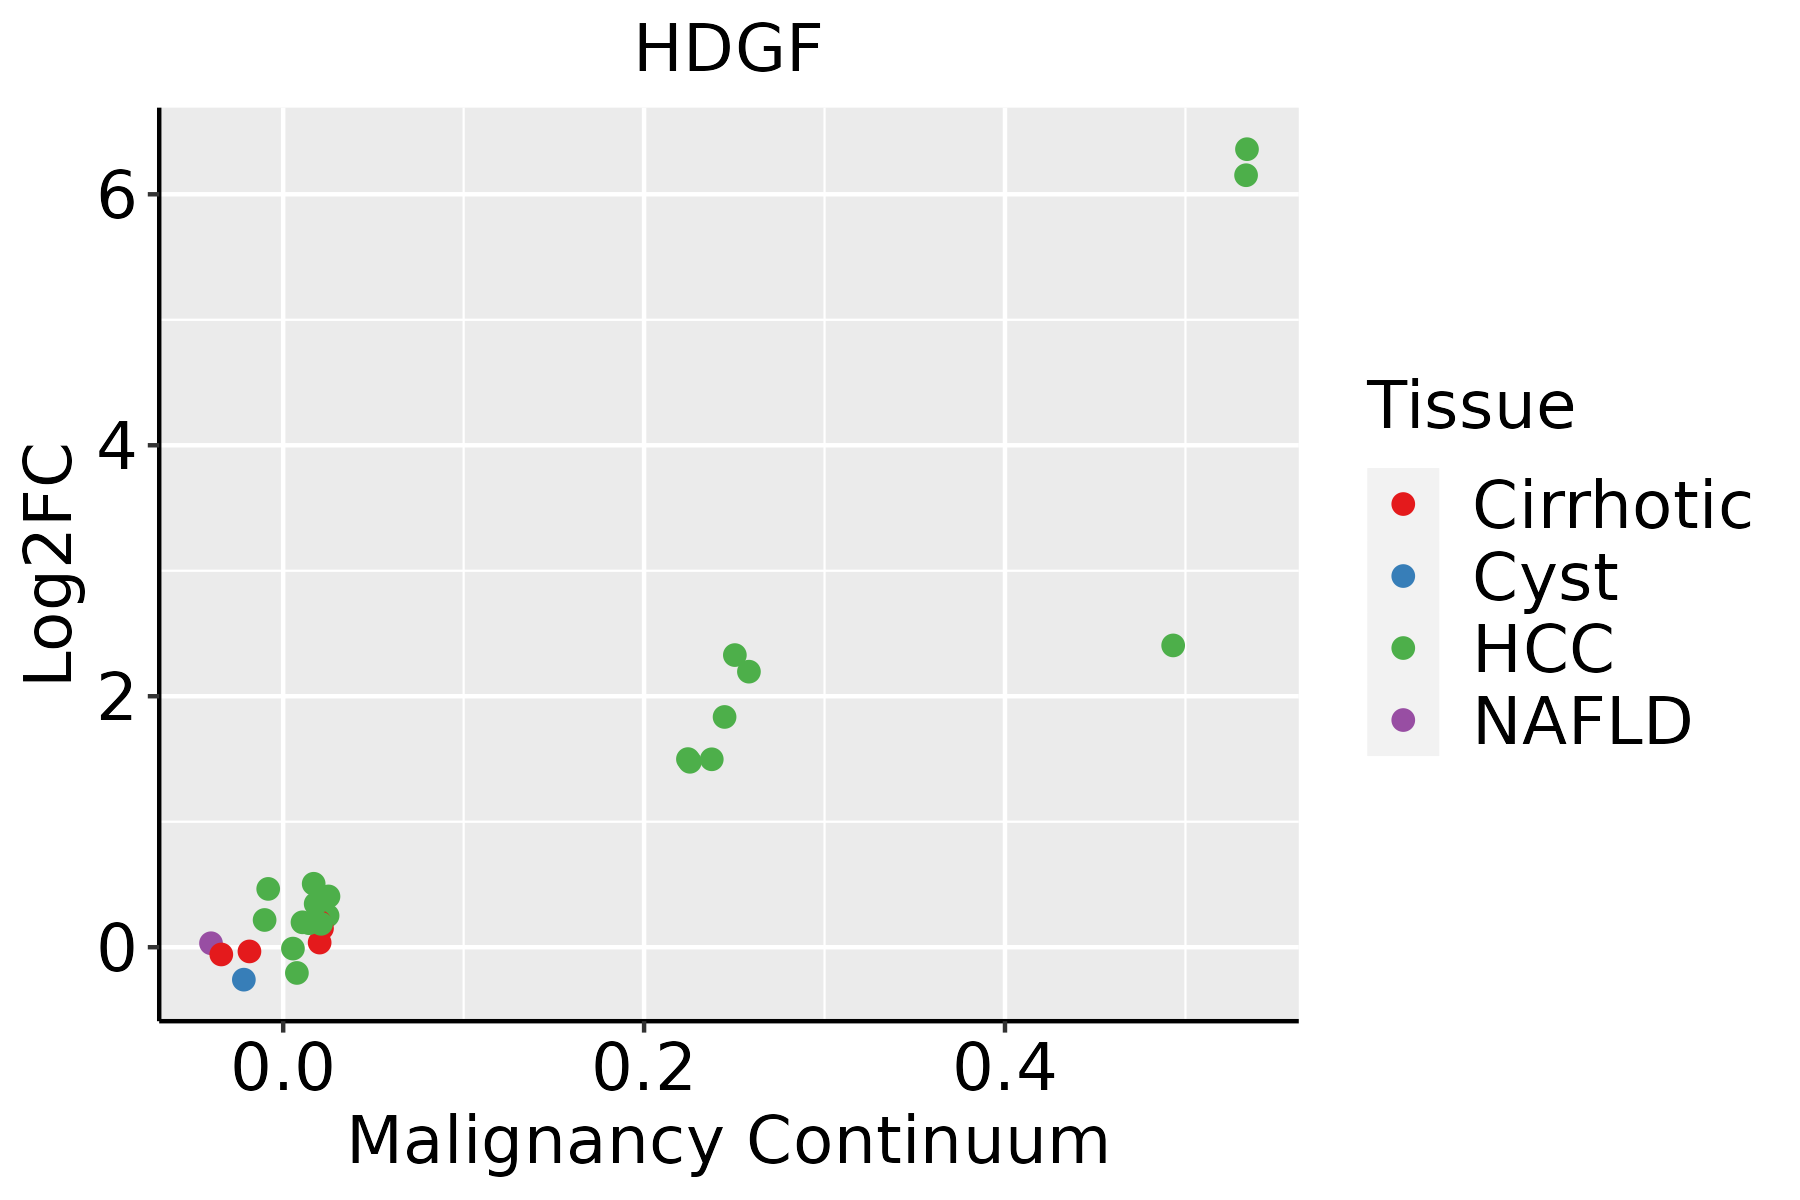
HCC: Hepatocellular carcinoma
NAFLD: Non-alcoholic fatty liver disease
Oral CavityThe image shows the transcriptomic changes along malignancy continuum.log2FC in expression of this searched gene in stem-like cells from each diseased tissue sample relative to stem-like cells in normal samples in each tissue plotted against the malignancy continuum. Samples are colored based on if they are from different disease stage.
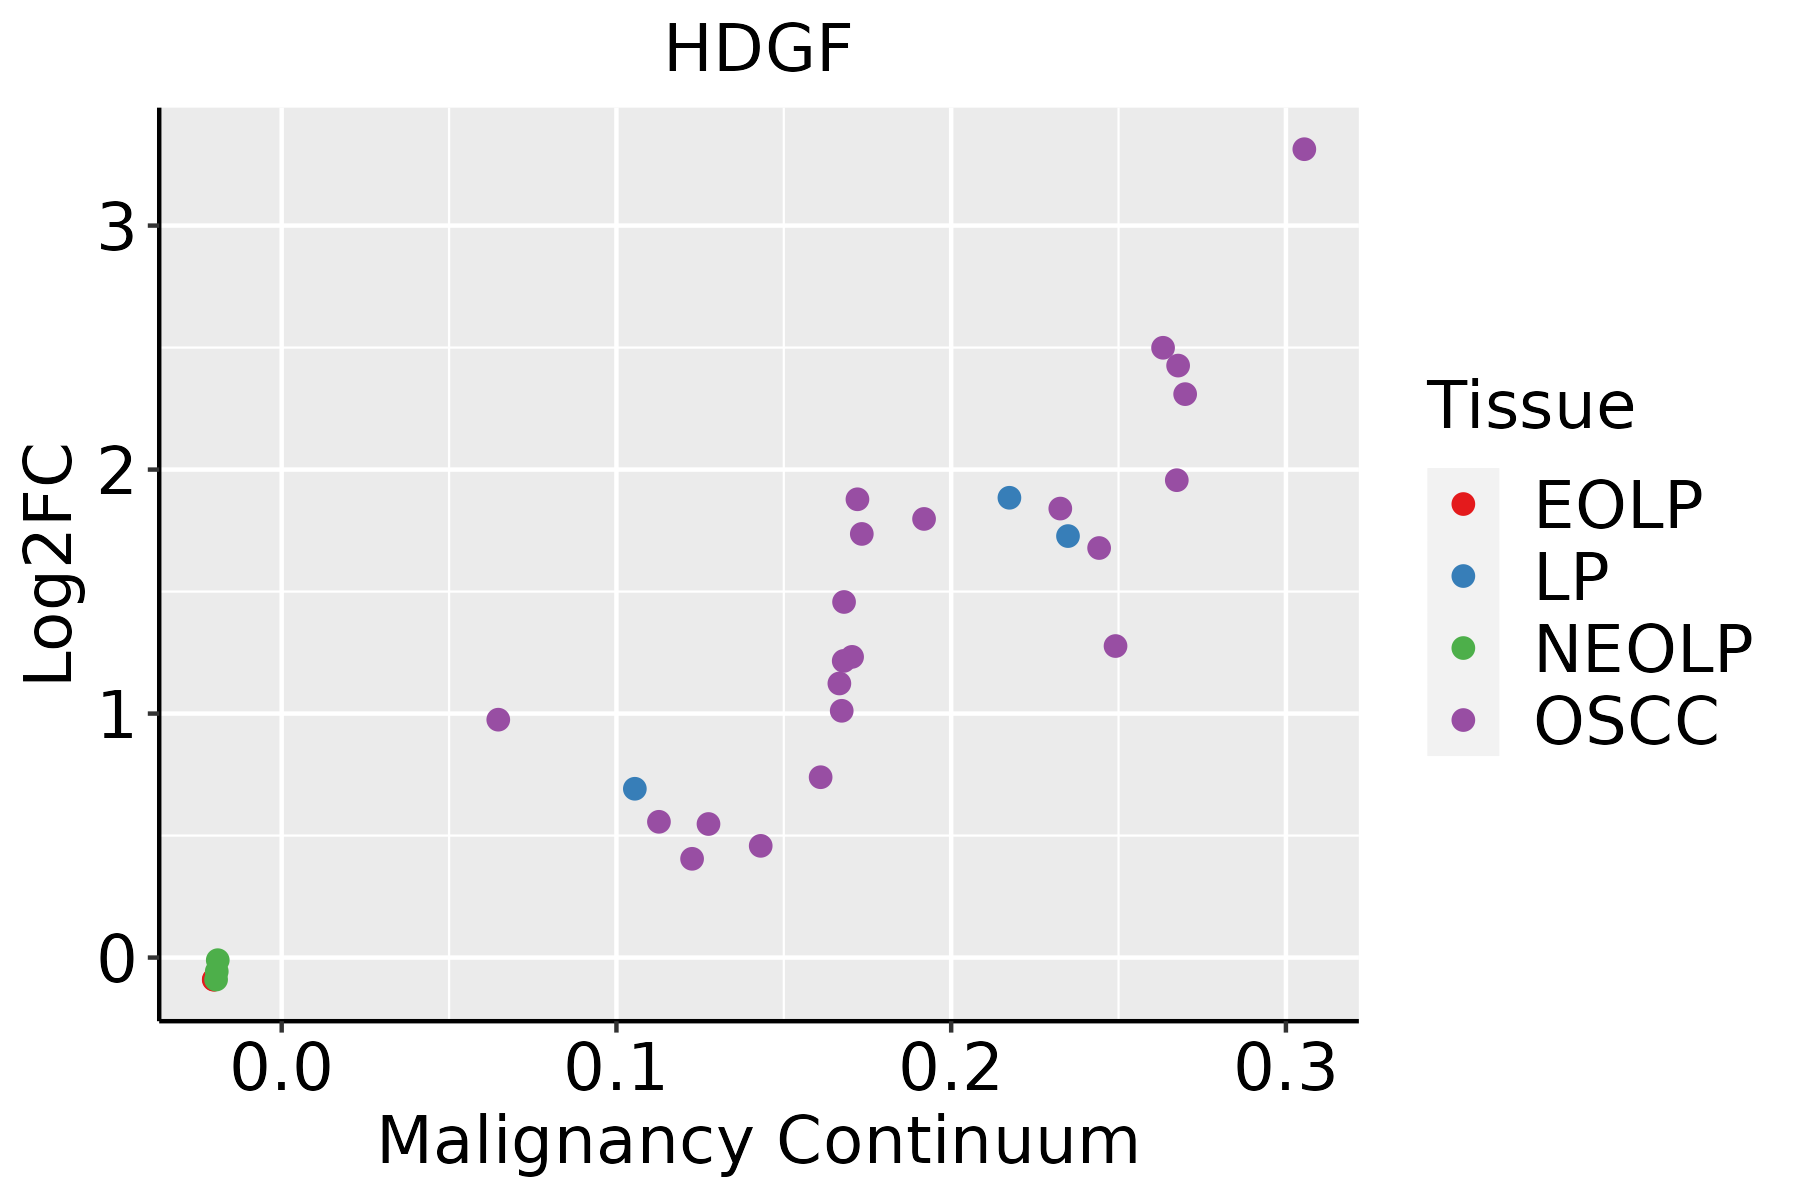
EOLP: Erosive Oral lichen planus
LP: leukoplakia
NEOLP: Non-erosive oral lichen planus
OSCC: Oral squamous cell carcinoma
ProstateThe image shows the transcriptomic changes along malignancy continuum.log2FC in expression of this searched gene in stem-like cells from each diseased tissue sample relative to stem-like cells in normal samples in each tissue plotted against the malignancy continuum. Samples are colored based on if they are from different disease stage.
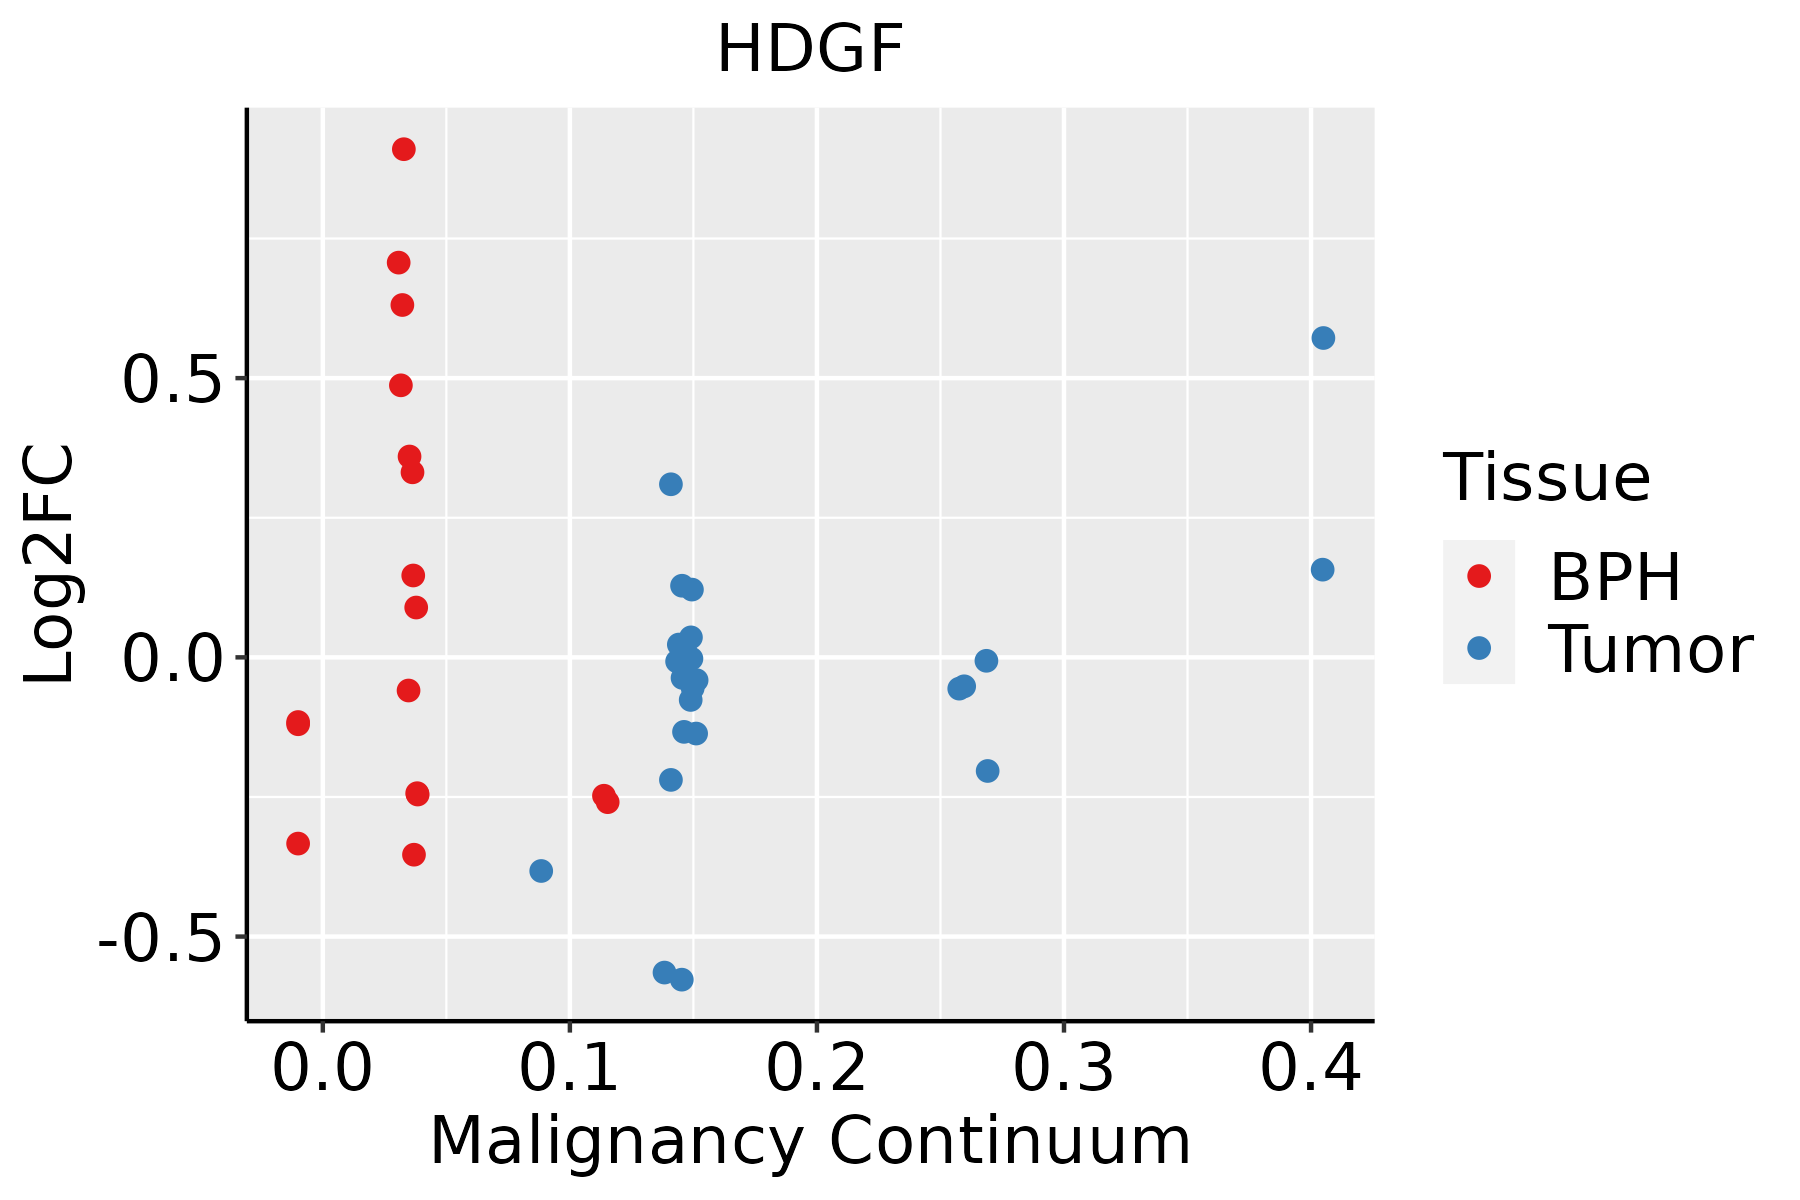
BPH: Benign Prostatic Hyperplasia
SkinThe image shows the transcriptomic changes along malignancy continuum.log2FC in expression of this searched gene in stem-like cells from each diseased tissue sample relative to stem-like cells in normal samples in each tissue plotted against the malignancy continuum. Samples are colored based on if they are from different disease stage.
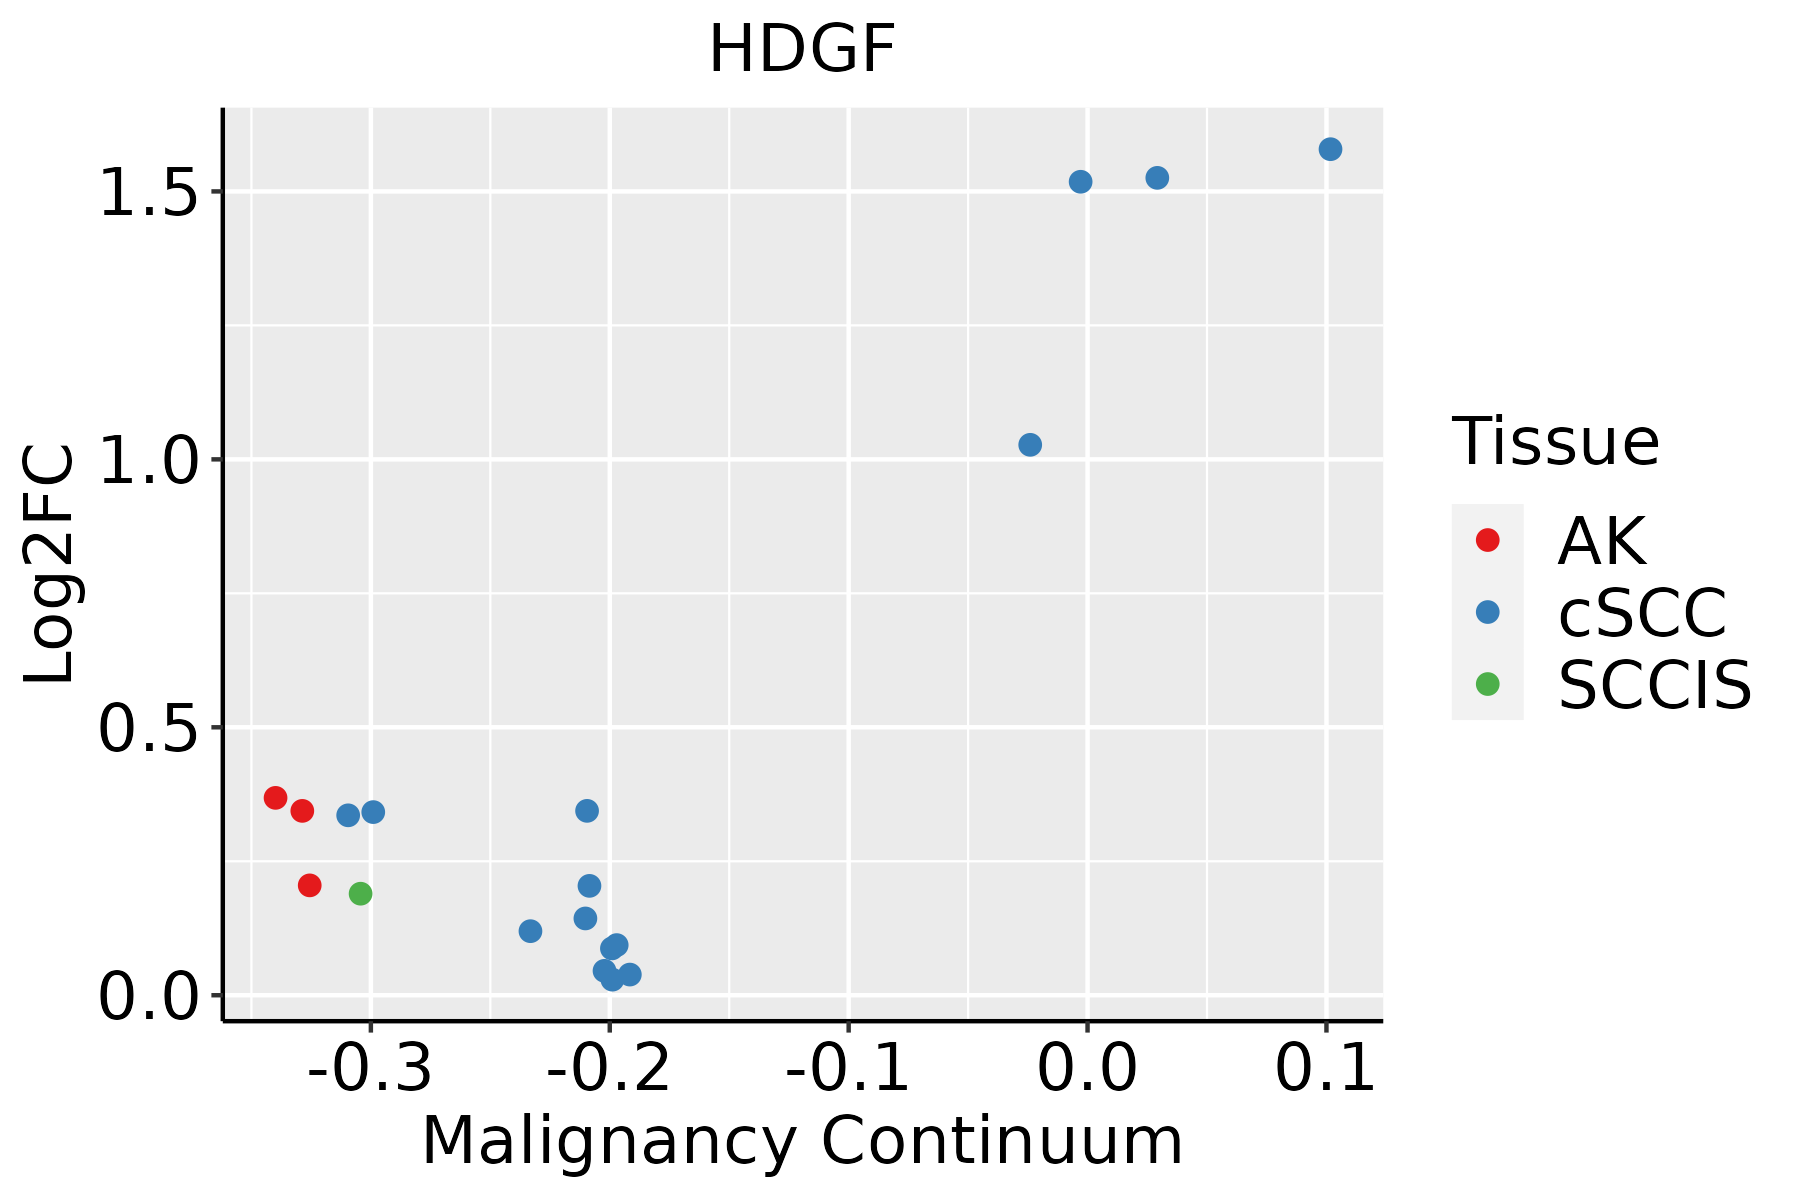
AK: Actinic keratosis
cSCC: Cutaneous squamous cell carcinoma
SCCIS:squamous cell carcinoma in situ
ThyroidThe image shows the transcriptomic changes along malignancy continuum.log2FC in expression of this searched gene in stem-like cells from each diseased tissue sample relative to stem-like cells in normal samples in each tissue plotted against the malignancy continuum. Samples are colored based on if they are from different disease stage.ATC: Anaplastic thyroid cancer
HT: Hashimoto's thyroiditis
PTC: Papillary thyroid cancer
∗log2FC in expression of this searched gene in stem-like cells from each diseased tissue sample relative to stem-like cells in normal samples in each tissue plotted against the malignancy continuum. Samples are colored based on if they are from different disease stage.

Top

Malignant transformation related pathway analysis

check buttonFind out the enriched GO biological processes and KEGG pathways involved in transition from healthy to precancer to cancer
check button Figure of enriched GO biological processes.
TissueDisease StageEnriched GO biological Processes
ColorectumADGO analysis - Figure of enriched GO biological processes: Top 15 enriched GO BP terms are showed in the bar plot of each disease state in each tissue. Each row represents a significant GO biological process which is colored according to the -log10(p.adjust).
ColorectumSERGO analysis - Figure of enriched GO biological processes: Top 15 enriched GO BP terms are showed in the bar plot of each disease state in each tissue. Each row represents a significant GO biological process which is colored according to the -log10(p.adjust).
ColorectumMSSGO analysis - Figure of enriched GO biological processes: Top 15 enriched GO BP terms are showed in the bar plot of each disease state in each tissue. Each row represents a significant GO biological process which is colored according to the -log10(p.adjust).
ColorectumMSI-HGO analysis - Figure of enriched GO biological processes: Top 15 enriched GO BP terms are showed in the bar plot of each disease state in each tissue. Each row represents a significant GO biological process which is colored according to the -log10(p.adjust).
ColorectumFAPGO analysis - Figure of enriched GO biological processes: Top 15 enriched GO BP terms are showed in the bar plot of each disease state in each tissue. Each row represents a significant GO biological process which is colored according to the -log10(p.adjust).
∗Top 15 enriched GO BP terms are showed in the bar plot of each disease state in each tissue. Each row represents a significant GO biological process which is colored according to the -log10(p.adjust).
Page: 1 2 3 4 5 6 7 8 9 

check button Enriched GO biological processes.
GO IDTissueDisease StageDescriptionGene RatioBg Ratiopvaluep.adjustCount
GO:0098760ColorectumADresponse to interleukin-710/391815/187231.68e-042.29e-0310
GO:0098761ColorectumADcellular response to interleukin-710/391815/187231.68e-042.29e-0310
GO:00987601ColorectumSERresponse to interleukin-78/289715/187237.51e-049.68e-038
GO:00987611ColorectumSERcellular response to interleukin-78/289715/187237.51e-049.68e-038
GO:00987602ColorectumMSSresponse to interleukin-710/346715/187235.64e-059.87e-0410
GO:00987612ColorectumMSScellular response to interleukin-710/346715/187235.64e-059.87e-0410
GO:00987603ColorectumMSI-Hresponse to interleukin-78/131915/187232.44e-061.43e-048
GO:00987613ColorectumMSI-Hcellular response to interleukin-78/131915/187232.44e-061.43e-048
GO:00987604ColorectumFAPresponse to interleukin-78/262215/187233.75e-044.63e-038
GO:00987614ColorectumFAPcellular response to interleukin-78/262215/187233.75e-044.63e-038
GO:009876010EndometriumAEHresponse to interleukin-76/210015/187234.03e-032.69e-026
GO:009876110EndometriumAEHcellular response to interleukin-76/210015/187234.03e-032.69e-026
GO:009876014EndometriumEECresponse to interleukin-76/216815/187234.74e-033.00e-026
GO:009876114EndometriumEECcellular response to interleukin-76/216815/187234.74e-033.00e-026
GO:009876019EsophagusHGINresponse to interleukin-78/258715/187233.41e-045.55e-038
GO:009876119EsophagusHGINcellular response to interleukin-78/258715/187233.41e-045.55e-038
GO:0022411111EsophagusESCCcellular component disassembly305/8552443/187231.94e-234.57e-21305
GO:003298416EsophagusESCCprotein-containing complex disassembly151/8552224/187233.45e-111.15e-09151
GO:1902903111EsophagusESCCregulation of supramolecular fiber organization237/8552383/187239.06e-112.75e-09237
GO:0010639110EsophagusESCCnegative regulation of organelle organization215/8552348/187238.20e-102.01e-08215
Page: 1 2 3 4 5 

check button Enriched KEGG pathways.
Pathway IDTissueDisease StageDescriptionGene RatioBg Ratiopvaluep.adjustqvalueCount
Page: 1 

Top

Cell-cell communication analysis

check buttonIdentification of potential cell-cell interactions between two cell types and their ligand-receptor pairs for different disease states
LigandReceptorLRpairPathwayTissueDisease Stage
Page: 1 

Top

Single-cell gene regulatory network inference analysis

check buttonFind out the significant the regulons (TFs) and the target genes of each regulon across cell types for different disease states
TFCell TypeTissueDisease StageTarget GeneRSSRegulon Activity
∗The dot plots of a searched regulon are shown for all cell subpopulations in each disease state of each tissue based on the regulon specific score inferred using pySCENIC and by calculating the average expression.
Page: 1 

Top

Somatic mutation of malignant transformation related genes

check buttonAnnotation of somatic variants for genes involved in malignant transformation
Hugo SymbolVariant ClassVariant ClassificationdbSNP RSHGVScHGVSpHGVSp ShortSWISSPROTBIOTYPESIFTPolyPhenTumor Sample BarcodeTissueHistologySexAgeStageTherapy TypesDrugsOutcome
HDGFSNVMissense_Mutationnovelc.706G>Ap.Glu236Lysp.E236KP51858protein_codingtolerated_low_confidence(0.08)benign(0.074)TCGA-UC-A7PG-06Cervixcervical & endocervical cancerFemale<65III/IVChemotherapycisplatinPD
HDGFSNVMissense_Mutationnovelc.447N>Ap.Ser149Argp.S149RP51858protein_codingdeleterious(0)probably_damaging(0.992)TCGA-VS-A8EI-01Cervixcervical & endocervical cancerFemale<65I/IIChemotherapycisplatinCR
HDGFinsertionNonsense_Mutationnovelc.150_159dupTGAGGCTGCCp.Val54Terp.V54*P51858protein_codingTCGA-FU-A3HZ-01Cervixcervical & endocervical cancerFemale<65I/IIChemotherapycisplatinCR
HDGFSNVMissense_Mutationc.434N>Tp.Ala145Valp.A145VP51858protein_codingdeleterious(0)benign(0.062)TCGA-CK-5916-01Colorectumcolon adenocarcinomaFemale>=65I/IIUnknownUnknownPD
HDGFSNVMissense_Mutationnovelc.569A>Cp.Asn190Thrp.N190TP51858protein_codingtolerated(0.15)benign(0.01)TCGA-CM-5861-01Colorectumcolon adenocarcinomaFemale<65I/IIUnknownUnknownPD
HDGFSNVMissense_Mutationc.212C>Tp.Thr71Metp.T71MP51858protein_codingdeleterious(0)probably_damaging(0.999)TCGA-DM-A1HB-01Colorectumcolon adenocarcinomaMale>=65III/IVUnknownUnknownSD
HDGFinsertionFrame_Shift_Insnovelc.197_198insTp.Gly67ArgfsTer63p.G67Rfs*63P51858protein_codingTCGA-CM-6171-01Colorectumcolon adenocarcinomaFemale>=65I/IIUnknownUnknownSD
HDGFSNVMissense_Mutationnovelc.745N>Tp.Gly249Cysp.G249CP51858protein_codingdeleterious_low_confidence(0)probably_damaging(0.999)TCGA-A5-A0G2-01Endometriumuterine corpus endometrioid carcinomaFemale<65III/IVUnknownUnknownSD
HDGFSNVMissense_Mutationnovelc.461N>Gp.Lys154Argp.K154RP51858protein_codingtolerated(0.05)possibly_damaging(0.702)TCGA-AJ-A8CT-01Endometriumuterine corpus endometrioid carcinomaFemale<65I/IIUnknownUnknownSD
HDGFSNVMissense_Mutationc.106N>Tp.Pro36Serp.P36SP51858protein_codingtolerated_low_confidence(0.96)benign(0)TCGA-AP-A0LM-01Endometriumuterine corpus endometrioid carcinomaFemale<65III/IVChemotherapycisplatinSD
Page: 1 2 3 4 

Top

Related drugs of malignant transformation related genes

check buttonIdentification of chemicals and drugs interact with genes involved in malignant transfromation
(DGIdb 4.0)
Entrez IDSymbolCategoryInteraction TypesDrug Claim NameDrug NamePMIDs
3068HDGFDRUGGABLE GENOME, GROWTH FACTORPROTEIN KINASE C INHIBITOR11149024
Page: 1