
|
|||||
|
 | |
| |
| |
| |
| |
| |
|
Gene: HDDC3 |
Gene summary for HDDC3 |
| Gene information | Species | Human | Gene symbol | HDDC3 | Gene ID | 374659 |
| Gene name | HD domain containing 3 | |
| Gene Alias | (ppGpp)ase | |
| Cytomap | 15q26.1 | |
| Gene Type | protein-coding | GO ID | GO:0003674 | UniProtAcc | Q8N4P3 |
Top |
Malignant transformation analysis |
| Identification of the aberrant gene expression in precancerous and cancerous lesions by comparing the gene expression of stem-like cells in diseased tissues with normal stem cells |
| Entrez ID | Symbol | Replicates | Species | Organ | Tissue | Adj P-value | Log2FC | Malignancy |
| 374659 | HDDC3 | LZE4T | Human | Esophagus | ESCC | 2.23e-04 | 2.24e-01 | 0.0811 |
| 374659 | HDDC3 | LZE7T | Human | Esophagus | ESCC | 3.17e-04 | 3.78e-01 | 0.0667 |
| 374659 | HDDC3 | LZE8T | Human | Esophagus | ESCC | 4.91e-04 | 1.96e-01 | 0.067 |
| 374659 | HDDC3 | LZE24T | Human | Esophagus | ESCC | 7.11e-10 | 3.54e-01 | 0.0596 |
| 374659 | HDDC3 | P1T-E | Human | Esophagus | ESCC | 1.84e-05 | 3.28e-01 | 0.0875 |
| 374659 | HDDC3 | P2T-E | Human | Esophagus | ESCC | 9.80e-16 | 3.19e-01 | 0.1177 |
| 374659 | HDDC3 | P4T-E | Human | Esophagus | ESCC | 9.45e-35 | 7.53e-01 | 0.1323 |
| 374659 | HDDC3 | P5T-E | Human | Esophagus | ESCC | 1.10e-23 | 4.78e-01 | 0.1327 |
| 374659 | HDDC3 | P8T-E | Human | Esophagus | ESCC | 1.01e-15 | 3.17e-01 | 0.0889 |
| 374659 | HDDC3 | P9T-E | Human | Esophagus | ESCC | 4.00e-14 | 3.19e-01 | 0.1131 |
| 374659 | HDDC3 | P10T-E | Human | Esophagus | ESCC | 3.17e-19 | 3.40e-01 | 0.116 |
| 374659 | HDDC3 | P11T-E | Human | Esophagus | ESCC | 2.94e-03 | 2.00e-01 | 0.1426 |
| 374659 | HDDC3 | P12T-E | Human | Esophagus | ESCC | 2.07e-23 | 4.13e-01 | 0.1122 |
| 374659 | HDDC3 | P15T-E | Human | Esophagus | ESCC | 3.45e-16 | 3.64e-01 | 0.1149 |
| 374659 | HDDC3 | P16T-E | Human | Esophagus | ESCC | 1.76e-22 | 4.08e-01 | 0.1153 |
| 374659 | HDDC3 | P17T-E | Human | Esophagus | ESCC | 2.36e-03 | 2.01e-01 | 0.1278 |
| 374659 | HDDC3 | P19T-E | Human | Esophagus | ESCC | 3.72e-09 | 8.20e-01 | 0.1662 |
| 374659 | HDDC3 | P20T-E | Human | Esophagus | ESCC | 9.79e-09 | 2.25e-01 | 0.1124 |
| 374659 | HDDC3 | P21T-E | Human | Esophagus | ESCC | 8.83e-10 | 1.77e-01 | 0.1617 |
| 374659 | HDDC3 | P22T-E | Human | Esophagus | ESCC | 3.01e-34 | 6.10e-01 | 0.1236 |
| Page: 1 2 3 4 5 |
| Tissue | Expression Dynamics | Abbreviation |
| Esophagus | 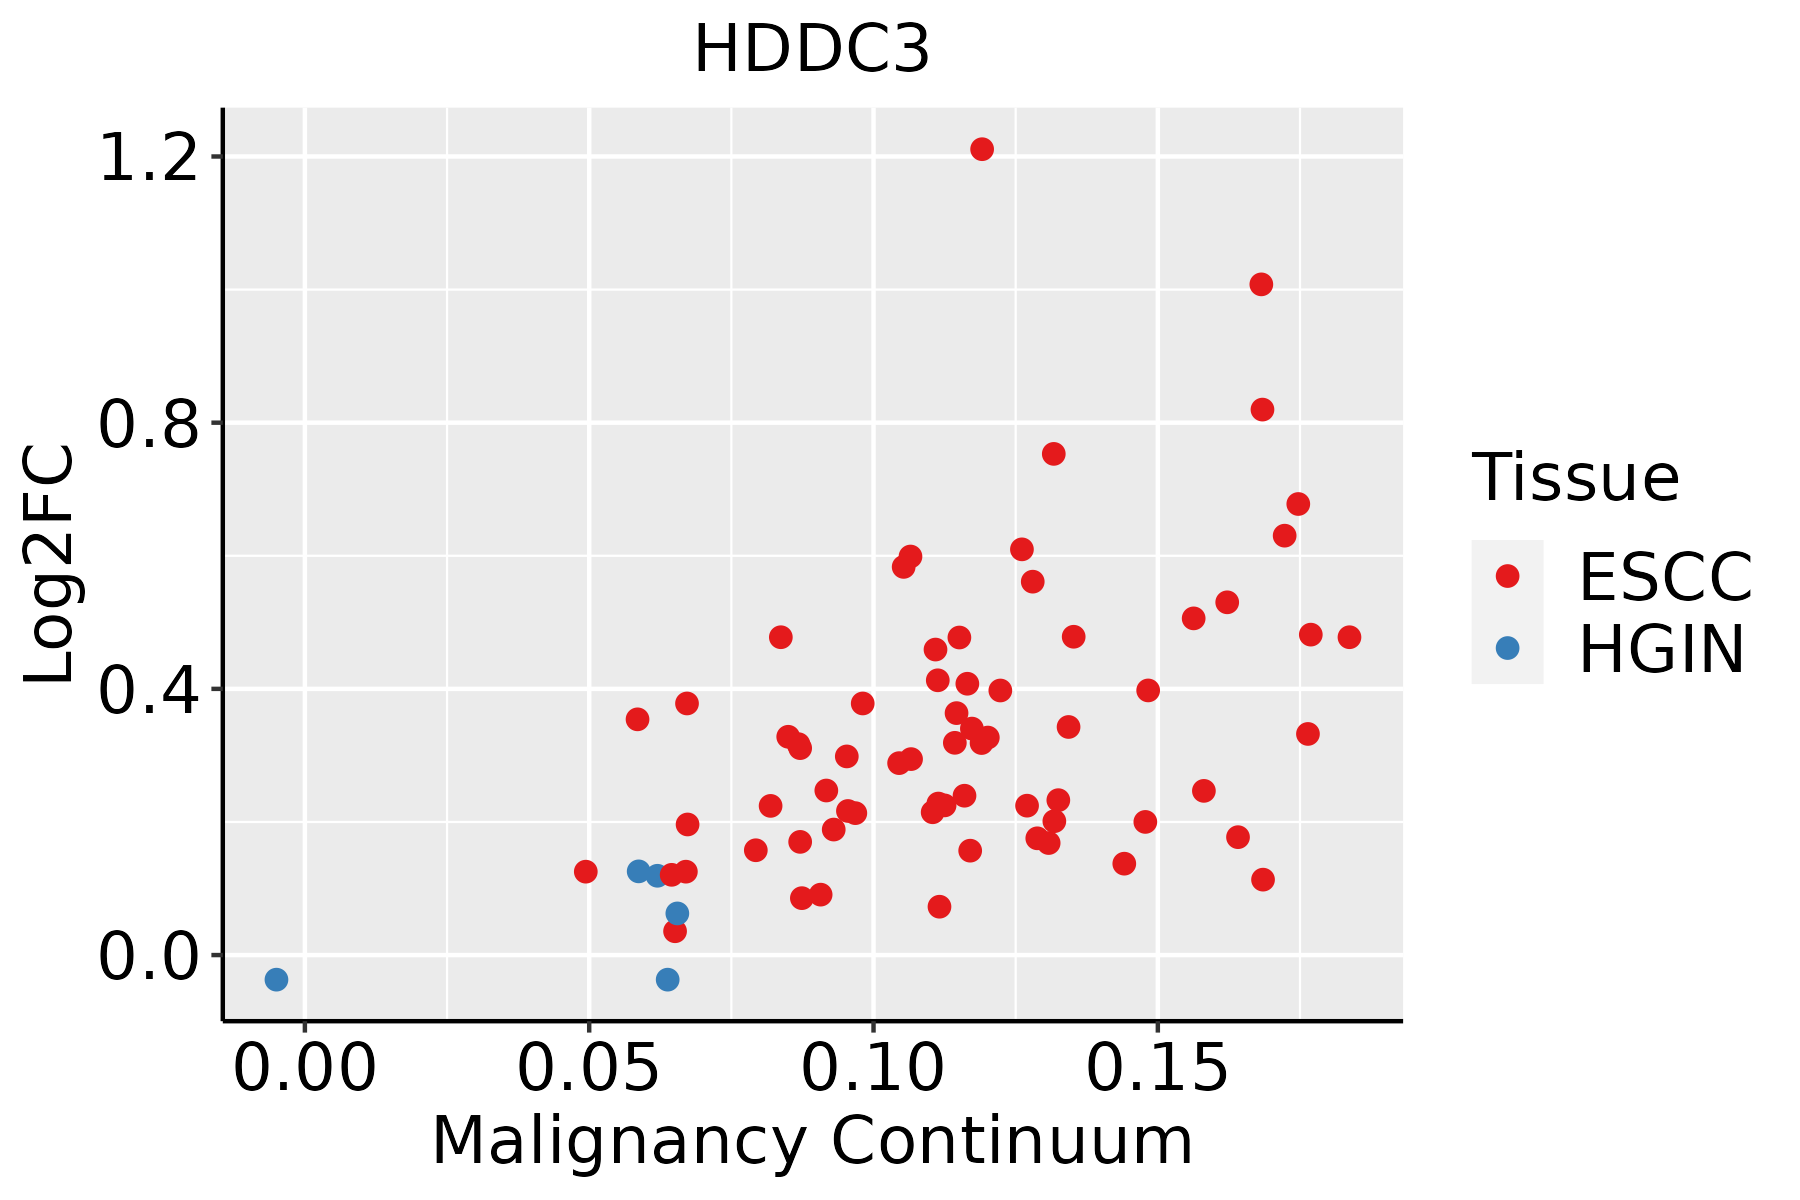 | ESCC: Esophageal squamous cell carcinoma |
| HGIN: High-grade intraepithelial neoplasias | ||
| LGIN: Low-grade intraepithelial neoplasias | ||
| Liver | 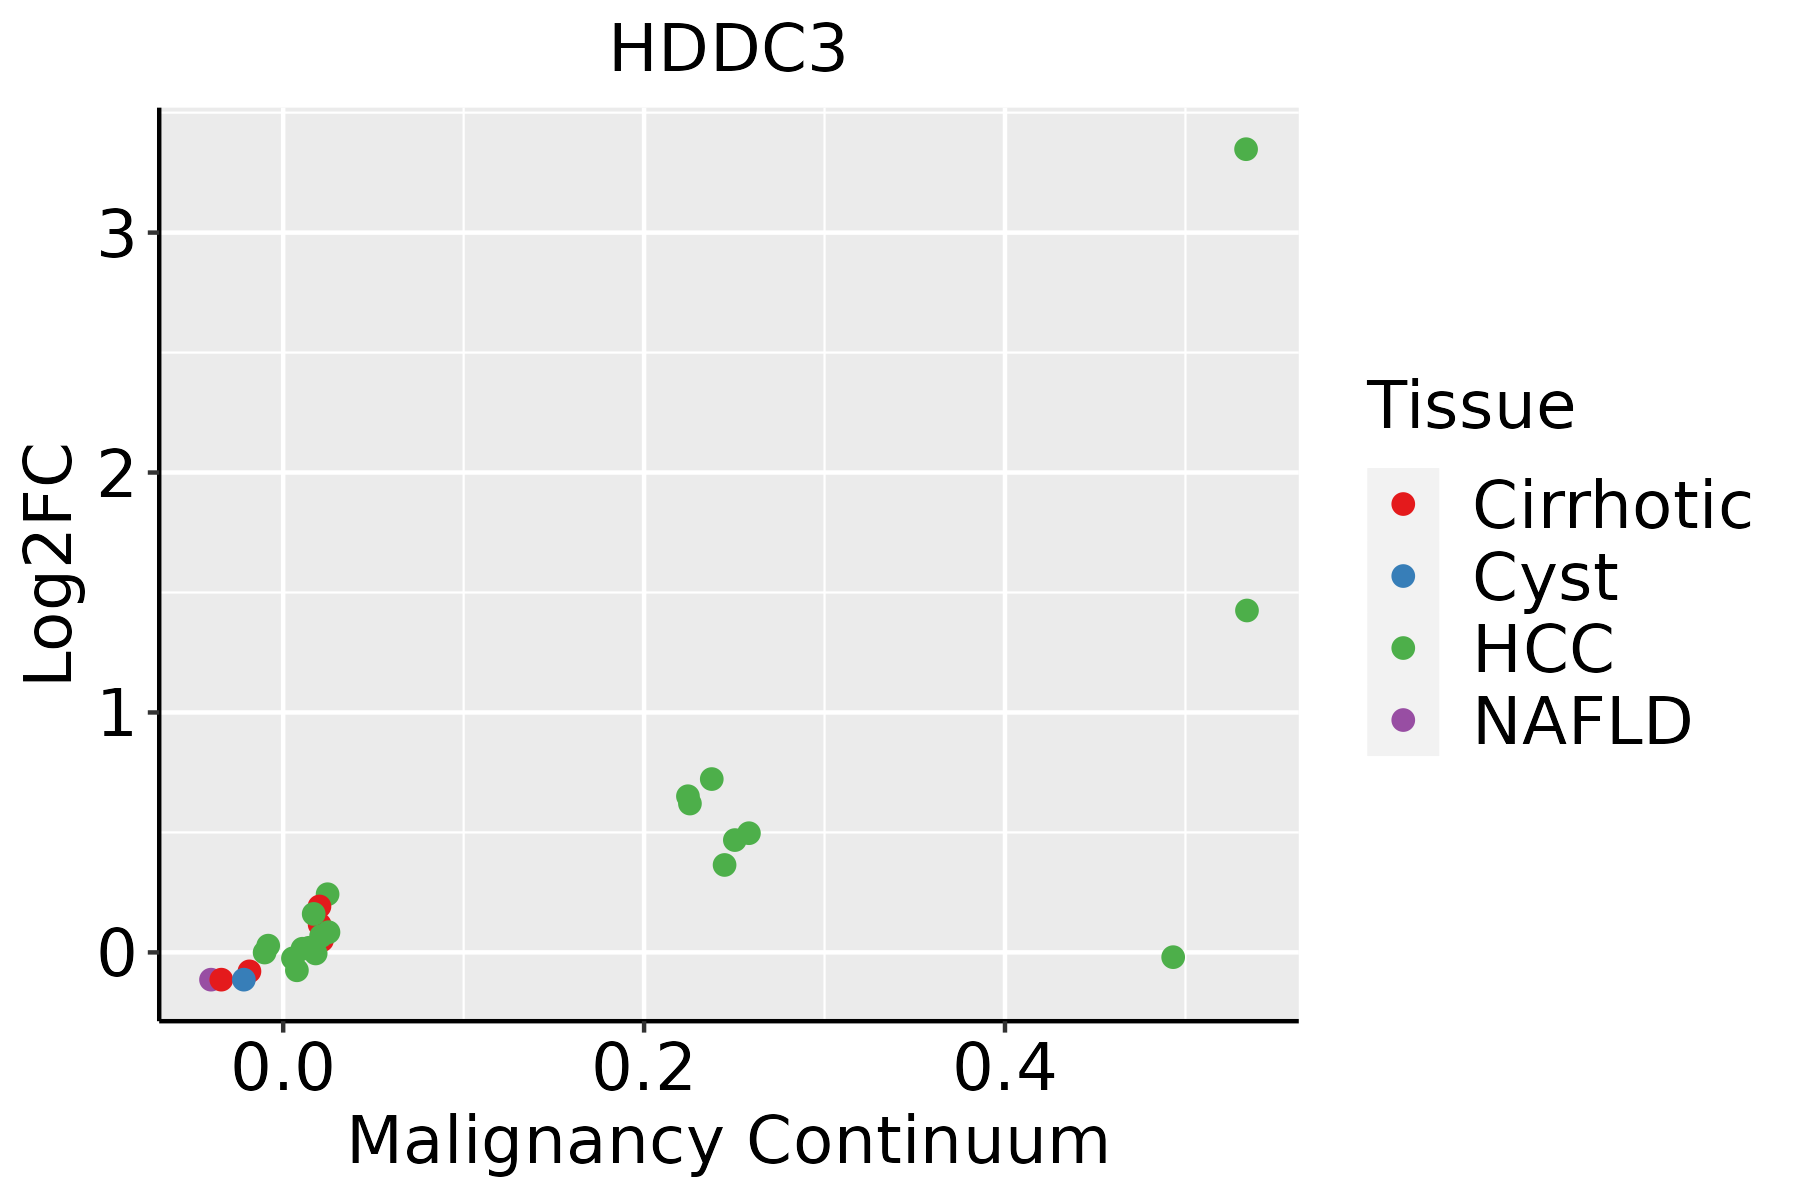 | HCC: Hepatocellular carcinoma |
| NAFLD: Non-alcoholic fatty liver disease | ||
| Oral Cavity | 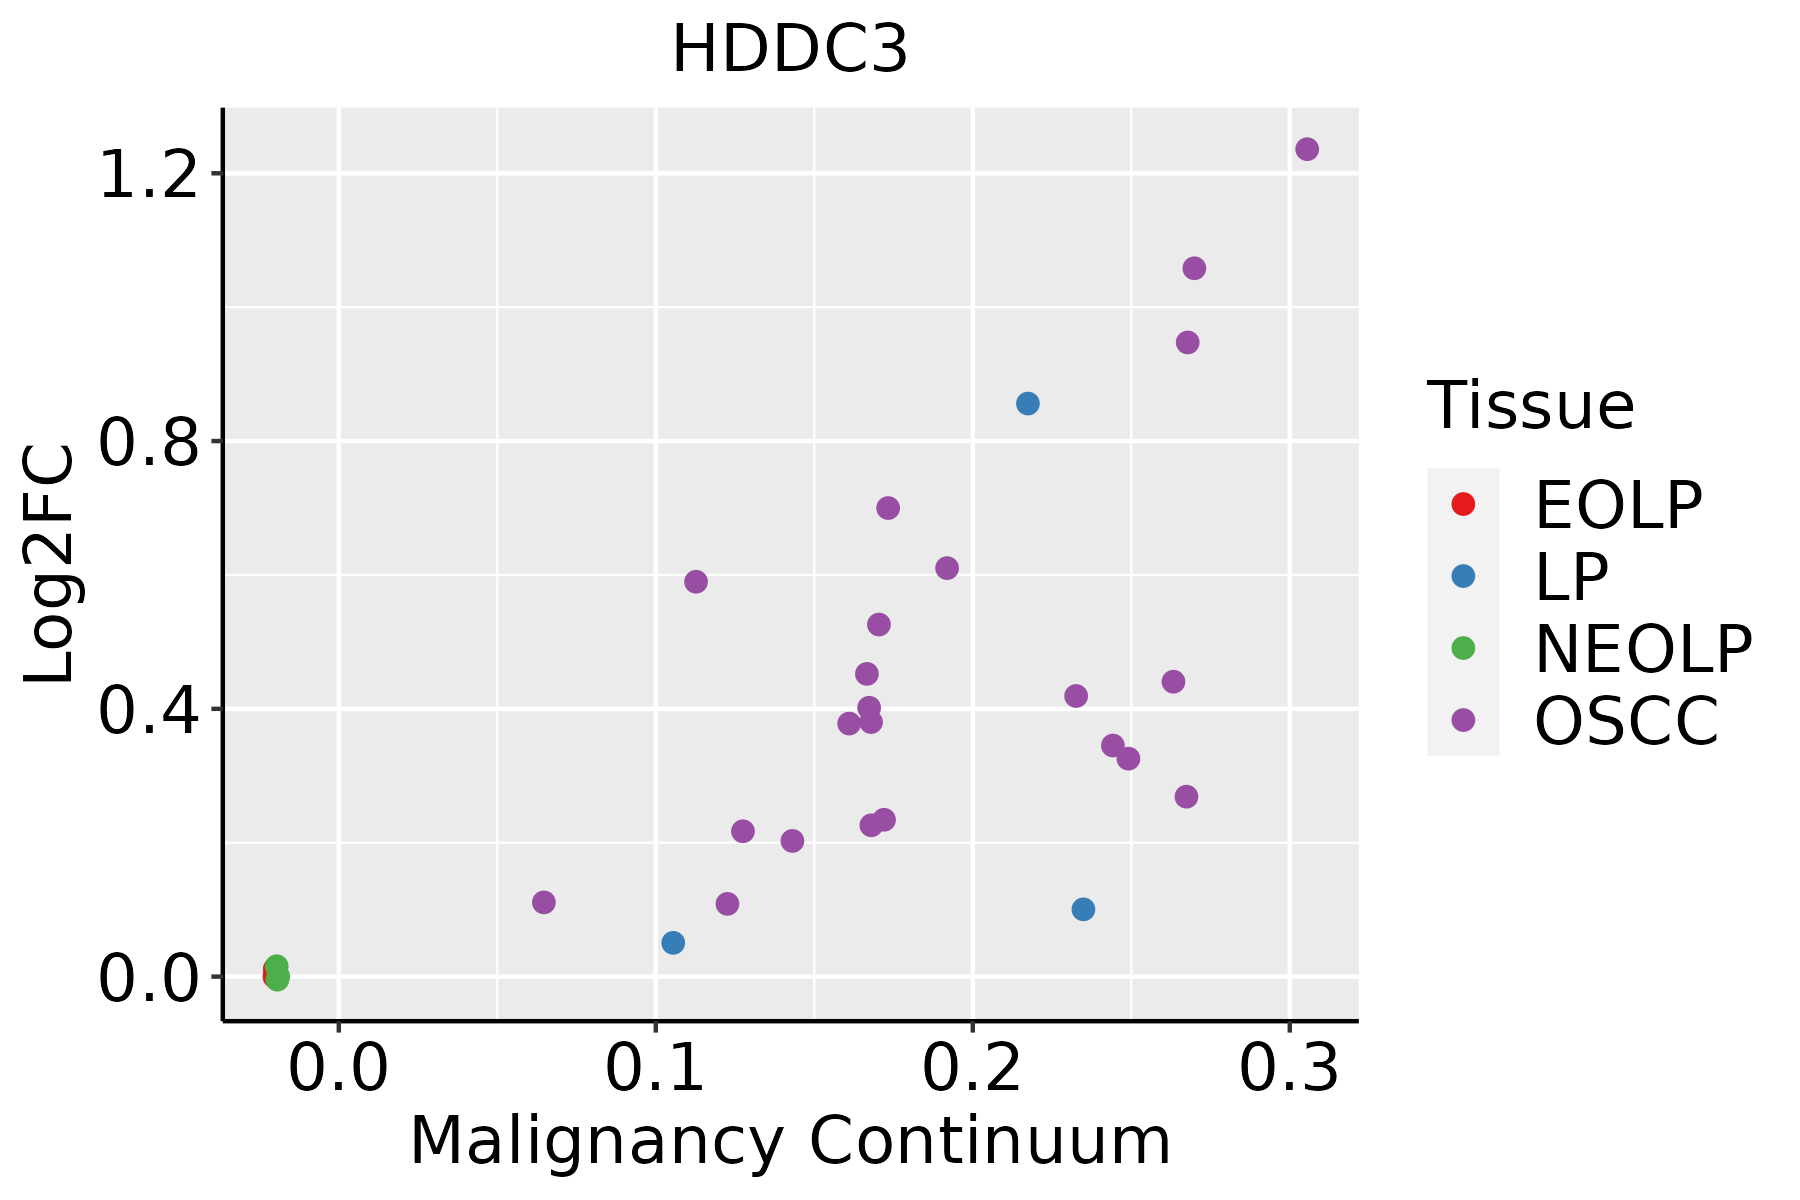 | EOLP: Erosive Oral lichen planus |
| LP: leukoplakia | ||
| NEOLP: Non-erosive oral lichen planus | ||
| OSCC: Oral squamous cell carcinoma |
| ∗log2FC in expression of this searched gene in stem-like cells from each diseased tissue sample relative to stem-like cells in normal samples in each tissue plotted against the malignancy continuum. Samples are colored based on if they are from different disease stage. |
Top |
Malignant transformation related pathway analysis |
| Find out the enriched GO biological processes and KEGG pathways involved in transition from healthy to precancer to cancer |
| Tissue | Disease Stage | Enriched GO biological Processes |
| Colorectum | AD |  |
| Colorectum | SER |  |
| Colorectum | MSS |  |
| Colorectum | MSI-H |  |
| Colorectum | FAP |  |
| ∗Top 15 enriched GO BP terms are showed in the bar plot of each disease state in each tissue. Each row represents a significant GO biological process which is colored according to the -log10(p.adjust). |
| Page: 1 2 3 4 5 6 7 8 9 |
| GO ID | Tissue | Disease Stage | Description | Gene Ratio | Bg Ratio | pvalue | p.adjust | Count |
| Page: 1 |
| Pathway ID | Tissue | Disease Stage | Description | Gene Ratio | Bg Ratio | pvalue | p.adjust | qvalue | Count |
| Page: 1 |
Top |
Cell-cell communication analysis |
| Identification of potential cell-cell interactions between two cell types and their ligand-receptor pairs for different disease states |
| Ligand | Receptor | LRpair | Pathway | Tissue | Disease Stage |
| Page: 1 |
Top |
Single-cell gene regulatory network inference analysis |
| Find out the significant the regulons (TFs) and the target genes of each regulon across cell types for different disease states |
| TF | Cell Type | Tissue | Disease Stage | Target Gene | RSS | Regulon Activity |
| ∗The dot plots of a searched regulon are shown for all cell subpopulations in each disease state of each tissue based on the regulon specific score inferred using pySCENIC and by calculating the average expression. |
| Page: 1 |
Top |
Somatic mutation of malignant transformation related genes |
| Annotation of somatic variants for genes involved in malignant transformation |
| Hugo Symbol | Variant Class | Variant Classification | dbSNP RS | HGVSc | HGVSp | HGVSp Short | SWISSPROT | BIOTYPE | SIFT | PolyPhen | Tumor Sample Barcode | Tissue | Histology | Sex | Age | Stage | Therapy Types | Drugs | Outcome |
| HDDC3 | SNV | Missense_Mutation | c.217G>A | p.Glu73Lys | p.E73K | Q8N4P3 | protein_coding | deleterious(0) | probably_damaging(0.985) | TCGA-GM-A2D9-01 | Breast | breast invasive carcinoma | Female | >=65 | I/II | Hormone Therapy | arimidex | SD | |
| HDDC3 | insertion | Frame_Shift_Ins | novel | c.137_138insAGGGAGTGCCGCCCGCTTACTGACAACCACTGCT | p.Ala47GlyfsTer16 | p.A47Gfs*16 | Q8N4P3 | protein_coding | TCGA-A8-A0A1-01 | Breast | breast invasive carcinoma | Female | >=65 | I/II | Hormone Therapy | tamoxiphen | SD | ||
| HDDC3 | insertion | In_Frame_Ins | novel | c.323_324insTTTCCATCATCTCAGAAGAAAGTTCTTCCATCTCTTCTTTGACTATGG | p.Ala108_Pro109insPheHisHisLeuArgArgLysPhePheHisLeuPhePheAspTyrGly | p.A108_P109insFHHLRRKFFHLFFDYG | Q8N4P3 | protein_coding | TCGA-AN-A0FX-01 | Breast | breast invasive carcinoma | Female | <65 | I/II | Unknown | Unknown | SD | ||
| HDDC3 | SNV | Missense_Mutation | novel | c.343N>A | p.Ala115Thr | p.A115T | Q8N4P3 | protein_coding | deleterious(0.01) | possibly_damaging(0.615) | TCGA-2W-A8YY-01 | Cervix | cervical & endocervical cancer | Female | <65 | I/II | Chemotherapy | cisplatin | CR |
| HDDC3 | SNV | Missense_Mutation | rs748980570 | c.485N>A | p.Arg162Gln | p.R162Q | Q8N4P3 | protein_coding | tolerated(0.54) | benign(0) | TCGA-AA-3947-01 | Colorectum | colon adenocarcinoma | Female | <65 | I/II | Unknown | Unknown | SD |
| HDDC3 | deletion | Frame_Shift_Del | c.297_300delGAGA | p.Lys101GlyfsTer17 | p.K101Gfs*17 | Q8N4P3 | protein_coding | TCGA-AA-3672-01 | Colorectum | colon adenocarcinoma | Female | >=65 | III/IV | Unknown | Unknown | SD | |||
| HDDC3 | SNV | Missense_Mutation | novel | c.280A>G | p.Thr94Ala | p.T94A | Q8N4P3 | protein_coding | tolerated(0.19) | benign(0.001) | TCGA-AX-A1CE-01 | Endometrium | uterine corpus endometrioid carcinoma | Female | <65 | I/II | Unspecific | Paclitaxel | SD |
| HDDC3 | SNV | Missense_Mutation | c.304N>G | p.Arg102Gly | p.R102G | Q8N4P3 | protein_coding | deleterious(0) | possibly_damaging(0.462) | TCGA-BS-A0UJ-01 | Endometrium | uterine corpus endometrioid carcinoma | Female | >=65 | I/II | Unknown | Unknown | SD | |
| HDDC3 | SNV | Missense_Mutation | novel | c.280N>G | p.Thr94Ala | p.T94A | Q8N4P3 | protein_coding | tolerated(0.19) | benign(0.001) | TCGA-D1-A101-01 | Endometrium | uterine corpus endometrioid carcinoma | Female | <65 | I/II | Unknown | Unknown | SD |
| HDDC3 | SNV | Missense_Mutation | c.275N>G | p.Asp92Gly | p.D92G | Q8N4P3 | protein_coding | deleterious(0) | probably_damaging(0.96) | TCGA-D1-A16Y-01 | Endometrium | uterine corpus endometrioid carcinoma | Female | <65 | I/II | Unknown | Unknown | SD |
| Page: 1 2 |
Top |
Related drugs of malignant transformation related genes |
| Identification of chemicals and drugs interact with genes involved in malignant transfromation |
| (DGIdb 4.0) |
| Entrez ID | Symbol | Category | Interaction Types | Drug Claim Name | Drug Name | PMIDs |
| Page: 1 |

Copyright 2023-Present -The University of Texas Health Science Center at Houston |