
|
|||||
|
 | |
| |
| |
| |
| |
| |
|
Gene: HDDC2 |
Gene summary for HDDC2 |
| Gene information | Species | Human | Gene symbol | HDDC2 | Gene ID | 51020 |
| Gene name | HD domain containing 2 | |
| Gene Alias | C6orf74 | |
| Cytomap | 6q22.31 | |
| Gene Type | protein-coding | GO ID | GO:0006793 | UniProtAcc | A0A140VJK7 |
Top |
Malignant transformation analysis |
| Identification of the aberrant gene expression in precancerous and cancerous lesions by comparing the gene expression of stem-like cells in diseased tissues with normal stem cells |
| Entrez ID | Symbol | Replicates | Species | Organ | Tissue | Adj P-value | Log2FC | Malignancy |
| 51020 | HDDC2 | HTA11_347_2000001011 | Human | Colorectum | AD | 6.62e-03 | 2.13e-01 | -0.1954 |
| 51020 | HDDC2 | LZE4T | Human | Esophagus | ESCC | 9.63e-17 | 4.77e-01 | 0.0811 |
| 51020 | HDDC2 | LZE7T | Human | Esophagus | ESCC | 1.45e-06 | 8.01e-01 | 0.0667 |
| 51020 | HDDC2 | LZE8T | Human | Esophagus | ESCC | 9.16e-05 | 3.67e-01 | 0.067 |
| 51020 | HDDC2 | LZE20T | Human | Esophagus | ESCC | 1.60e-02 | 1.01e-01 | 0.0662 |
| 51020 | HDDC2 | LZE21D1 | Human | Esophagus | HGIN | 1.30e-02 | 2.55e-01 | 0.0632 |
| 51020 | HDDC2 | LZE22T | Human | Esophagus | ESCC | 8.07e-03 | 5.57e-01 | 0.068 |
| 51020 | HDDC2 | LZE24T | Human | Esophagus | ESCC | 5.80e-11 | 5.10e-01 | 0.0596 |
| 51020 | HDDC2 | LZE21T | Human | Esophagus | ESCC | 1.31e-04 | 3.43e-01 | 0.0655 |
| 51020 | HDDC2 | LZE6T | Human | Esophagus | ESCC | 3.25e-09 | 6.46e-01 | 0.0845 |
| 51020 | HDDC2 | P1T-E | Human | Esophagus | ESCC | 3.85e-06 | 3.68e-01 | 0.0875 |
| 51020 | HDDC2 | P2T-E | Human | Esophagus | ESCC | 1.14e-47 | 9.80e-01 | 0.1177 |
| 51020 | HDDC2 | P4T-E | Human | Esophagus | ESCC | 1.37e-42 | 1.14e+00 | 0.1323 |
| 51020 | HDDC2 | P5T-E | Human | Esophagus | ESCC | 7.85e-27 | 6.59e-01 | 0.1327 |
| 51020 | HDDC2 | P8T-E | Human | Esophagus | ESCC | 5.62e-32 | 5.41e-01 | 0.0889 |
| 51020 | HDDC2 | P9T-E | Human | Esophagus | ESCC | 7.38e-26 | 6.63e-01 | 0.1131 |
| 51020 | HDDC2 | P10T-E | Human | Esophagus | ESCC | 2.77e-38 | 7.92e-01 | 0.116 |
| 51020 | HDDC2 | P11T-E | Human | Esophagus | ESCC | 1.32e-13 | 6.15e-01 | 0.1426 |
| 51020 | HDDC2 | P12T-E | Human | Esophagus | ESCC | 2.27e-43 | 7.70e-01 | 0.1122 |
| 51020 | HDDC2 | P15T-E | Human | Esophagus | ESCC | 2.54e-46 | 9.87e-01 | 0.1149 |
| Page: 1 2 3 4 5 6 7 |
| Tissue | Expression Dynamics | Abbreviation |
| Colorectum (GSE201348) |  | FAP: Familial adenomatous polyposis |
| CRC: Colorectal cancer | ||
| Colorectum (HTA11) |  | AD: Adenomas |
| SER: Sessile serrated lesions | ||
| MSI-H: Microsatellite-high colorectal cancer | ||
| MSS: Microsatellite stable colorectal cancer | ||
| Esophagus |  | ESCC: Esophageal squamous cell carcinoma |
| HGIN: High-grade intraepithelial neoplasias | ||
| LGIN: Low-grade intraepithelial neoplasias | ||
| Liver | 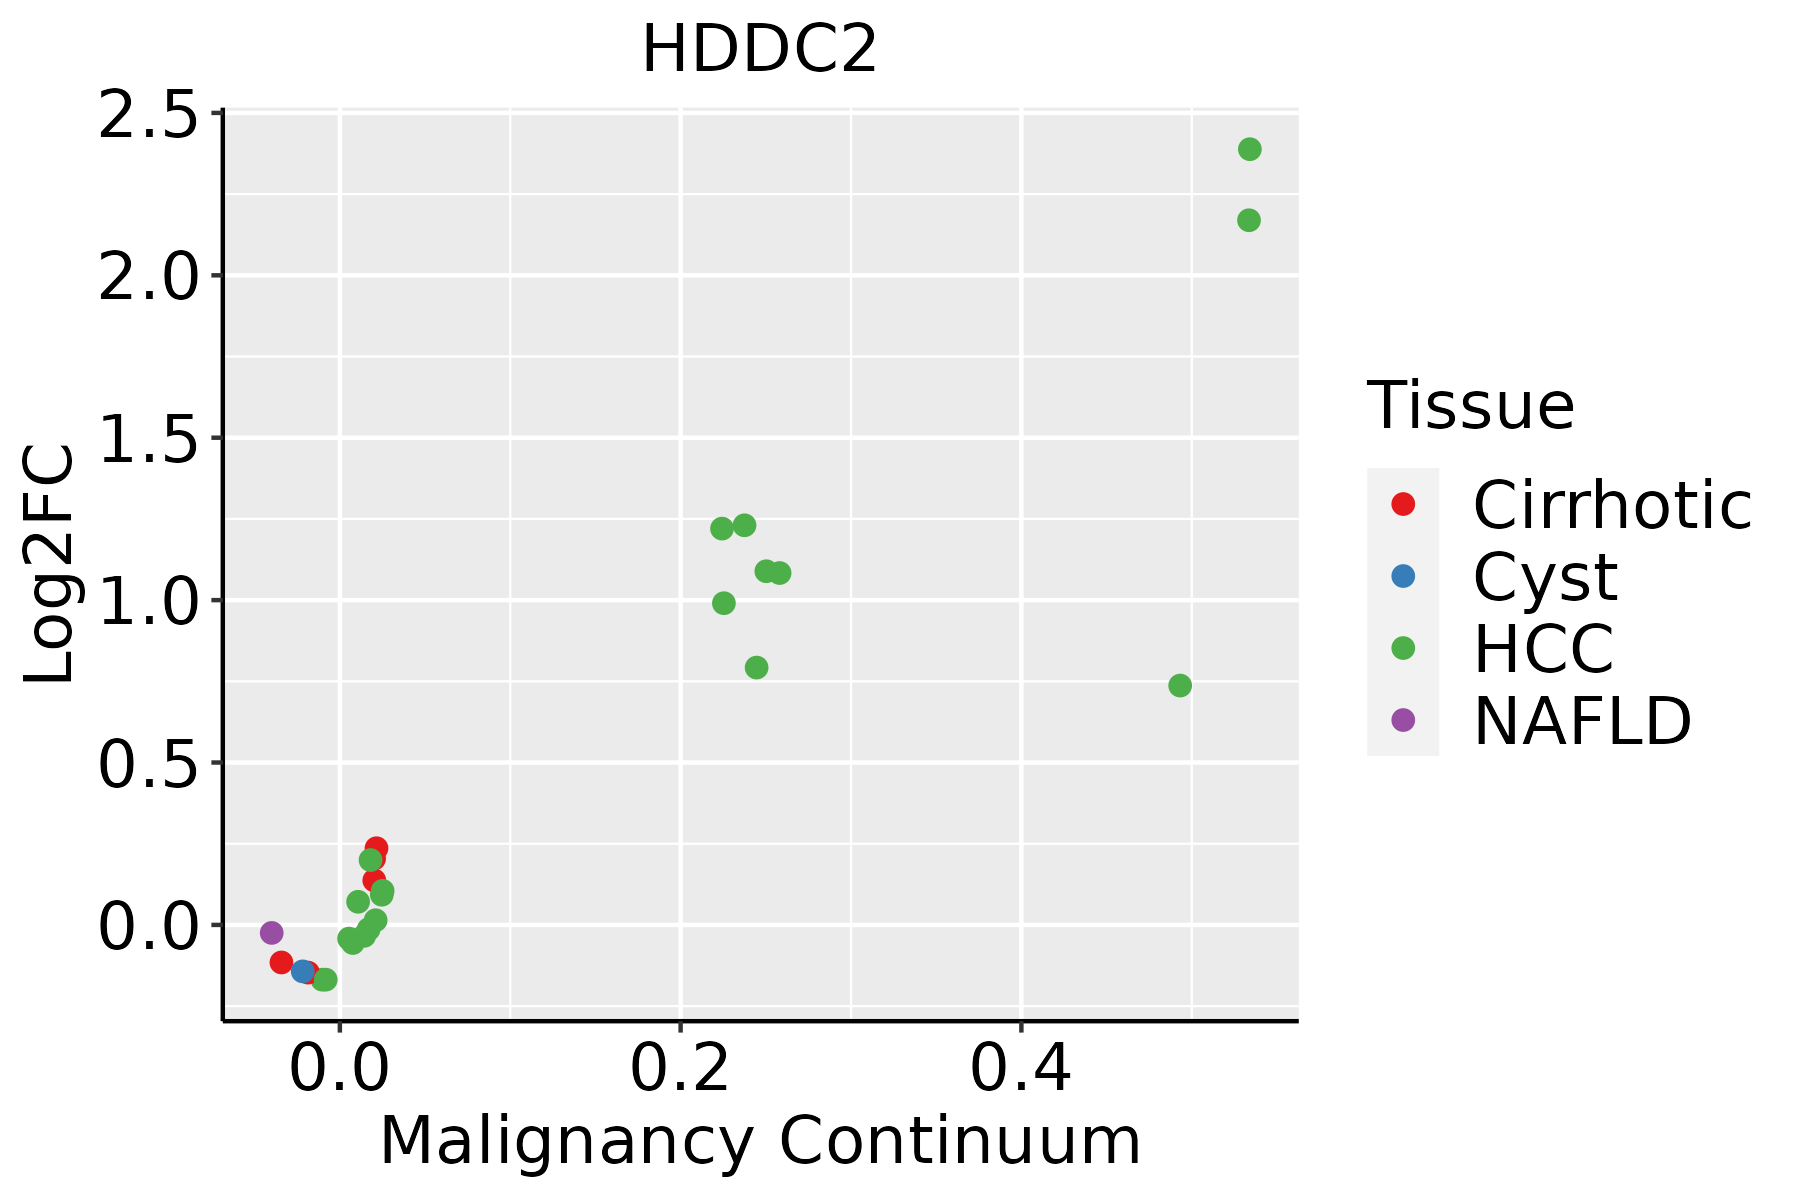 | HCC: Hepatocellular carcinoma |
| NAFLD: Non-alcoholic fatty liver disease | ||
| Oral Cavity |  | EOLP: Erosive Oral lichen planus |
| LP: leukoplakia | ||
| NEOLP: Non-erosive oral lichen planus | ||
| OSCC: Oral squamous cell carcinoma | ||
| Skin | 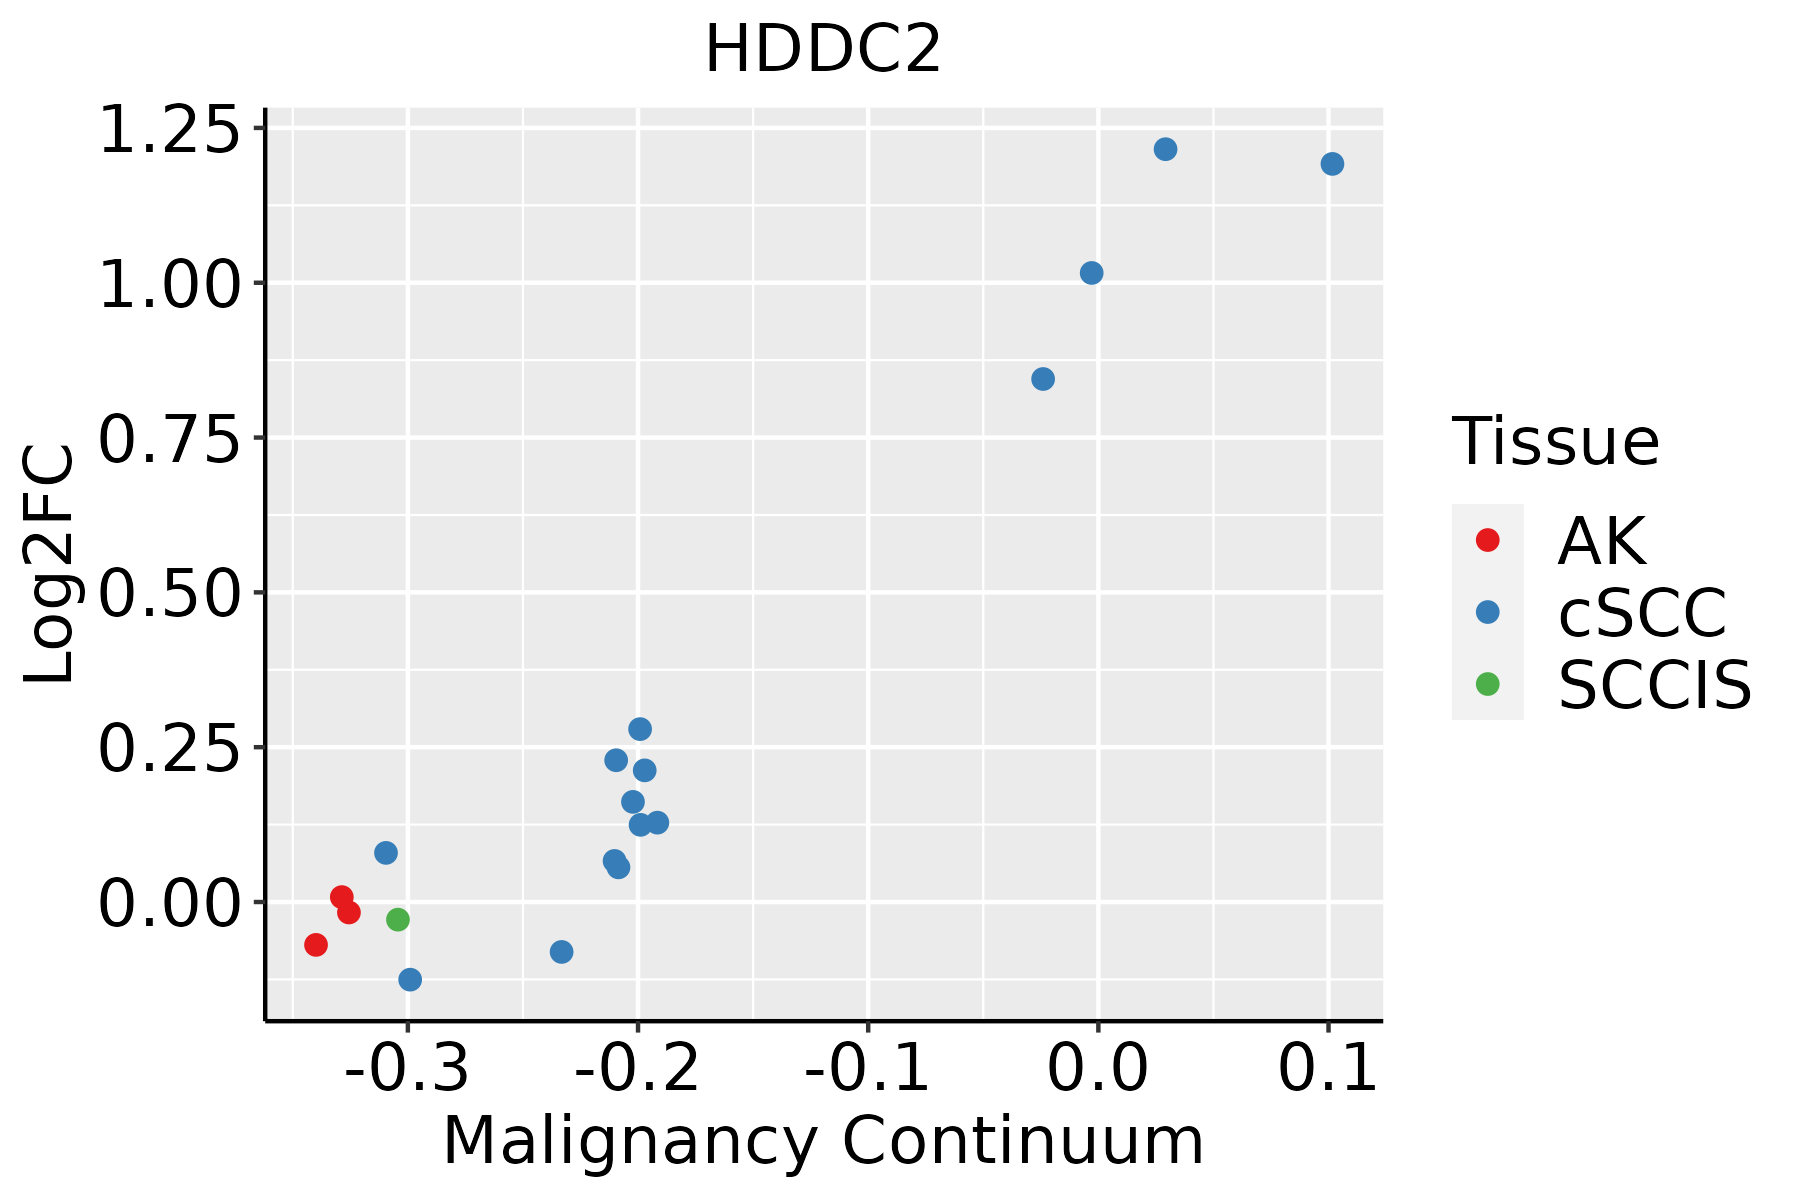 | AK: Actinic keratosis |
| cSCC: Cutaneous squamous cell carcinoma | ||
| SCCIS:squamous cell carcinoma in situ | ||
| Thyroid | 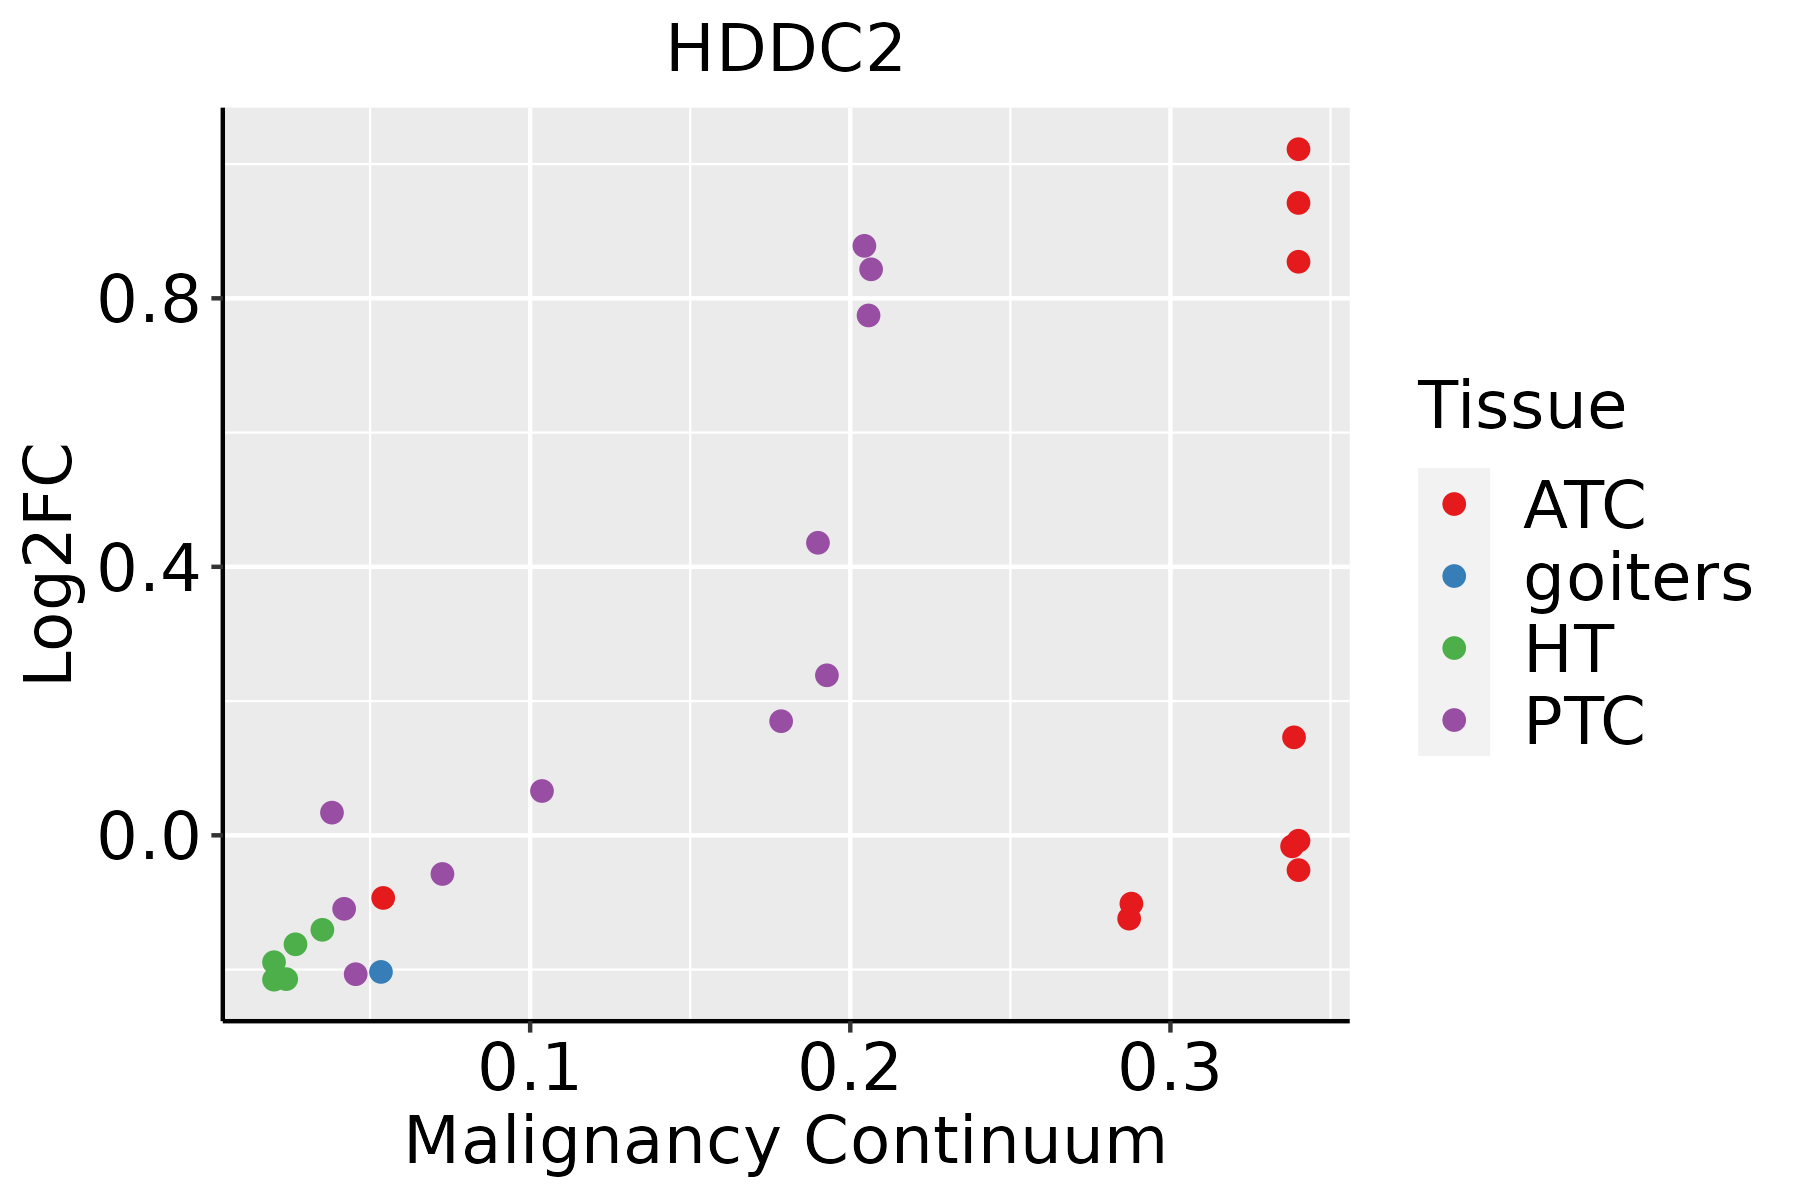 | ATC: Anaplastic thyroid cancer |
| HT: Hashimoto's thyroiditis | ||
| PTC: Papillary thyroid cancer |
| ∗log2FC in expression of this searched gene in stem-like cells from each diseased tissue sample relative to stem-like cells in normal samples in each tissue plotted against the malignancy continuum. Samples are colored based on if they are from different disease stage. |
Top |
Malignant transformation related pathway analysis |
| Find out the enriched GO biological processes and KEGG pathways involved in transition from healthy to precancer to cancer |
| Tissue | Disease Stage | Enriched GO biological Processes |
| Colorectum | AD |  |
| Colorectum | SER |  |
| Colorectum | MSS |  |
| Colorectum | MSI-H |  |
| Colorectum | FAP |  |
| ∗Top 15 enriched GO BP terms are showed in the bar plot of each disease state in each tissue. Each row represents a significant GO biological process which is colored according to the -log10(p.adjust). |
| Page: 1 2 3 4 5 6 7 8 9 |
| GO ID | Tissue | Disease Stage | Description | Gene Ratio | Bg Ratio | pvalue | p.adjust | Count |
| GO:0016311 | Colorectum | AD | dephosphorylation | 123/3918 | 417/18723 | 1.84e-05 | 3.82e-04 | 123 |
| GO:001631110 | Esophagus | ESCC | dephosphorylation | 251/8552 | 417/18723 | 1.26e-09 | 2.99e-08 | 251 |
| GO:001631111 | Liver | Cirrhotic | dephosphorylation | 130/4634 | 417/18723 | 1.58e-03 | 1.03e-02 | 130 |
| GO:001631121 | Liver | HCC | dephosphorylation | 230/7958 | 417/18723 | 1.00e-07 | 1.96e-06 | 230 |
| GO:00163119 | Oral cavity | OSCC | dephosphorylation | 220/7305 | 417/18723 | 6.33e-09 | 1.34e-07 | 220 |
| GO:001631115 | Skin | cSCC | dephosphorylation | 134/4864 | 417/18723 | 2.65e-03 | 1.50e-02 | 134 |
| GO:001631116 | Thyroid | PTC | dephosphorylation | 174/5968 | 417/18723 | 1.20e-05 | 1.31e-04 | 174 |
| GO:001631117 | Thyroid | ATC | dephosphorylation | 179/6293 | 417/18723 | 3.88e-05 | 3.15e-04 | 179 |
| Page: 1 |
| Pathway ID | Tissue | Disease Stage | Description | Gene Ratio | Bg Ratio | pvalue | p.adjust | qvalue | Count |
| hsa012325 | Esophagus | ESCC | Nucleotide metabolism | 59/4205 | 85/8465 | 1.67e-04 | 6.58e-04 | 3.37e-04 | 59 |
| hsa002405 | Esophagus | ESCC | Pyrimidine metabolism | 41/4205 | 58/8465 | 9.14e-04 | 2.92e-03 | 1.49e-03 | 41 |
| hsa0123212 | Esophagus | ESCC | Nucleotide metabolism | 59/4205 | 85/8465 | 1.67e-04 | 6.58e-04 | 3.37e-04 | 59 |
| hsa0024012 | Esophagus | ESCC | Pyrimidine metabolism | 41/4205 | 58/8465 | 9.14e-04 | 2.92e-03 | 1.49e-03 | 41 |
| hsa01232 | Liver | Cirrhotic | Nucleotide metabolism | 39/2530 | 85/8465 | 1.27e-03 | 6.73e-03 | 4.15e-03 | 39 |
| hsa00240 | Liver | Cirrhotic | Pyrimidine metabolism | 27/2530 | 58/8465 | 5.31e-03 | 1.88e-02 | 1.16e-02 | 27 |
| hsa012321 | Liver | Cirrhotic | Nucleotide metabolism | 39/2530 | 85/8465 | 1.27e-03 | 6.73e-03 | 4.15e-03 | 39 |
| hsa002401 | Liver | Cirrhotic | Pyrimidine metabolism | 27/2530 | 58/8465 | 5.31e-03 | 1.88e-02 | 1.16e-02 | 27 |
| hsa002402 | Liver | HCC | Pyrimidine metabolism | 44/4020 | 58/8465 | 9.34e-06 | 7.11e-05 | 3.95e-05 | 44 |
| hsa012322 | Liver | HCC | Nucleotide metabolism | 59/4020 | 85/8465 | 3.30e-05 | 1.88e-04 | 1.04e-04 | 59 |
| hsa002403 | Liver | HCC | Pyrimidine metabolism | 44/4020 | 58/8465 | 9.34e-06 | 7.11e-05 | 3.95e-05 | 44 |
| hsa012323 | Liver | HCC | Nucleotide metabolism | 59/4020 | 85/8465 | 3.30e-05 | 1.88e-04 | 1.04e-04 | 59 |
| hsa012324 | Oral cavity | OSCC | Nucleotide metabolism | 54/3704 | 85/8465 | 1.78e-04 | 5.95e-04 | 3.03e-04 | 54 |
| hsa002404 | Oral cavity | OSCC | Pyrimidine metabolism | 37/3704 | 58/8465 | 1.62e-03 | 4.45e-03 | 2.26e-03 | 37 |
| hsa0123211 | Oral cavity | OSCC | Nucleotide metabolism | 54/3704 | 85/8465 | 1.78e-04 | 5.95e-04 | 3.03e-04 | 54 |
| hsa0024011 | Oral cavity | OSCC | Pyrimidine metabolism | 37/3704 | 58/8465 | 1.62e-03 | 4.45e-03 | 2.26e-03 | 37 |
| hsa0123221 | Oral cavity | LP | Nucleotide metabolism | 42/2418 | 85/8465 | 3.62e-05 | 2.36e-04 | 1.52e-04 | 42 |
| hsa0024021 | Oral cavity | LP | Pyrimidine metabolism | 28/2418 | 58/8465 | 1.12e-03 | 5.02e-03 | 3.24e-03 | 28 |
| hsa0123231 | Oral cavity | LP | Nucleotide metabolism | 42/2418 | 85/8465 | 3.62e-05 | 2.36e-04 | 1.52e-04 | 42 |
| hsa0024031 | Oral cavity | LP | Pyrimidine metabolism | 28/2418 | 58/8465 | 1.12e-03 | 5.02e-03 | 3.24e-03 | 28 |
| Page: 1 |
Top |
Cell-cell communication analysis |
| Identification of potential cell-cell interactions between two cell types and their ligand-receptor pairs for different disease states |
| Ligand | Receptor | LRpair | Pathway | Tissue | Disease Stage |
| Page: 1 |
Top |
Single-cell gene regulatory network inference analysis |
| Find out the significant the regulons (TFs) and the target genes of each regulon across cell types for different disease states |
| TF | Cell Type | Tissue | Disease Stage | Target Gene | RSS | Regulon Activity |
| ∗The dot plots of a searched regulon are shown for all cell subpopulations in each disease state of each tissue based on the regulon specific score inferred using pySCENIC and by calculating the average expression. |
| Page: 1 |
Top |
Somatic mutation of malignant transformation related genes |
| Annotation of somatic variants for genes involved in malignant transformation |
| Hugo Symbol | Variant Class | Variant Classification | dbSNP RS | HGVSc | HGVSp | HGVSp Short | SWISSPROT | BIOTYPE | SIFT | PolyPhen | Tumor Sample Barcode | Tissue | Histology | Sex | Age | Stage | Therapy Types | Drugs | Outcome |
| HDDC2 | SNV | Missense_Mutation | rs530940861 | c.136N>A | p.Val46Ile | p.V46I | Q7Z4H3 | protein_coding | tolerated(0.72) | possibly_damaging(0.835) | TCGA-AC-A62V-01 | Breast | breast invasive carcinoma | Male | <65 | III/IV | Targeted Molecular therapy | denosumab | PD |
| HDDC2 | SNV | Missense_Mutation | c.346G>A | p.Asp116Asn | p.D116N | Q7Z4H3 | protein_coding | tolerated(0.16) | benign(0.012) | TCGA-AN-A0XR-01 | Breast | breast invasive carcinoma | Female | <65 | III/IV | Unknown | Unknown | SD | |
| HDDC2 | SNV | Missense_Mutation | rs761182166 | c.413N>A | p.Phe138Tyr | p.F138Y | Q7Z4H3 | protein_coding | tolerated(0.15) | benign(0.012) | TCGA-E2-A15I-01 | Breast | breast invasive carcinoma | Female | <65 | I/II | Hormone Therapy | tamoxiphen | SD |
| HDDC2 | SNV | Missense_Mutation | c.495N>T | p.Gln165His | p.Q165H | Q7Z4H3 | protein_coding | deleterious(0.01) | possibly_damaging(0.531) | TCGA-E9-A22H-01 | Breast | breast invasive carcinoma | Female | <65 | I/II | Chemotherapy | doxorubicin | SD | |
| HDDC2 | SNV | Missense_Mutation | novel | c.441G>A | p.Met147Ile | p.M147I | Q7Z4H3 | protein_coding | deleterious(0) | probably_damaging(0.942) | TCGA-2W-A8YY-01 | Cervix | cervical & endocervical cancer | Female | <65 | I/II | Chemotherapy | cisplatin | CR |
| HDDC2 | SNV | Missense_Mutation | c.232N>A | p.Asp78Asn | p.D78N | Q7Z4H3 | protein_coding | deleterious(0.01) | probably_damaging(0.999) | TCGA-AA-3697-01 | Colorectum | colon adenocarcinoma | Male | >=65 | I/II | Unknown | Unknown | SD | |
| HDDC2 | SNV | Missense_Mutation | c.445N>A | p.Leu149Ile | p.L149I | Q7Z4H3 | protein_coding | tolerated(0.05) | benign(0.123) | TCGA-AA-A010-01 | Colorectum | colon adenocarcinoma | Female | <65 | I/II | Chemotherapy | folinic | CR | |
| HDDC2 | SNV | Missense_Mutation | c.284N>G | p.Lys95Arg | p.K95R | Q7Z4H3 | protein_coding | deleterious(0.01) | benign(0.03) | TCGA-AZ-4315-01 | Colorectum | colon adenocarcinoma | Male | <65 | I/II | Unknown | Unknown | SD | |
| HDDC2 | SNV | Missense_Mutation | c.514G>T | p.Ala172Ser | p.A172S | Q7Z4H3 | protein_coding | tolerated(0.22) | benign(0.027) | TCGA-D5-6930-01 | Colorectum | colon adenocarcinoma | Male | >=65 | I/II | Unknown | Unknown | SD | |
| HDDC2 | SNV | Missense_Mutation | rs199632604 | c.95N>A | p.Arg32Gln | p.R32Q | Q7Z4H3 | protein_coding | deleterious(0) | probably_damaging(1) | TCGA-EI-6917-01 | Colorectum | rectum adenocarcinoma | Male | <65 | III/IV | Chemotherapy | 5fluorouracil+oxaciplatina+l-folinian | SD |
| Page: 1 2 |
Top |
Related drugs of malignant transformation related genes |
| Identification of chemicals and drugs interact with genes involved in malignant transfromation |
| (DGIdb 4.0) |
| Entrez ID | Symbol | Category | Interaction Types | Drug Claim Name | Drug Name | PMIDs |
| Page: 1 |

Copyright 2023-Present -The University of Texas Health Science Center at Houston |