
|
|||||
|
 | |
| |
| |
| |
| |
| |
|
Gene: HDAC7 |
Gene summary for HDAC7 |
| Gene information | Species | Human | Gene symbol | HDAC7 | Gene ID | 51564 |
| Gene name | histone deacetylase 7 | |
| Gene Alias | HD7 | |
| Cytomap | 12q13.11 | |
| Gene Type | protein-coding | GO ID | GO:0000122 | UniProtAcc | Q8WUI4 |
Top |
Malignant transformation analysis |
| Identification of the aberrant gene expression in precancerous and cancerous lesions by comparing the gene expression of stem-like cells in diseased tissues with normal stem cells |
| Entrez ID | Symbol | Replicates | Species | Organ | Tissue | Adj P-value | Log2FC | Malignancy |
| 51564 | HDAC7 | LZE5T | Human | Esophagus | ESCC | 1.00e-02 | 2.77e-01 | 0.0514 |
| 51564 | HDAC7 | LZE7T | Human | Esophagus | ESCC | 2.31e-06 | 3.25e-01 | 0.0667 |
| 51564 | HDAC7 | LZE8T | Human | Esophagus | ESCC | 2.30e-03 | 2.07e-01 | 0.067 |
| 51564 | HDAC7 | LZE20T | Human | Esophagus | ESCC | 1.49e-21 | 6.30e-01 | 0.0662 |
| 51564 | HDAC7 | LZE22T | Human | Esophagus | ESCC | 9.68e-04 | 2.22e-01 | 0.068 |
| 51564 | HDAC7 | LZE24T | Human | Esophagus | ESCC | 4.29e-18 | 4.92e-01 | 0.0596 |
| 51564 | HDAC7 | P1T-E | Human | Esophagus | ESCC | 6.72e-16 | 6.39e-01 | 0.0875 |
| 51564 | HDAC7 | P2T-E | Human | Esophagus | ESCC | 7.66e-27 | 4.69e-01 | 0.1177 |
| 51564 | HDAC7 | P4T-E | Human | Esophagus | ESCC | 1.51e-05 | 1.38e-01 | 0.1323 |
| 51564 | HDAC7 | P5T-E | Human | Esophagus | ESCC | 2.60e-16 | 2.58e-01 | 0.1327 |
| 51564 | HDAC7 | P8T-E | Human | Esophagus | ESCC | 2.22e-22 | 4.78e-01 | 0.0889 |
| 51564 | HDAC7 | P10T-E | Human | Esophagus | ESCC | 4.68e-13 | 2.54e-01 | 0.116 |
| 51564 | HDAC7 | P11T-E | Human | Esophagus | ESCC | 1.61e-11 | 4.44e-01 | 0.1426 |
| 51564 | HDAC7 | P12T-E | Human | Esophagus | ESCC | 2.98e-17 | 2.71e-01 | 0.1122 |
| 51564 | HDAC7 | P15T-E | Human | Esophagus | ESCC | 3.16e-16 | 3.66e-01 | 0.1149 |
| 51564 | HDAC7 | P16T-E | Human | Esophagus | ESCC | 1.57e-09 | 1.66e-01 | 0.1153 |
| 51564 | HDAC7 | P17T-E | Human | Esophagus | ESCC | 5.18e-12 | 5.27e-01 | 0.1278 |
| 51564 | HDAC7 | P19T-E | Human | Esophagus | ESCC | 1.04e-06 | 5.65e-01 | 0.1662 |
| 51564 | HDAC7 | P20T-E | Human | Esophagus | ESCC | 1.76e-09 | 3.05e-01 | 0.1124 |
| 51564 | HDAC7 | P21T-E | Human | Esophagus | ESCC | 3.28e-13 | 2.45e-01 | 0.1617 |
| Page: 1 2 3 4 5 |
| Tissue | Expression Dynamics | Abbreviation |
| Esophagus |  | ESCC: Esophageal squamous cell carcinoma |
| HGIN: High-grade intraepithelial neoplasias | ||
| LGIN: Low-grade intraepithelial neoplasias | ||
| Oral Cavity | 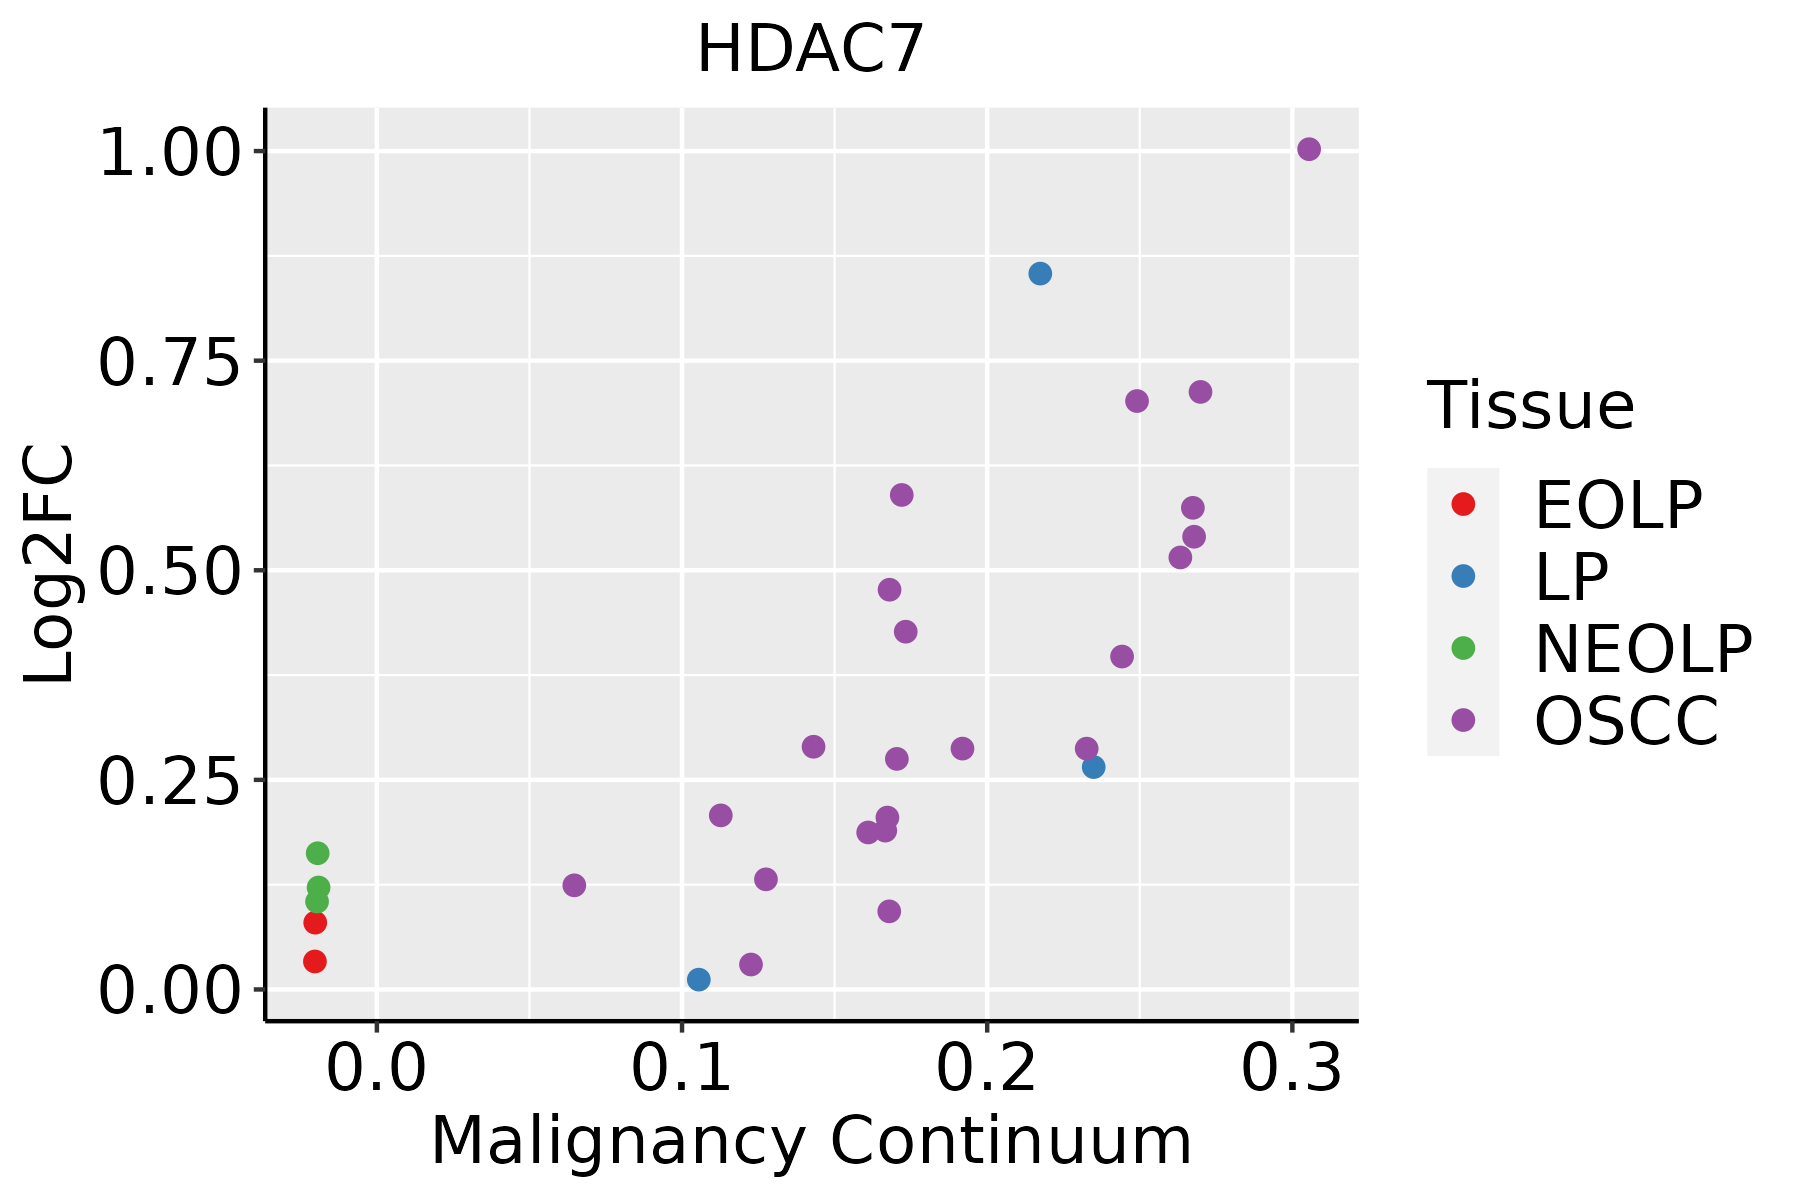 | EOLP: Erosive Oral lichen planus |
| LP: leukoplakia | ||
| NEOLP: Non-erosive oral lichen planus | ||
| OSCC: Oral squamous cell carcinoma | ||
| Thyroid |  | ATC: Anaplastic thyroid cancer |
| HT: Hashimoto's thyroiditis | ||
| PTC: Papillary thyroid cancer |
| ∗log2FC in expression of this searched gene in stem-like cells from each diseased tissue sample relative to stem-like cells in normal samples in each tissue plotted against the malignancy continuum. Samples are colored based on if they are from different disease stage. |
Top |
Malignant transformation related pathway analysis |
| Find out the enriched GO biological processes and KEGG pathways involved in transition from healthy to precancer to cancer |
| Tissue | Disease Stage | Enriched GO biological Processes |
| Colorectum | AD |  |
| Colorectum | SER |  |
| Colorectum | MSS |  |
| Colorectum | MSI-H |  |
| Colorectum | FAP |  |
| ∗Top 15 enriched GO BP terms are showed in the bar plot of each disease state in each tissue. Each row represents a significant GO biological process which is colored according to the -log10(p.adjust). |
| Page: 1 2 3 4 5 6 7 8 9 |
| GO ID | Tissue | Disease Stage | Description | Gene Ratio | Bg Ratio | pvalue | p.adjust | Count |
| GO:001657015 | Esophagus | ESCC | histone modification | 323/8552 | 463/18723 | 2.61e-26 | 7.88e-24 | 323 |
| GO:001820514 | Esophagus | ESCC | peptidyl-lysine modification | 259/8552 | 376/18723 | 3.90e-20 | 5.26e-18 | 259 |
| GO:00356015 | Esophagus | ESCC | protein deacylation | 79/8552 | 112/18723 | 8.30e-08 | 1.42e-06 | 79 |
| GO:00987325 | Esophagus | ESCC | macromolecule deacylation | 80/8552 | 116/18723 | 3.19e-07 | 4.50e-06 | 80 |
| GO:00165754 | Esophagus | ESCC | histone deacetylation | 60/8552 | 82/18723 | 3.85e-07 | 5.32e-06 | 60 |
| GO:00064765 | Esophagus | ESCC | protein deacetylation | 70/8552 | 101/18723 | 1.29e-06 | 1.58e-05 | 70 |
| GO:000164918 | Esophagus | ESCC | osteoblast differentiation | 140/8552 | 229/18723 | 1.63e-06 | 1.95e-05 | 140 |
| GO:001692512 | Esophagus | ESCC | protein sumoylation | 41/8552 | 53/18723 | 2.49e-06 | 2.86e-05 | 41 |
| GO:000150317 | Esophagus | ESCC | ossification | 232/8552 | 408/18723 | 3.00e-06 | 3.40e-05 | 232 |
| GO:003432918 | Esophagus | ESCC | cell junction assembly | 227/8552 | 420/18723 | 3.06e-04 | 1.83e-03 | 227 |
| GO:004521620 | Esophagus | ESCC | cell-cell junction organization | 114/8552 | 200/18723 | 8.04e-04 | 4.16e-03 | 114 |
| GO:000166720 | Esophagus | ESCC | ameboidal-type cell migration | 250/8552 | 475/18723 | 1.22e-03 | 5.97e-03 | 250 |
| GO:00456675 | Esophagus | ESCC | regulation of osteoblast differentiation | 77/8552 | 132/18723 | 2.28e-03 | 1.00e-02 | 77 |
| GO:00380615 | Esophagus | ESCC | NIK/NF-kappaB signaling | 81/8552 | 143/18723 | 5.33e-03 | 2.00e-02 | 81 |
| GO:001063120 | Esophagus | ESCC | epithelial cell migration | 187/8552 | 357/18723 | 6.05e-03 | 2.23e-02 | 187 |
| GO:009013220 | Esophagus | ESCC | epithelium migration | 188/8552 | 360/18723 | 6.96e-03 | 2.54e-02 | 188 |
| GO:00709321 | Esophagus | ESCC | histone H3 deacetylation | 15/8552 | 20/18723 | 7.60e-03 | 2.71e-02 | 15 |
| GO:009013020 | Esophagus | ESCC | tissue migration | 190/8552 | 365/18723 | 7.91e-03 | 2.82e-02 | 190 |
| GO:00165707 | Oral cavity | OSCC | histone modification | 270/7305 | 463/18723 | 1.59e-17 | 1.50e-15 | 270 |
| GO:00182056 | Oral cavity | OSCC | peptidyl-lysine modification | 216/7305 | 376/18723 | 2.32e-13 | 1.16e-11 | 216 |
| Page: 1 2 3 4 5 6 7 8 |
| Pathway ID | Tissue | Disease Stage | Description | Gene Ratio | Bg Ratio | pvalue | p.adjust | qvalue | Count |
| hsa0520325 | Esophagus | ESCC | Viral carcinogenesis | 137/4205 | 204/8465 | 2.47e-07 | 1.88e-06 | 9.62e-07 | 137 |
| hsa0520335 | Esophagus | ESCC | Viral carcinogenesis | 137/4205 | 204/8465 | 2.47e-07 | 1.88e-06 | 9.62e-07 | 137 |
| hsa052038 | Oral cavity | OSCC | Viral carcinogenesis | 124/3704 | 204/8465 | 5.57e-07 | 3.28e-06 | 1.67e-06 | 124 |
| hsa0520314 | Oral cavity | OSCC | Viral carcinogenesis | 124/3704 | 204/8465 | 5.57e-07 | 3.28e-06 | 1.67e-06 | 124 |
| hsa0520324 | Oral cavity | LP | Viral carcinogenesis | 90/2418 | 204/8465 | 1.20e-06 | 1.38e-05 | 8.89e-06 | 90 |
| hsa0520334 | Oral cavity | LP | Viral carcinogenesis | 90/2418 | 204/8465 | 1.20e-06 | 1.38e-05 | 8.89e-06 | 90 |
| hsa0520342 | Oral cavity | EOLP | Viral carcinogenesis | 55/1218 | 204/8465 | 1.54e-06 | 1.34e-05 | 7.92e-06 | 55 |
| hsa0520351 | Oral cavity | EOLP | Viral carcinogenesis | 55/1218 | 204/8465 | 1.54e-06 | 1.34e-05 | 7.92e-06 | 55 |
| hsa0520361 | Oral cavity | NEOLP | Viral carcinogenesis | 56/1112 | 204/8465 | 2.90e-08 | 5.34e-07 | 3.36e-07 | 56 |
| hsa0520371 | Oral cavity | NEOLP | Viral carcinogenesis | 56/1112 | 204/8465 | 2.90e-08 | 5.34e-07 | 3.36e-07 | 56 |
| Page: 1 |
Top |
Cell-cell communication analysis |
| Identification of potential cell-cell interactions between two cell types and their ligand-receptor pairs for different disease states |
| Ligand | Receptor | LRpair | Pathway | Tissue | Disease Stage |
| Page: 1 |
Top |
Single-cell gene regulatory network inference analysis |
| Find out the significant the regulons (TFs) and the target genes of each regulon across cell types for different disease states |
| TF | Cell Type | Tissue | Disease Stage | Target Gene | RSS | Regulon Activity |
| ∗The dot plots of a searched regulon are shown for all cell subpopulations in each disease state of each tissue based on the regulon specific score inferred using pySCENIC and by calculating the average expression. |
| Page: 1 |
Top |
Somatic mutation of malignant transformation related genes |
| Annotation of somatic variants for genes involved in malignant transformation |
| Hugo Symbol | Variant Class | Variant Classification | dbSNP RS | HGVSc | HGVSp | HGVSp Short | SWISSPROT | BIOTYPE | SIFT | PolyPhen | Tumor Sample Barcode | Tissue | Histology | Sex | Age | Stage | Therapy Types | Drugs | Outcome |
| HDAC7 | SNV | Missense_Mutation | novel | c.224N>T | p.Gly75Val | p.G75V | Q8WUI4 | protein_coding | tolerated(0.39) | possibly_damaging(0.678) | TCGA-A2-A25C-01 | Breast | breast invasive carcinoma | Female | <65 | I/II | Chemotherapy | taxotere | SD |
| HDAC7 | deletion | In_Frame_Del | c.2871_2879delNNNNNNNNN | p.Glu958_Glu960del | p.E958_E960del | Q8WUI4 | protein_coding | TCGA-AC-A23H-01 | Breast | breast invasive carcinoma | Female | >=65 | I/II | Unknown | Unknown | PD | |||
| HDAC7 | insertion | Frame_Shift_Ins | novel | c.2095_2096insTACAGGTAGTGATGATAAGAATAATAGC | p.Gly699ValfsTer83 | p.G699Vfs*83 | Q8WUI4 | protein_coding | TCGA-AN-A0FX-01 | Breast | breast invasive carcinoma | Female | <65 | I/II | Unknown | Unknown | SD | ||
| HDAC7 | SNV | Missense_Mutation | novel | c.2635N>A | p.Glu879Lys | p.E879K | Q8WUI4 | protein_coding | deleterious(0) | probably_damaging(1) | TCGA-2W-A8YY-01 | Cervix | cervical & endocervical cancer | Female | <65 | I/II | Chemotherapy | cisplatin | CR |
| HDAC7 | SNV | Missense_Mutation | c.1718N>T | p.Ser573Phe | p.S573F | Q8WUI4 | protein_coding | deleterious(0.01) | benign(0.114) | TCGA-2W-A8YY-01 | Cervix | cervical & endocervical cancer | Female | <65 | I/II | Chemotherapy | cisplatin | CR | |
| HDAC7 | SNV | Missense_Mutation | novel | c.515N>G | p.Phe172Cys | p.F172C | Q8WUI4 | protein_coding | tolerated(0.16) | possibly_damaging(0.784) | TCGA-2W-A8YY-01 | Cervix | cervical & endocervical cancer | Female | <65 | I/II | Chemotherapy | cisplatin | CR |
| HDAC7 | SNV | Missense_Mutation | rs531168904 | c.1229N>T | p.Pro410Leu | p.P410L | Q8WUI4 | protein_coding | tolerated(0.99) | benign(0) | TCGA-C5-A1MF-01 | Cervix | cervical & endocervical cancer | Female | <65 | I/II | Unknown | Unknown | SD |
| HDAC7 | SNV | Missense_Mutation | novel | c.2014N>A | p.His672Asn | p.H672N | Q8WUI4 | protein_coding | deleterious(0) | benign(0.146) | TCGA-DS-A7WH-01 | Cervix | cervical & endocervical cancer | Female | <65 | I/II | Chemotherapy | cisplatin | CR |
| HDAC7 | SNV | Missense_Mutation | novel | c.2638N>T | p.Gly880Cys | p.G880C | Q8WUI4 | protein_coding | deleterious(0) | probably_damaging(1) | TCGA-EA-A410-01 | Cervix | cervical & endocervical cancer | Female | <65 | I/II | Unknown | Unknown | SD |
| HDAC7 | SNV | Missense_Mutation | c.542N>A | p.Ser181Asn | p.S181N | Q8WUI4 | protein_coding | tolerated(0.55) | benign(0.001) | TCGA-A6-2672-01 | Colorectum | colon adenocarcinoma | Female | >=65 | III/IV | Unknown | Unknown | SD |
| Page: 1 2 3 4 5 6 7 8 |
Top |
Related drugs of malignant transformation related genes |
| Identification of chemicals and drugs interact with genes involved in malignant transfromation |
| (DGIdb 4.0) |
| Entrez ID | Symbol | Category | Interaction Types | Drug Claim Name | Drug Name | PMIDs |
| 51564 | HDAC7 | CLINICALLY ACTIONABLE, TRANSCRIPTION FACTOR, TRANSCRIPTION FACTOR BINDING, DRUGGABLE GENOME, ENZYME | inhibitor | CHEMBL235191 | TACEDINALINE | |
| 51564 | HDAC7 | CLINICALLY ACTIONABLE, TRANSCRIPTION FACTOR, TRANSCRIPTION FACTOR BINDING, DRUGGABLE GENOME, ENZYME | BUTANOIC ACID | BUTANOIC ACID | 19053749 | |
| 51564 | HDAC7 | CLINICALLY ACTIONABLE, TRANSCRIPTION FACTOR, TRANSCRIPTION FACTOR BINDING, DRUGGABLE GENOME, ENZYME | VORINOSTAT | VORINOSTAT | 19344175,19966789,26211462,23622981,22260166,20491440,21548582,19084294 | |
| 51564 | HDAC7 | CLINICALLY ACTIONABLE, TRANSCRIPTION FACTOR, TRANSCRIPTION FACTOR BINDING, DRUGGABLE GENOME, ENZYME | inhibitor | 310264675 | CUDC-101 | |
| 51564 | HDAC7 | CLINICALLY ACTIONABLE, TRANSCRIPTION FACTOR, TRANSCRIPTION FACTOR BINDING, DRUGGABLE GENOME, ENZYME | inhibitor | PCI-24781 | ABEXINOSTAT | |
| 51564 | HDAC7 | CLINICALLY ACTIONABLE, TRANSCRIPTION FACTOR, TRANSCRIPTION FACTOR BINDING, DRUGGABLE GENOME, ENZYME | inhibitor | VORINOSTAT | VORINOSTAT | |
| 51564 | HDAC7 | CLINICALLY ACTIONABLE, TRANSCRIPTION FACTOR, TRANSCRIPTION FACTOR BINDING, DRUGGABLE GENOME, ENZYME | DAUNORUBICIN | DAUNORUBICIN | 22260166 | |
| 51564 | HDAC7 | CLINICALLY ACTIONABLE, TRANSCRIPTION FACTOR, TRANSCRIPTION FACTOR BINDING, DRUGGABLE GENOME, ENZYME | inhibitor | CUDC-101 | CUDC-101 | |
| 51564 | HDAC7 | CLINICALLY ACTIONABLE, TRANSCRIPTION FACTOR, TRANSCRIPTION FACTOR BINDING, DRUGGABLE GENOME, ENZYME | inhibitor | PIVANEX | AN-9 | |
| 51564 | HDAC7 | CLINICALLY ACTIONABLE, TRANSCRIPTION FACTOR, TRANSCRIPTION FACTOR BINDING, DRUGGABLE GENOME, ENZYME | inhibitor | 187051793 | GIVINOSTAT |
| Page: 1 2 3 4 5 6 7 8 |

Copyright 2023-Present -The University of Texas Health Science Center at Houston |