| GO ID | Tissue | Disease Stage | Description | Gene Ratio | Bg Ratio | pvalue | p.adjust | Count |
| GO:00485457 | Liver | NAFLD | response to steroid hormone | 75/1882 | 339/18723 | 3.44e-11 | 1.12e-08 | 75 |
| GO:00165703 | Liver | NAFLD | histone modification | 90/1882 | 463/18723 | 5.74e-10 | 1.28e-07 | 90 |
| GO:00713836 | Liver | NAFLD | cellular response to steroid hormone stimulus | 48/1882 | 204/18723 | 1.50e-08 | 1.83e-06 | 48 |
| GO:00316477 | Liver | NAFLD | regulation of protein stability | 61/1882 | 298/18723 | 5.00e-08 | 4.71e-06 | 61 |
| GO:00181055 | Liver | NAFLD | peptidyl-serine phosphorylation | 63/1882 | 315/18723 | 7.45e-08 | 6.60e-06 | 63 |
| GO:00002095 | Liver | NAFLD | protein polyubiquitination | 51/1882 | 236/18723 | 1.04e-07 | 8.10e-06 | 51 |
| GO:00305226 | Liver | NAFLD | intracellular receptor signaling pathway | 55/1882 | 265/18723 | 1.39e-07 | 1.03e-05 | 55 |
| GO:00160495 | Liver | NAFLD | cell growth | 85/1882 | 482/18723 | 1.75e-07 | 1.25e-05 | 85 |
| GO:00458617 | Liver | NAFLD | negative regulation of proteolysis | 66/1882 | 351/18723 | 4.02e-07 | 2.58e-05 | 66 |
| GO:00182094 | Liver | NAFLD | peptidyl-serine modification | 64/1882 | 338/18723 | 4.65e-07 | 2.89e-05 | 64 |
| GO:00069797 | Liver | NAFLD | response to oxidative stress | 78/1882 | 446/18723 | 7.85e-07 | 4.29e-05 | 78 |
| GO:19029037 | Liver | NAFLD | regulation of supramolecular fiber organization | 66/1882 | 383/18723 | 8.97e-06 | 2.96e-04 | 66 |
| GO:0018205 | Liver | NAFLD | peptidyl-lysine modification | 65/1882 | 376/18723 | 9.42e-06 | 3.02e-04 | 65 |
| GO:00105065 | Liver | NAFLD | regulation of autophagy | 57/1882 | 317/18723 | 1.00e-05 | 3.18e-04 | 57 |
| GO:00097556 | Liver | NAFLD | hormone-mediated signaling pathway | 39/1882 | 190/18723 | 1.15e-05 | 3.58e-04 | 39 |
| GO:00485884 | Liver | NAFLD | developmental cell growth | 45/1882 | 234/18723 | 1.50e-05 | 4.38e-04 | 45 |
| GO:00163585 | Liver | NAFLD | dendrite development | 43/1882 | 243/18723 | 1.70e-04 | 3.07e-03 | 43 |
| GO:00434016 | Liver | NAFLD | steroid hormone mediated signaling pathway | 28/1882 | 136/18723 | 1.78e-04 | 3.14e-03 | 28 |
| GO:00065153 | Liver | NAFLD | protein quality control for misfolded or incompletely synthesized proteins | 10/1882 | 28/18723 | 2.46e-04 | 4.09e-03 | 10 |
| GO:00488133 | Liver | NAFLD | dendrite morphogenesis | 29/1882 | 146/18723 | 2.63e-04 | 4.26e-03 | 29 |
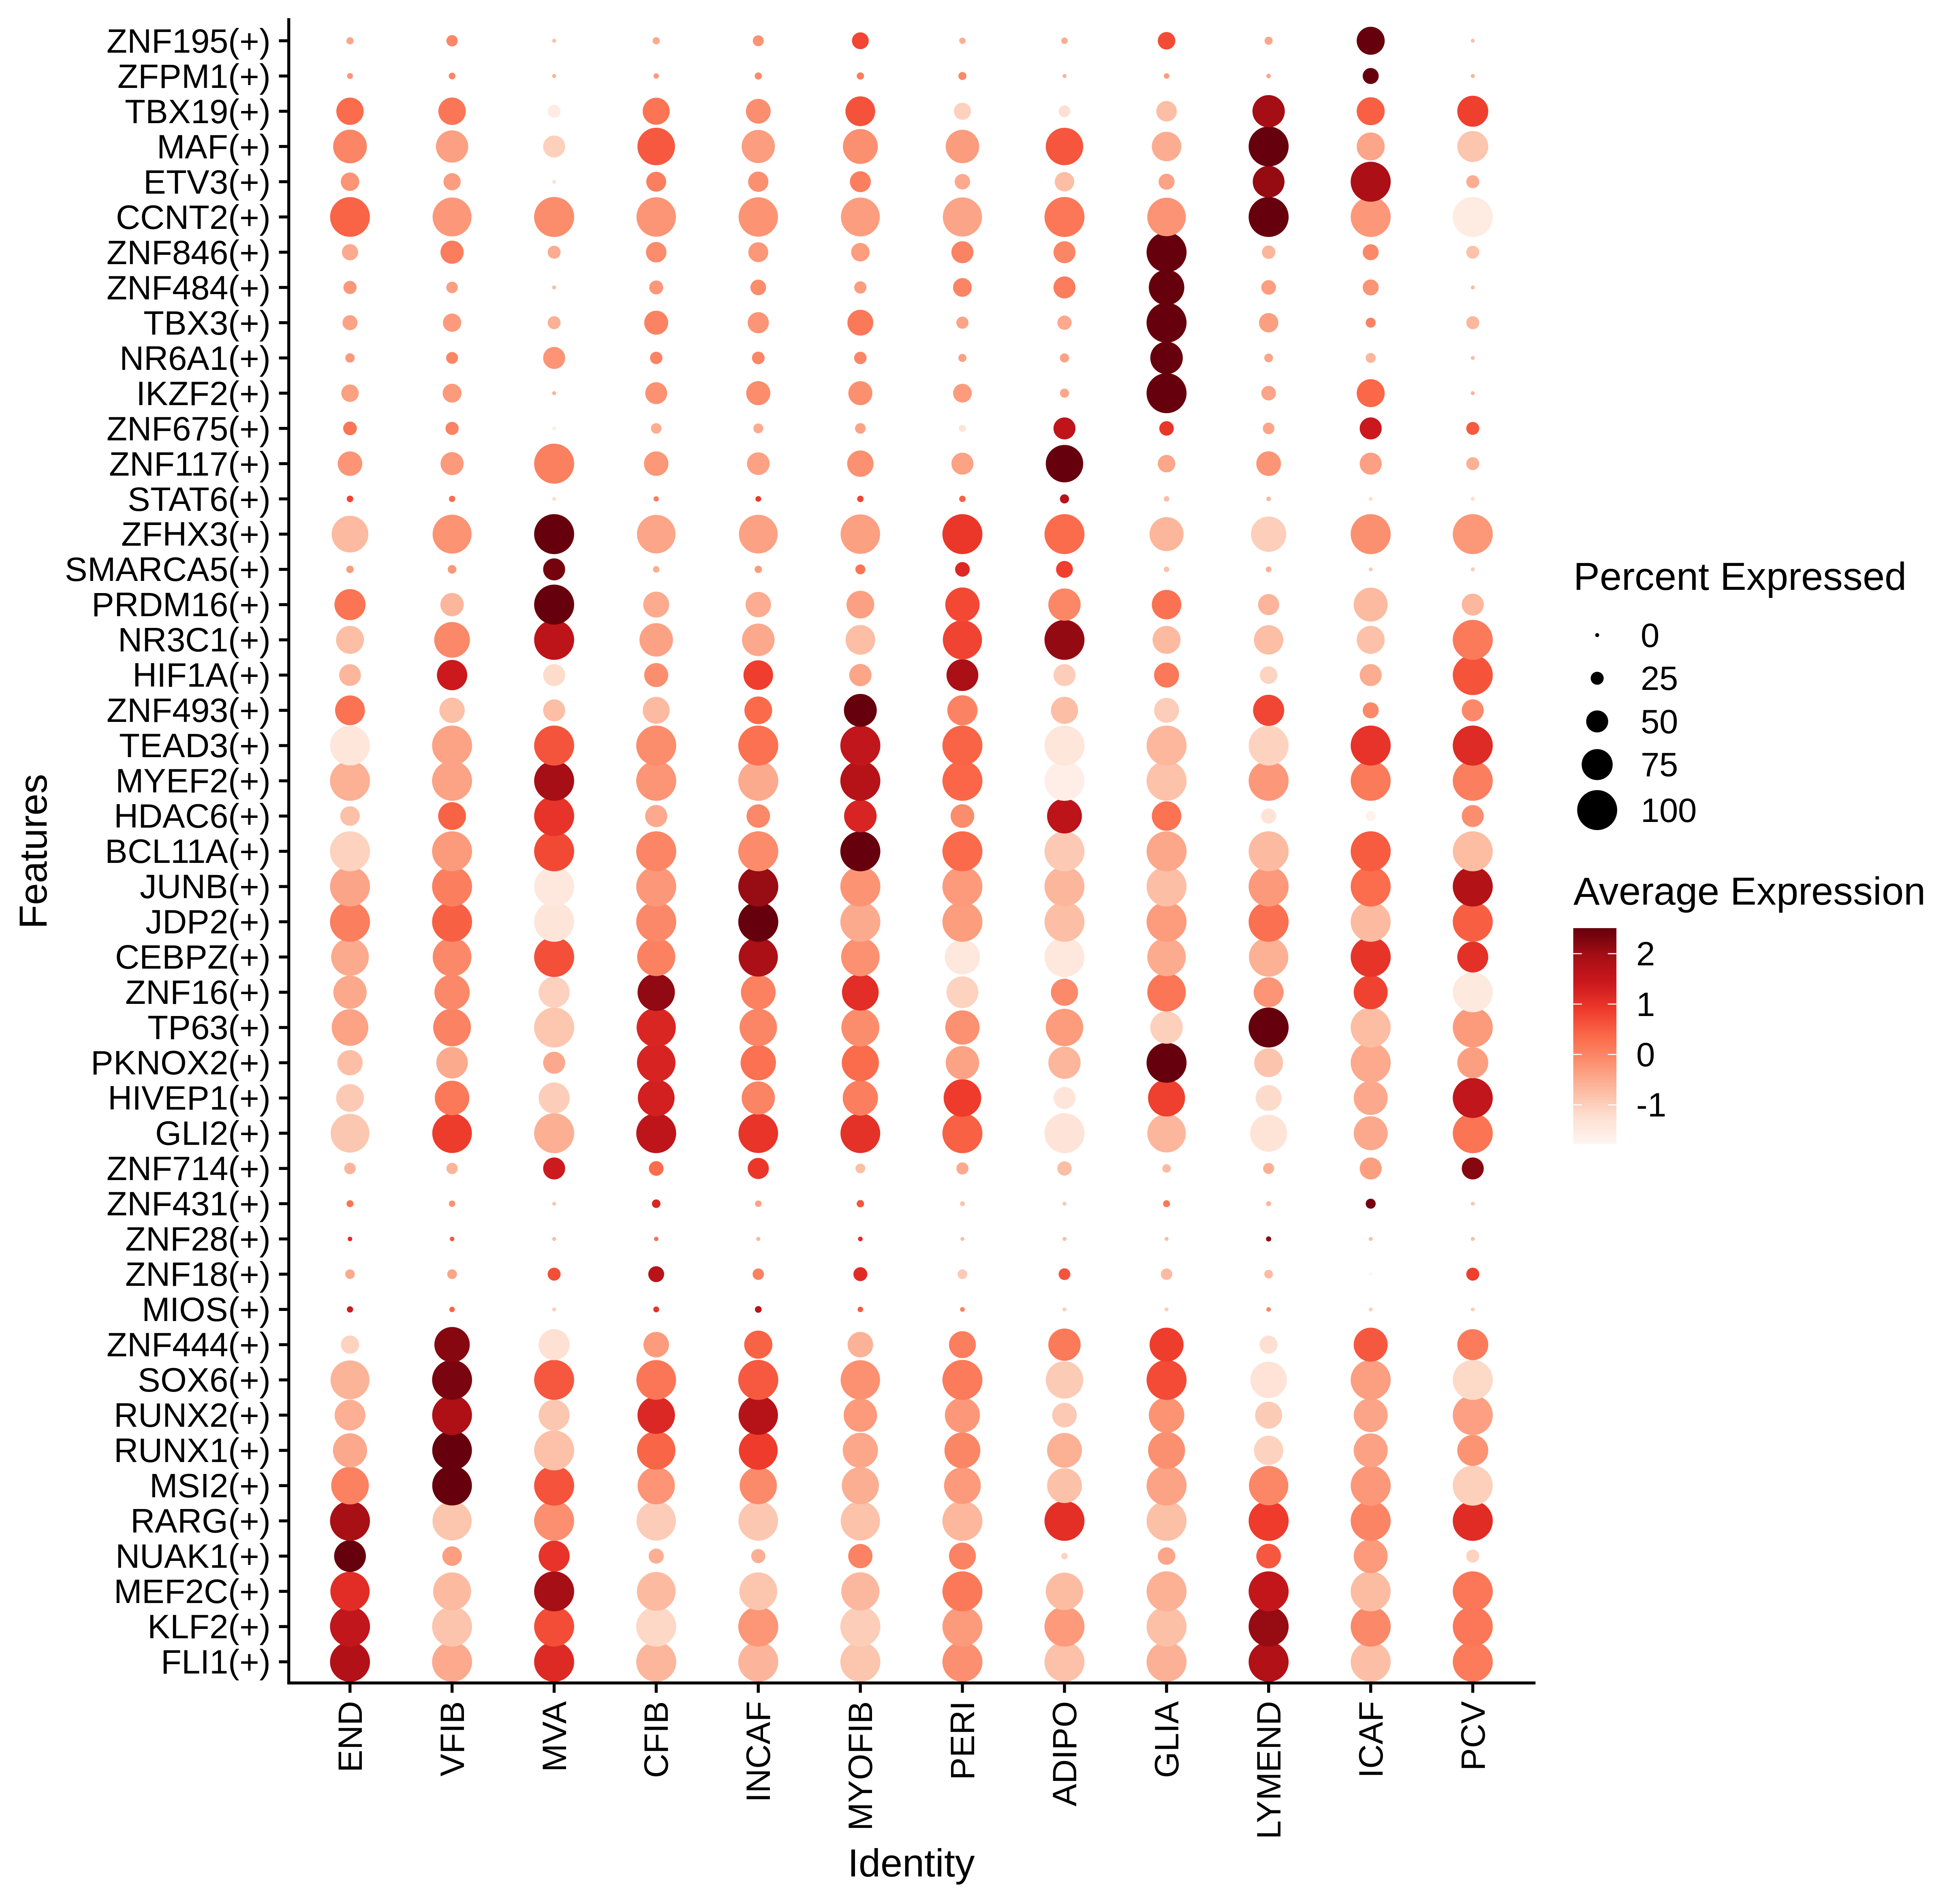
| TF | Cell Type | Tissue | Disease Stage | Target Gene | RSS | Regulon Activity |
| HDAC6 | MYOFIB | Colorectum | ADJ | OTUD6B-AS1,COL13A1,RNF170, etc. | 3.26e-01 |  |
| HDAC6 | MYOFIB | Colorectum | FAP | OTUD6B-AS1,COL13A1,RNF170, etc. | 2.54e-01 |  |
| HDAC6 | BAS | Endometrium | ADJ | MINDY2,ZNF662,TAF1C, etc. | 6.21e-03 |  |
| HDAC6 | iATC | Thyroid | Healthy | MRPL36,NSRP1,MVB12A, etc. | 6.35e-02 |  |
| Hugo Symbol | Variant Class | Variant Classification | dbSNP RS | HGVSc | HGVSp | HGVSp Short | SWISSPROT | BIOTYPE | SIFT | PolyPhen | Tumor Sample Barcode | Tissue | Histology | Sex | Age | Stage | Therapy Types | Drugs | Outcome |
| HDAC6 | SNV | Missense_Mutation | novel | c.3579G>C | p.Gln1193His | p.Q1193H | Q9UBN7 | protein_coding | deleterious(0) | possibly_damaging(0.722) | TCGA-A7-A6VW-01 | Breast | breast invasive carcinoma | Female | <65 | I/II | Chemotherapy | doxorubicin | CR |
| HDAC6 | SNV | Missense_Mutation | | c.2601N>A | p.Met867Ile | p.M867I | Q9UBN7 | protein_coding | tolerated(0.2) | benign(0.003) | TCGA-AC-A23H-01 | Breast | breast invasive carcinoma | Female | >=65 | I/II | Unknown | Unknown | PD |
| HDAC6 | SNV | Missense_Mutation | rs782451640 | c.2609G>A | p.Arg870Gln | p.R870Q | Q9UBN7 | protein_coding | tolerated(0.48) | benign(0.033) | TCGA-AN-A046-01 | Breast | breast invasive carcinoma | Female | >=65 | I/II | Unknown | Unknown | SD |
| HDAC6 | SNV | Missense_Mutation | | c.1699N>T | p.Asp567Tyr | p.D567Y | Q9UBN7 | protein_coding | deleterious(0) | probably_damaging(0.914) | TCGA-AO-A0J5-01 | Breast | breast invasive carcinoma | Female | <65 | III/IV | Other, specify in notesBisphosphonate | zoledronic | PD |
| HDAC6 | SNV | Missense_Mutation | | c.379C>G | p.Arg127Gly | p.R127G | Q9UBN7 | protein_coding | deleterious(0) | possibly_damaging(0.773) | TCGA-AQ-A04J-01 | Breast | breast invasive carcinoma | Female | <65 | I/II | Chemotherapy | cytoxan | SD |
| HDAC6 | SNV | Missense_Mutation | | c.2518N>C | p.Glu840Gln | p.E840Q | Q9UBN7 | protein_coding | deleterious(0.03) | benign(0.113) | TCGA-AR-A0TX-01 | Breast | breast invasive carcinoma | Female | <65 | I/II | Unknown | Unknown | SD |
| HDAC6 | SNV | Missense_Mutation | | c.846N>T | p.Arg282Ser | p.R282S | Q9UBN7 | protein_coding | tolerated(0.77) | benign(0.038) | TCGA-AR-A24H-01 | Breast | breast invasive carcinoma | Female | >=65 | I/II | Hormone Therapy | tamoxiphen | SD |
| HDAC6 | SNV | Missense_Mutation | novel | c.208N>A | p.Gly70Arg | p.G70R | Q9UBN7 | protein_coding | deleterious(0.03) | benign(0.294) | TCGA-BH-A0BZ-01 | Breast | breast invasive carcinoma | Female | <65 | III/IV | Chemotherapy | doxorubicin | CR |
| HDAC6 | SNV | Missense_Mutation | rs781974625 | c.3181N>A | p.Glu1061Lys | p.E1061K | Q9UBN7 | protein_coding | tolerated(0.35) | benign(0) | TCGA-C8-A12P-01 | Breast | breast invasive carcinoma | Female | <65 | I/II | Unknown | Unknown | SD |
| HDAC6 | SNV | Missense_Mutation | rs782618133 | c.2021N>G | p.Tyr674Cys | p.Y674C | Q9UBN7 | protein_coding | deleterious(0) | probably_damaging(0.989) | TCGA-E9-A5FL-01 | Breast | breast invasive carcinoma | Female | >=65 | I/II | Unknown | Unknown | SD |
| Entrez ID | Symbol | Category | Interaction Types | Drug Claim Name | Drug Name | PMIDs |
| 10013 | HDAC6 | ENZYME, TRANSCRIPTION FACTOR, TRANSCRIPTION FACTOR BINDING, DRUGGABLE GENOME | | PMID28092474-Compound-32i | | |
| 10013 | HDAC6 | ENZYME, TRANSCRIPTION FACTOR, TRANSCRIPTION FACTOR BINDING, DRUGGABLE GENOME | | PMID29671355-Compound-28 | | |
| 10013 | HDAC6 | ENZYME, TRANSCRIPTION FACTOR, TRANSCRIPTION FACTOR BINDING, DRUGGABLE GENOME | | PMID29671355-Compound-9 | | |
| 10013 | HDAC6 | ENZYME, TRANSCRIPTION FACTOR, TRANSCRIPTION FACTOR BINDING, DRUGGABLE GENOME | | PMID29671355-Compound-14 | | |
| 10013 | HDAC6 | ENZYME, TRANSCRIPTION FACTOR, TRANSCRIPTION FACTOR BINDING, DRUGGABLE GENOME | | PRACINOSTAT | PRACINOSTAT | |
| 10013 | HDAC6 | ENZYME, TRANSCRIPTION FACTOR, TRANSCRIPTION FACTOR BINDING, DRUGGABLE GENOME | | PMID28092474-Compound-33p | | |
| 10013 | HDAC6 | ENZYME, TRANSCRIPTION FACTOR, TRANSCRIPTION FACTOR BINDING, DRUGGABLE GENOME | | BELINOSTAT | BELINOSTAT | 25937017 |
| 10013 | HDAC6 | ENZYME, TRANSCRIPTION FACTOR, TRANSCRIPTION FACTOR BINDING, DRUGGABLE GENOME | inhibitor | 187051807 | SCRIPTAID | |
| 10013 | HDAC6 | ENZYME, TRANSCRIPTION FACTOR, TRANSCRIPTION FACTOR BINDING, DRUGGABLE GENOME | inhibitor | 187051792 | PANOBINOSTAT | |
| 10013 | HDAC6 | ENZYME, TRANSCRIPTION FACTOR, TRANSCRIPTION FACTOR BINDING, DRUGGABLE GENOME | inhibitor | 249565599 | | |


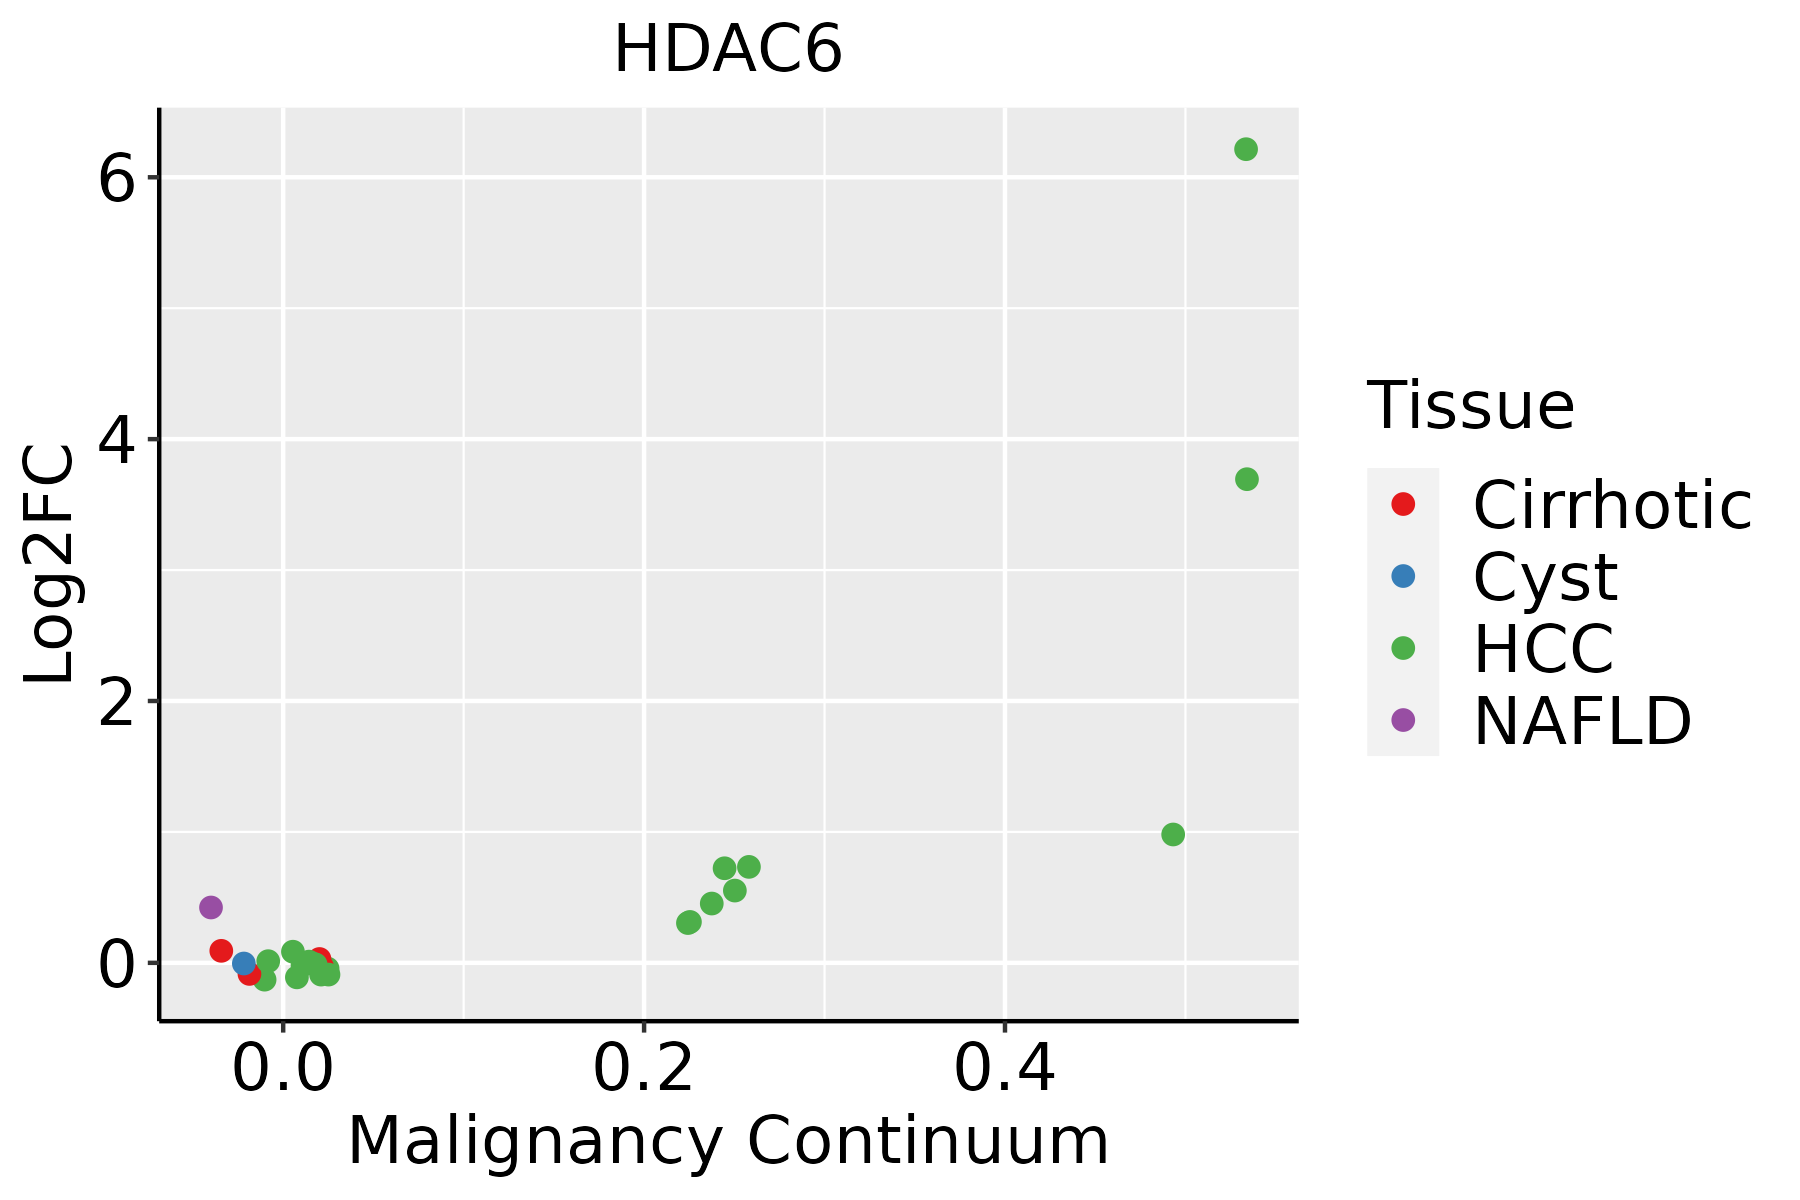
 Identification of the aberrant gene expression in precancerous and cancerous lesions by comparing the gene expression of stem-like cells in diseased tissues with normal stem cells
 Find out the enriched GO biological processes and KEGG pathways involved in transition from healthy to precancer to cancer


 Identification of potential cell-cell interactions between two cell types and their ligand-receptor pairs for different disease states
 Find out the significant the regulons (TFs) and the target genes of each regulon across cell types for different disease states
 Annotation of somatic variants for genes involved in malignant transformation
 Identification of chemicals and drugs interact with genes involved in malignant transfromation


