
|
|||||
|
 | |
| |
| |
| |
| |
| |
|
Gene: HDAC5 |
Gene summary for HDAC5 |
| Gene information | Species | Human | Gene symbol | HDAC5 | Gene ID | 10014 |
| Gene name | histone deacetylase 5 | |
| Gene Alias | HD5 | |
| Cytomap | 17q21.31 | |
| Gene Type | protein-coding | GO ID | GO:0000122 | UniProtAcc | Q9UQL6 |
Top |
Malignant transformation analysis |
| Identification of the aberrant gene expression in precancerous and cancerous lesions by comparing the gene expression of stem-like cells in diseased tissues with normal stem cells |
| Entrez ID | Symbol | Replicates | Species | Organ | Tissue | Adj P-value | Log2FC | Malignancy |
| 10014 | HDAC5 | LZE4T | Human | Esophagus | ESCC | 1.49e-06 | 4.44e-02 | 0.0811 |
| 10014 | HDAC5 | LZE8T | Human | Esophagus | ESCC | 4.61e-02 | -7.03e-02 | 0.067 |
| 10014 | HDAC5 | LZE24T | Human | Esophagus | ESCC | 5.63e-17 | 4.56e-01 | 0.0596 |
| 10014 | HDAC5 | LZE21T | Human | Esophagus | ESCC | 1.82e-02 | 1.54e-01 | 0.0655 |
| 10014 | HDAC5 | LZE6T | Human | Esophagus | ESCC | 7.32e-03 | 1.99e-02 | 0.0845 |
| 10014 | HDAC5 | P1T-E | Human | Esophagus | ESCC | 3.68e-10 | 2.79e-01 | 0.0875 |
| 10014 | HDAC5 | P2T-E | Human | Esophagus | ESCC | 7.42e-13 | 1.59e-01 | 0.1177 |
| 10014 | HDAC5 | P4T-E | Human | Esophagus | ESCC | 5.16e-14 | 6.07e-02 | 0.1323 |
| 10014 | HDAC5 | P5T-E | Human | Esophagus | ESCC | 1.27e-09 | -5.80e-03 | 0.1327 |
| 10014 | HDAC5 | P8T-E | Human | Esophagus | ESCC | 5.05e-14 | 1.76e-01 | 0.0889 |
| 10014 | HDAC5 | P9T-E | Human | Esophagus | ESCC | 6.89e-11 | 6.59e-02 | 0.1131 |
| 10014 | HDAC5 | P10T-E | Human | Esophagus | ESCC | 3.55e-08 | -3.84e-02 | 0.116 |
| 10014 | HDAC5 | P11T-E | Human | Esophagus | ESCC | 1.98e-09 | 1.81e-01 | 0.1426 |
| 10014 | HDAC5 | P12T-E | Human | Esophagus | ESCC | 9.40e-26 | 3.65e-01 | 0.1122 |
| 10014 | HDAC5 | P15T-E | Human | Esophagus | ESCC | 7.44e-13 | 2.32e-01 | 0.1149 |
| 10014 | HDAC5 | P16T-E | Human | Esophagus | ESCC | 5.19e-18 | 2.01e-01 | 0.1153 |
| 10014 | HDAC5 | P19T-E | Human | Esophagus | ESCC | 1.19e-02 | 2.37e-01 | 0.1662 |
| 10014 | HDAC5 | P20T-E | Human | Esophagus | ESCC | 3.47e-04 | 5.82e-02 | 0.1124 |
| 10014 | HDAC5 | P21T-E | Human | Esophagus | ESCC | 1.27e-08 | 1.66e-01 | 0.1617 |
| 10014 | HDAC5 | P22T-E | Human | Esophagus | ESCC | 4.70e-07 | 4.17e-02 | 0.1236 |
| Page: 1 2 3 4 5 |
| Tissue | Expression Dynamics | Abbreviation |
| Esophagus | 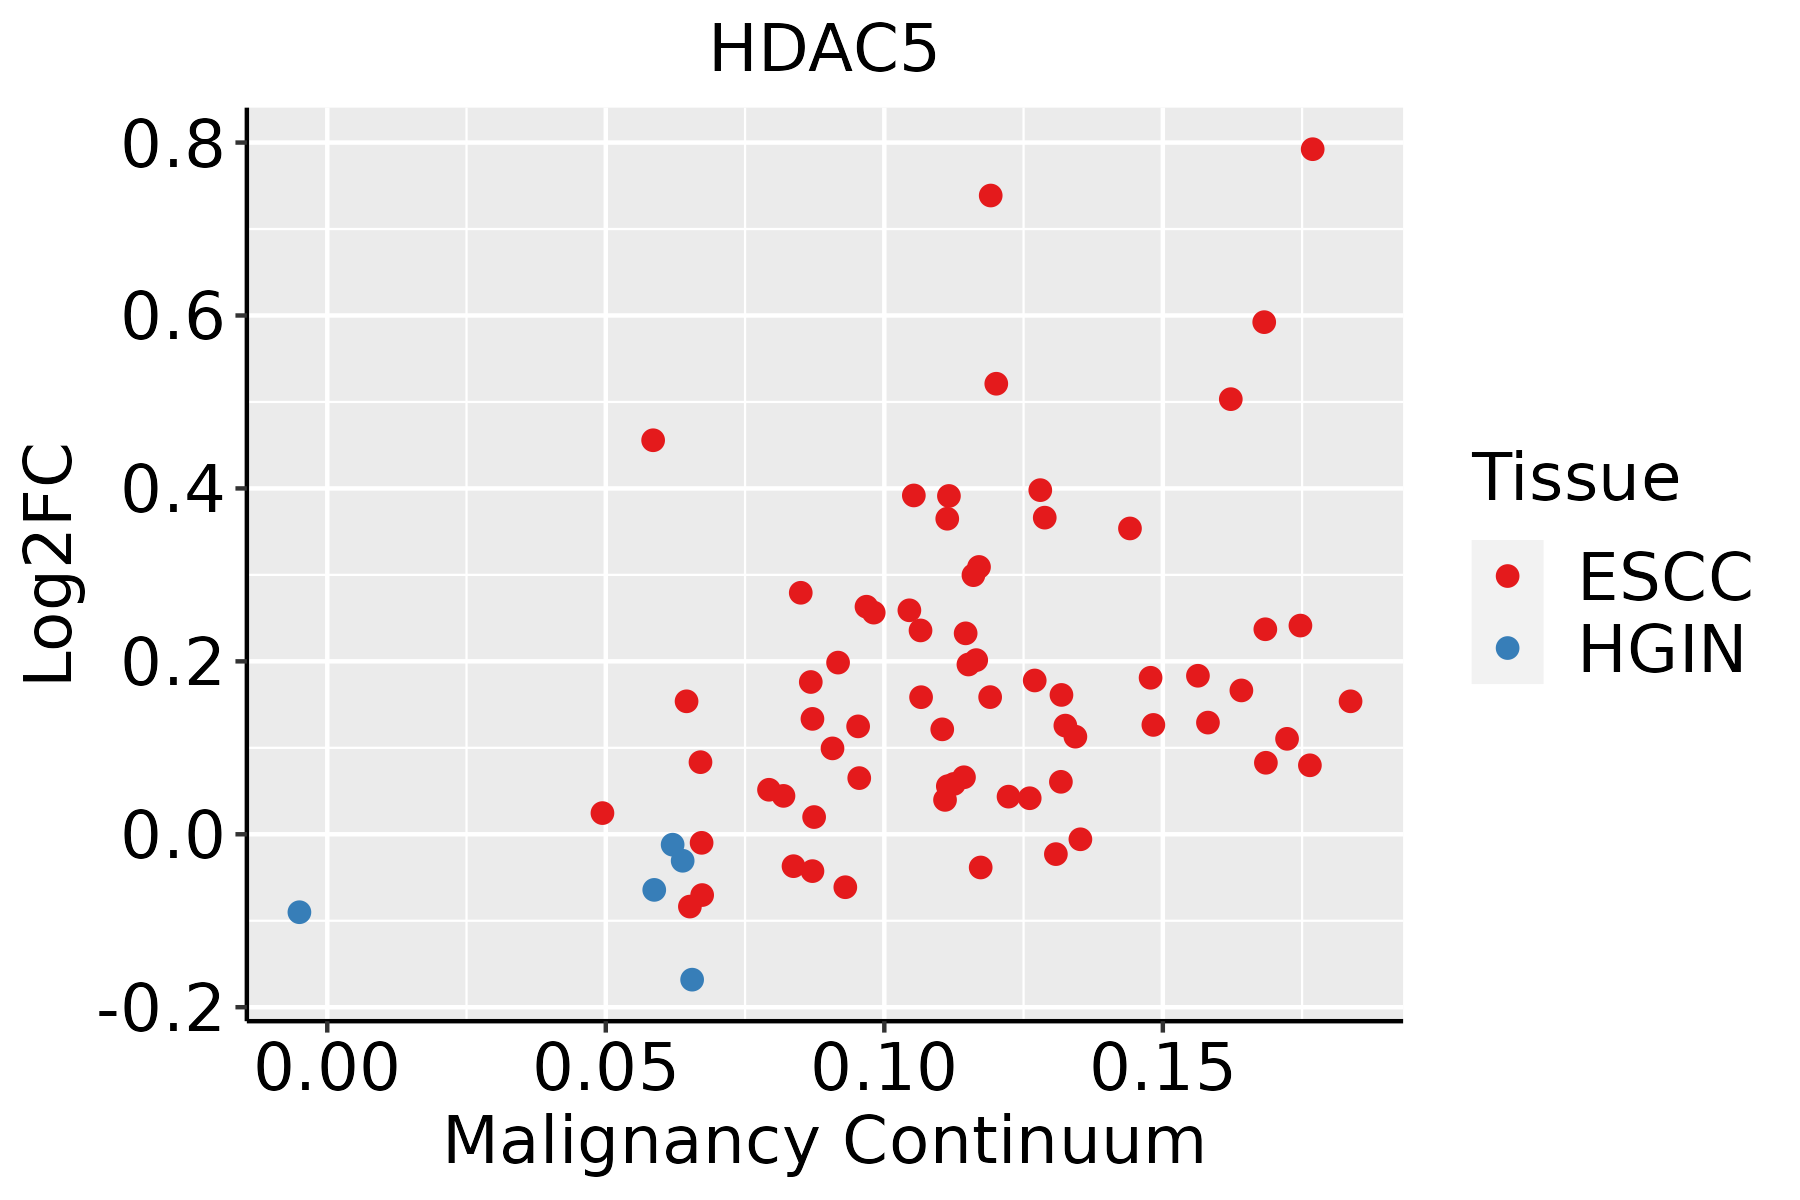 | ESCC: Esophageal squamous cell carcinoma |
| HGIN: High-grade intraepithelial neoplasias | ||
| LGIN: Low-grade intraepithelial neoplasias | ||
| Liver | 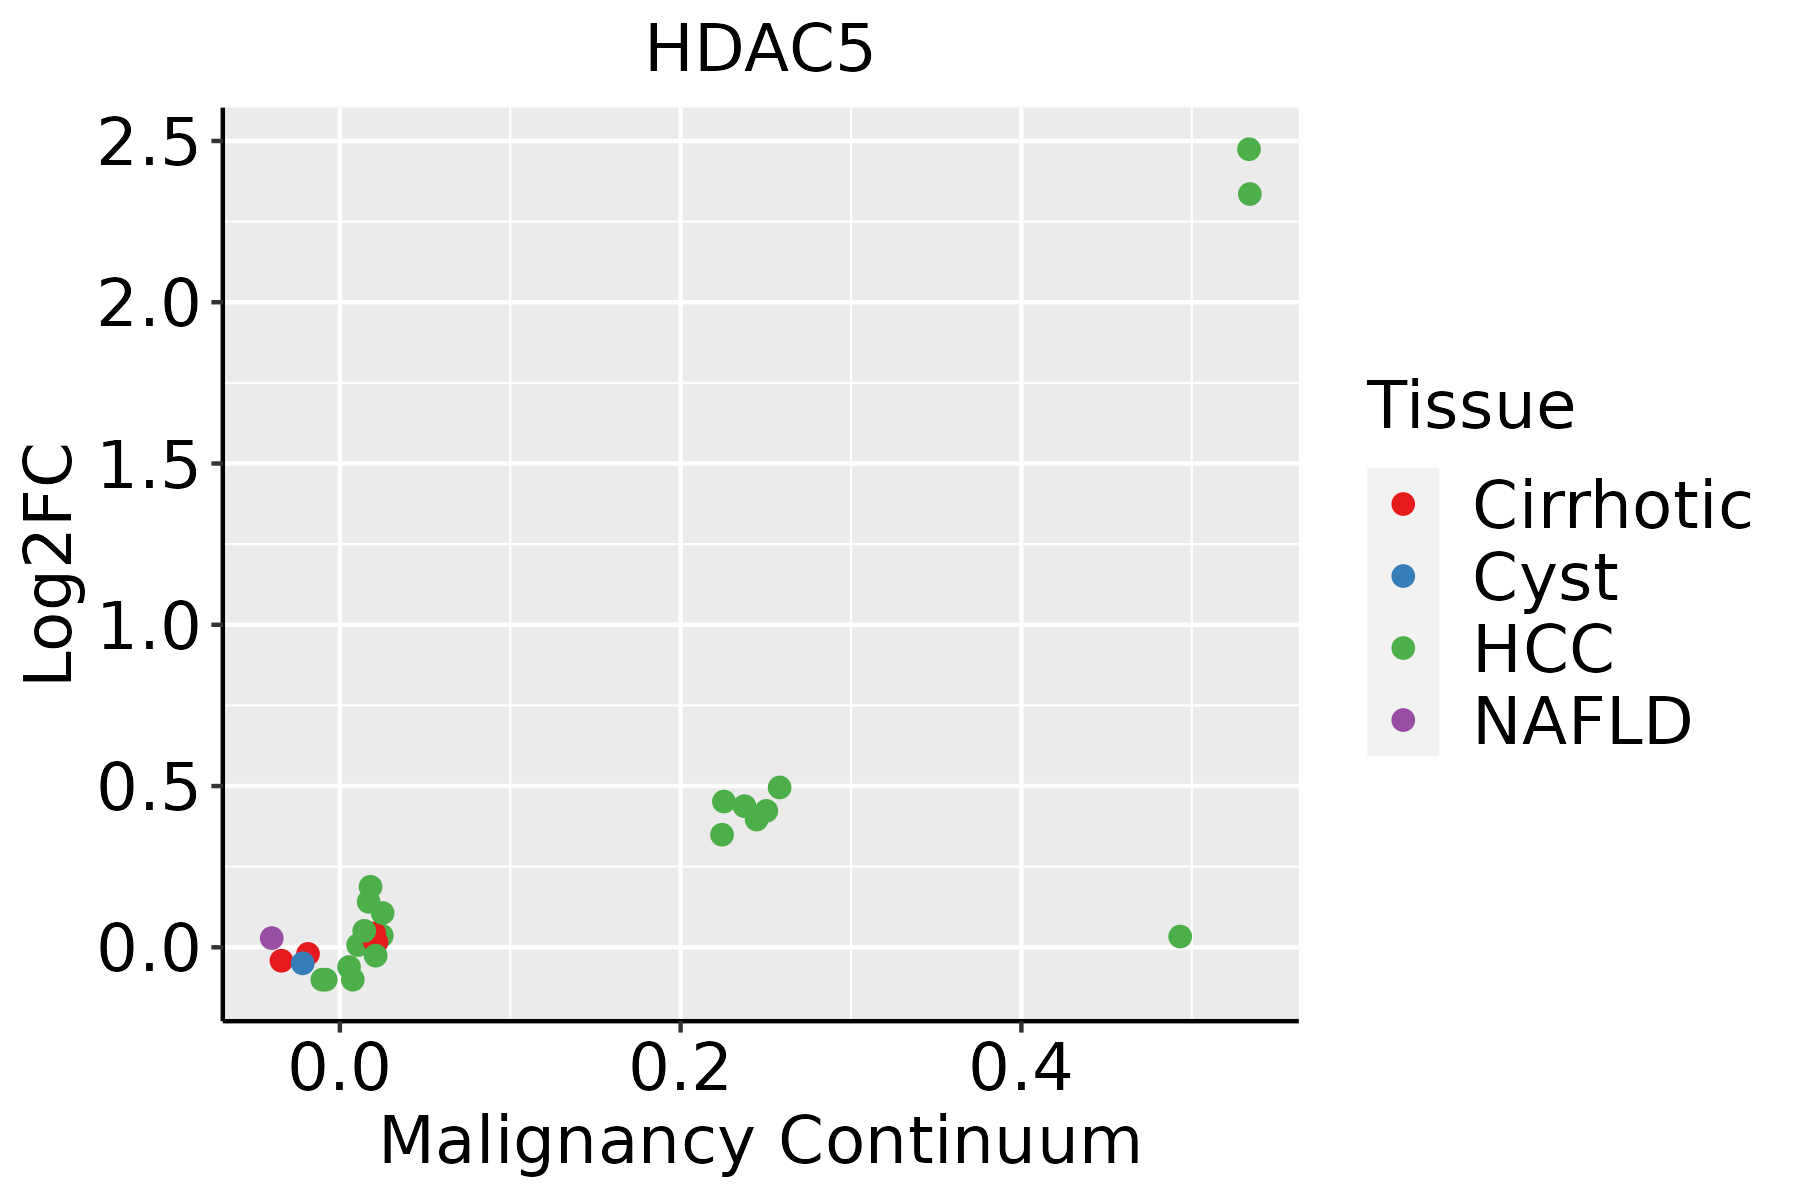 | HCC: Hepatocellular carcinoma |
| NAFLD: Non-alcoholic fatty liver disease | ||
| Oral Cavity | 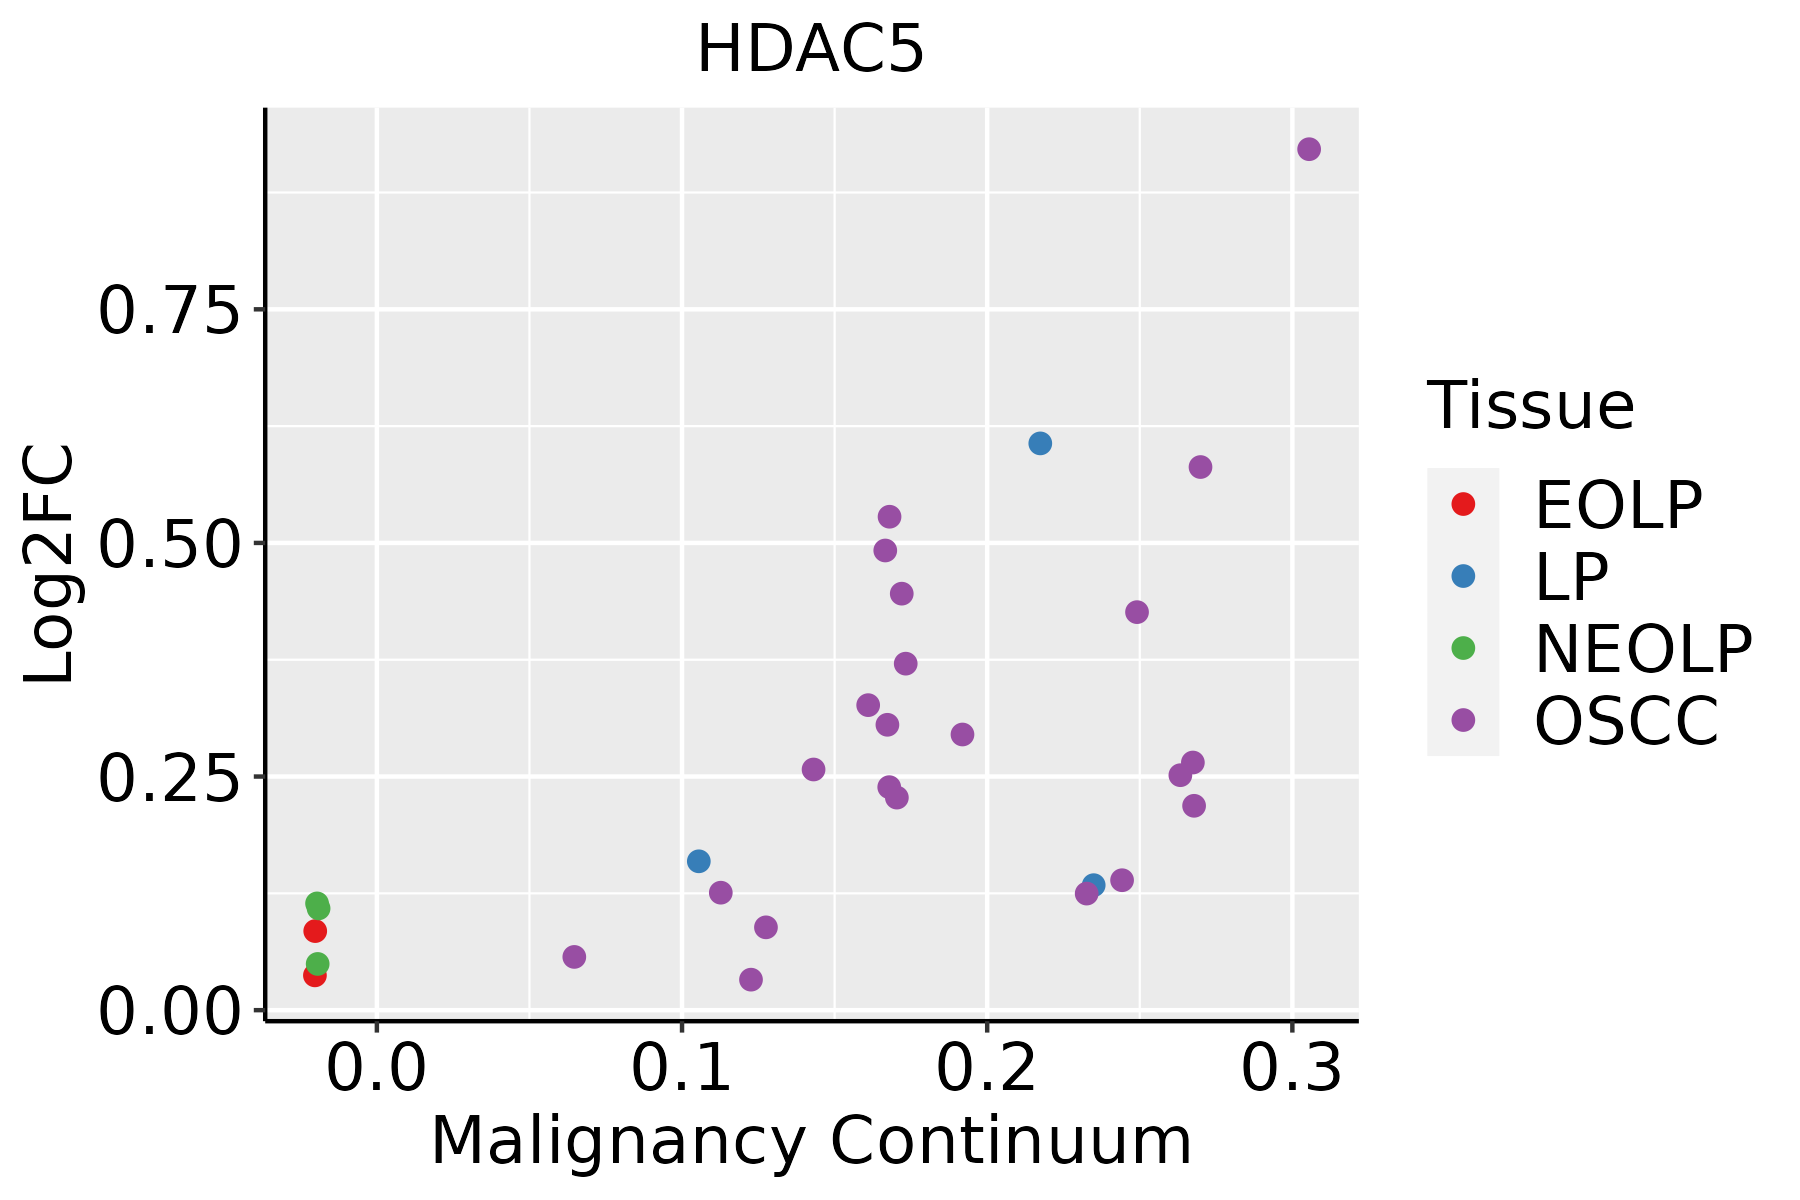 | EOLP: Erosive Oral lichen planus |
| LP: leukoplakia | ||
| NEOLP: Non-erosive oral lichen planus | ||
| OSCC: Oral squamous cell carcinoma |
| ∗log2FC in expression of this searched gene in stem-like cells from each diseased tissue sample relative to stem-like cells in normal samples in each tissue plotted against the malignancy continuum. Samples are colored based on if they are from different disease stage. |
Top |
Malignant transformation related pathway analysis |
| Find out the enriched GO biological processes and KEGG pathways involved in transition from healthy to precancer to cancer |
| Tissue | Disease Stage | Enriched GO biological Processes |
| Colorectum | AD |  |
| Colorectum | SER |  |
| Colorectum | MSS |  |
| Colorectum | MSI-H |  |
| Colorectum | FAP |  |
| ∗Top 15 enriched GO BP terms are showed in the bar plot of each disease state in each tissue. Each row represents a significant GO biological process which is colored according to the -log10(p.adjust). |
| Page: 1 2 3 4 5 6 7 8 9 |
| GO ID | Tissue | Disease Stage | Description | Gene Ratio | Bg Ratio | pvalue | p.adjust | Count |
| GO:001657015 | Esophagus | ESCC | histone modification | 323/8552 | 463/18723 | 2.61e-26 | 7.88e-24 | 323 |
| GO:0051098111 | Esophagus | ESCC | regulation of binding | 251/8552 | 363/18723 | 6.73e-20 | 8.46e-18 | 251 |
| GO:004339320 | Esophagus | ESCC | regulation of protein binding | 135/8552 | 196/18723 | 3.69e-11 | 1.22e-09 | 135 |
| GO:000632517 | Esophagus | ESCC | chromatin organization | 240/8552 | 409/18723 | 6.52e-08 | 1.14e-06 | 240 |
| GO:00356015 | Esophagus | ESCC | protein deacylation | 79/8552 | 112/18723 | 8.30e-08 | 1.42e-06 | 79 |
| GO:00400295 | Esophagus | ESCC | regulation of gene expression, epigenetic | 74/8552 | 105/18723 | 2.24e-07 | 3.42e-06 | 74 |
| GO:00987325 | Esophagus | ESCC | macromolecule deacylation | 80/8552 | 116/18723 | 3.19e-07 | 4.50e-06 | 80 |
| GO:00165754 | Esophagus | ESCC | histone deacetylation | 60/8552 | 82/18723 | 3.85e-07 | 5.32e-06 | 60 |
| GO:00510908 | Esophagus | ESCC | regulation of DNA-binding transcription factor activity | 252/8552 | 440/18723 | 5.22e-07 | 6.97e-06 | 252 |
| GO:00064765 | Esophagus | ESCC | protein deacetylation | 70/8552 | 101/18723 | 1.29e-06 | 1.58e-05 | 70 |
| GO:190165319 | Esophagus | ESCC | cellular response to peptide | 208/8552 | 359/18723 | 1.68e-06 | 2.01e-05 | 208 |
| GO:00510918 | Esophagus | ESCC | positive regulation of DNA-binding transcription factor activity | 155/8552 | 260/18723 | 3.83e-06 | 4.14e-05 | 155 |
| GO:0043434111 | Esophagus | ESCC | response to peptide hormone | 234/8552 | 414/18723 | 4.93e-06 | 5.21e-05 | 234 |
| GO:003286918 | Esophagus | ESCC | cellular response to insulin stimulus | 124/8552 | 203/18723 | 6.63e-06 | 6.75e-05 | 124 |
| GO:003286818 | Esophagus | ESCC | response to insulin | 156/8552 | 264/18723 | 7.21e-06 | 7.20e-05 | 156 |
| GO:007137516 | Esophagus | ESCC | cellular response to peptide hormone stimulus | 166/8552 | 290/18723 | 4.48e-05 | 3.55e-04 | 166 |
| GO:19031317 | Esophagus | ESCC | mononuclear cell differentiation | 226/8552 | 426/18723 | 1.20e-03 | 5.88e-03 | 226 |
| GO:000166720 | Esophagus | ESCC | ameboidal-type cell migration | 250/8552 | 475/18723 | 1.22e-03 | 5.97e-03 | 250 |
| GO:001063120 | Esophagus | ESCC | epithelial cell migration | 187/8552 | 357/18723 | 6.05e-03 | 2.23e-02 | 187 |
| GO:009013220 | Esophagus | ESCC | epithelium migration | 188/8552 | 360/18723 | 6.96e-03 | 2.54e-02 | 188 |
| Page: 1 2 3 4 |
| Pathway ID | Tissue | Disease Stage | Description | Gene Ratio | Bg Ratio | pvalue | p.adjust | qvalue | Count |
| hsa0520325 | Esophagus | ESCC | Viral carcinogenesis | 137/4205 | 204/8465 | 2.47e-07 | 1.88e-06 | 9.62e-07 | 137 |
| hsa0520335 | Esophagus | ESCC | Viral carcinogenesis | 137/4205 | 204/8465 | 2.47e-07 | 1.88e-06 | 9.62e-07 | 137 |
| hsa052032 | Liver | HCC | Viral carcinogenesis | 117/4020 | 204/8465 | 2.68e-03 | 8.98e-03 | 5.00e-03 | 117 |
| hsa052033 | Liver | HCC | Viral carcinogenesis | 117/4020 | 204/8465 | 2.68e-03 | 8.98e-03 | 5.00e-03 | 117 |
| hsa052038 | Oral cavity | OSCC | Viral carcinogenesis | 124/3704 | 204/8465 | 5.57e-07 | 3.28e-06 | 1.67e-06 | 124 |
| hsa0520314 | Oral cavity | OSCC | Viral carcinogenesis | 124/3704 | 204/8465 | 5.57e-07 | 3.28e-06 | 1.67e-06 | 124 |
| Page: 1 |
Top |
Cell-cell communication analysis |
| Identification of potential cell-cell interactions between two cell types and their ligand-receptor pairs for different disease states |
| Ligand | Receptor | LRpair | Pathway | Tissue | Disease Stage |
| Page: 1 |
Top |
Single-cell gene regulatory network inference analysis |
| Find out the significant the regulons (TFs) and the target genes of each regulon across cell types for different disease states |
| TF | Cell Type | Tissue | Disease Stage | Target Gene | RSS | Regulon Activity |
| ∗The dot plots of a searched regulon are shown for all cell subpopulations in each disease state of each tissue based on the regulon specific score inferred using pySCENIC and by calculating the average expression. |
| Page: 1 |
Top |
Somatic mutation of malignant transformation related genes |
| Annotation of somatic variants for genes involved in malignant transformation |
| Hugo Symbol | Variant Class | Variant Classification | dbSNP RS | HGVSc | HGVSp | HGVSp Short | SWISSPROT | BIOTYPE | SIFT | PolyPhen | Tumor Sample Barcode | Tissue | Histology | Sex | Age | Stage | Therapy Types | Drugs | Outcome |
| HDAC5 | SNV | Missense_Mutation | c.155N>A | p.Gly52Glu | p.G52E | Q9UQL6 | protein_coding | tolerated_low_confidence(0.31) | probably_damaging(0.998) | TCGA-AR-A0U3-01 | Breast | breast invasive carcinoma | Female | <65 | I/II | Chemotherapy | doxorubicin | SD | |
| HDAC5 | SNV | Missense_Mutation | c.1703N>A | p.Gly568Glu | p.G568E | Q9UQL6 | protein_coding | tolerated(0.29) | benign(0) | TCGA-BH-A0W7-01 | Breast | breast invasive carcinoma | Female | <65 | I/II | Chemotherapy | taxotere | CR | |
| HDAC5 | SNV | Missense_Mutation | novel | c.1853N>T | p.Pro618Leu | p.P618L | Q9UQL6 | protein_coding | tolerated(0.24) | probably_damaging(0.948) | TCGA-D8-A142-01 | Breast | breast invasive carcinoma | Female | >=65 | I/II | Chemotherapy | cyclophosphamid | SD |
| HDAC5 | SNV | Missense_Mutation | rs760938209 | c.1268N>T | p.Ser423Phe | p.S423F | Q9UQL6 | protein_coding | tolerated(0.72) | possibly_damaging(0.827) | TCGA-D8-A1XJ-01 | Breast | breast invasive carcinoma | Female | >=65 | III/IV | Hormone Therapy | tamoxiphen | SD |
| HDAC5 | insertion | Frame_Shift_Ins | novel | c.1549_1550insT | p.Gln517LeufsTer35 | p.Q517Lfs*35 | Q9UQL6 | protein_coding | TCGA-A2-A0EX-01 | Breast | breast invasive carcinoma | Female | <65 | I/II | Hormone Therapy | tamoxiphen | SD | ||
| HDAC5 | SNV | Missense_Mutation | novel | c.2684N>A | p.Arg895His | p.R895H | Q9UQL6 | protein_coding | deleterious(0) | probably_damaging(0.999) | TCGA-2W-A8YY-01 | Cervix | cervical & endocervical cancer | Female | <65 | I/II | Chemotherapy | cisplatin | CR |
| HDAC5 | SNV | Missense_Mutation | novel | c.754N>A | p.Asp252Asn | p.D252N | Q9UQL6 | protein_coding | deleterious(0.02) | probably_damaging(0.994) | TCGA-2W-A8YY-01 | Cervix | cervical & endocervical cancer | Female | <65 | I/II | Chemotherapy | cisplatin | CR |
| HDAC5 | SNV | Missense_Mutation | c.2560N>G | p.Lys854Glu | p.K854E | Q9UQL6 | protein_coding | deleterious(0) | benign(0.303) | TCGA-FU-A3HZ-01 | Cervix | cervical & endocervical cancer | Female | <65 | I/II | Chemotherapy | cisplatin | CR | |
| HDAC5 | SNV | Missense_Mutation | c.287N>C | p.Phe96Ser | p.F96S | Q9UQL6 | protein_coding | deleterious(0) | probably_damaging(0.986) | TCGA-FU-A3HZ-01 | Cervix | cervical & endocervical cancer | Female | <65 | I/II | Chemotherapy | cisplatin | CR | |
| HDAC5 | SNV | Missense_Mutation | novel | c.3064N>A | p.Ala1022Thr | p.A1022T | Q9UQL6 | protein_coding | deleterious(0.04) | possibly_damaging(0.499) | TCGA-MY-A913-01 | Cervix | cervical & endocervical cancer | Female | <65 | I/II | Chemotherapy | cisplatin | CR |
| Page: 1 2 3 4 5 6 7 8 9 |
Top |
Related drugs of malignant transformation related genes |
| Identification of chemicals and drugs interact with genes involved in malignant transfromation |
| (DGIdb 4.0) |
| Entrez ID | Symbol | Category | Interaction Types | Drug Claim Name | Drug Name | PMIDs |
| 10014 | HDAC5 | TRANSCRIPTION FACTOR, ENZYME, DRUGGABLE GENOME, TRANSCRIPTION FACTOR BINDING | RESMINOSTAT | RESMINOSTAT | ||
| 10014 | HDAC5 | TRANSCRIPTION FACTOR, ENZYME, DRUGGABLE GENOME, TRANSCRIPTION FACTOR BINDING | inhibitor | SB939 | ||
| 10014 | HDAC5 | TRANSCRIPTION FACTOR, ENZYME, DRUGGABLE GENOME, TRANSCRIPTION FACTOR BINDING | inhibitor | GIVINOSTAT | GIVINOSTAT | |
| 10014 | HDAC5 | TRANSCRIPTION FACTOR, ENZYME, DRUGGABLE GENOME, TRANSCRIPTION FACTOR BINDING | ENTINOSTAT | ENTINOSTAT | 19966789,20491440 | |
| 10014 | HDAC5 | TRANSCRIPTION FACTOR, ENZYME, DRUGGABLE GENOME, TRANSCRIPTION FACTOR BINDING | PMID29671355-Compound-62 | |||
| 10014 | HDAC5 | TRANSCRIPTION FACTOR, ENZYME, DRUGGABLE GENOME, TRANSCRIPTION FACTOR BINDING | BUTANOIC ACID | BUTANOIC ACID | 19053749 | |
| 10014 | HDAC5 | TRANSCRIPTION FACTOR, ENZYME, DRUGGABLE GENOME, TRANSCRIPTION FACTOR BINDING | MOCETINOSTAT | MOCETINOSTAT | 23829483,26287310 | |
| 10014 | HDAC5 | TRANSCRIPTION FACTOR, ENZYME, DRUGGABLE GENOME, TRANSCRIPTION FACTOR BINDING | PMID29671355-Compound-31 | |||
| 10014 | HDAC5 | TRANSCRIPTION FACTOR, ENZYME, DRUGGABLE GENOME, TRANSCRIPTION FACTOR BINDING | CUDC-101 | CUDC-101 | ||
| 10014 | HDAC5 | TRANSCRIPTION FACTOR, ENZYME, DRUGGABLE GENOME, TRANSCRIPTION FACTOR BINDING | inhibitor | CHEMBL3545368 | PANOBINOSTAT LACTATE |
| Page: 1 2 3 4 5 6 7 |

Copyright 2023-Present -The University of Texas Health Science Center at Houston |