
|
|||||
|
 | |
| |
| |
| |
| |
| |
|
Gene: HDAC3 |
Gene summary for HDAC3 |
| Gene information | Species | Human | Gene symbol | HDAC3 | Gene ID | 8841 |
| Gene name | histone deacetylase 3 | |
| Gene Alias | HD3 | |
| Cytomap | 5q31.3 | |
| Gene Type | protein-coding | GO ID | GO:0000122 | UniProtAcc | O15379 |
Top |
Malignant transformation analysis |
| Identification of the aberrant gene expression in precancerous and cancerous lesions by comparing the gene expression of stem-like cells in diseased tissues with normal stem cells |
| Entrez ID | Symbol | Replicates | Species | Organ | Tissue | Adj P-value | Log2FC | Malignancy |
| 8841 | HDAC3 | LZE4T | Human | Esophagus | ESCC | 7.39e-08 | 8.01e-02 | 0.0811 |
| 8841 | HDAC3 | LZE7T | Human | Esophagus | ESCC | 4.69e-07 | 2.83e-01 | 0.0667 |
| 8841 | HDAC3 | LZE8T | Human | Esophagus | ESCC | 1.78e-05 | 1.33e-01 | 0.067 |
| 8841 | HDAC3 | LZE22T | Human | Esophagus | ESCC | 1.20e-03 | 2.83e-01 | 0.068 |
| 8841 | HDAC3 | LZE24T | Human | Esophagus | ESCC | 2.80e-15 | 4.39e-01 | 0.0596 |
| 8841 | HDAC3 | LZE21T | Human | Esophagus | ESCC | 1.73e-02 | 2.55e-01 | 0.0655 |
| 8841 | HDAC3 | LZE6T | Human | Esophagus | ESCC | 3.69e-02 | 1.78e-01 | 0.0845 |
| 8841 | HDAC3 | P1T-E | Human | Esophagus | ESCC | 7.67e-11 | 4.53e-01 | 0.0875 |
| 8841 | HDAC3 | P2T-E | Human | Esophagus | ESCC | 3.34e-44 | 7.66e-01 | 0.1177 |
| 8841 | HDAC3 | P4T-E | Human | Esophagus | ESCC | 2.30e-18 | 4.63e-01 | 0.1323 |
| 8841 | HDAC3 | P5T-E | Human | Esophagus | ESCC | 5.93e-25 | 4.47e-01 | 0.1327 |
| 8841 | HDAC3 | P8T-E | Human | Esophagus | ESCC | 2.30e-21 | 2.16e-01 | 0.0889 |
| 8841 | HDAC3 | P9T-E | Human | Esophagus | ESCC | 1.33e-20 | 2.69e-01 | 0.1131 |
| 8841 | HDAC3 | P10T-E | Human | Esophagus | ESCC | 2.27e-26 | 4.60e-01 | 0.116 |
| 8841 | HDAC3 | P11T-E | Human | Esophagus | ESCC | 1.68e-14 | 6.25e-01 | 0.1426 |
| 8841 | HDAC3 | P12T-E | Human | Esophagus | ESCC | 3.87e-44 | 8.30e-01 | 0.1122 |
| 8841 | HDAC3 | P15T-E | Human | Esophagus | ESCC | 7.74e-20 | 6.12e-01 | 0.1149 |
| 8841 | HDAC3 | P16T-E | Human | Esophagus | ESCC | 1.76e-24 | 4.09e-01 | 0.1153 |
| 8841 | HDAC3 | P17T-E | Human | Esophagus | ESCC | 6.15e-05 | 4.15e-01 | 0.1278 |
| 8841 | HDAC3 | P19T-E | Human | Esophagus | ESCC | 2.70e-05 | 7.67e-01 | 0.1662 |
| Page: 1 2 3 4 5 6 |
| Tissue | Expression Dynamics | Abbreviation |
| Esophagus | 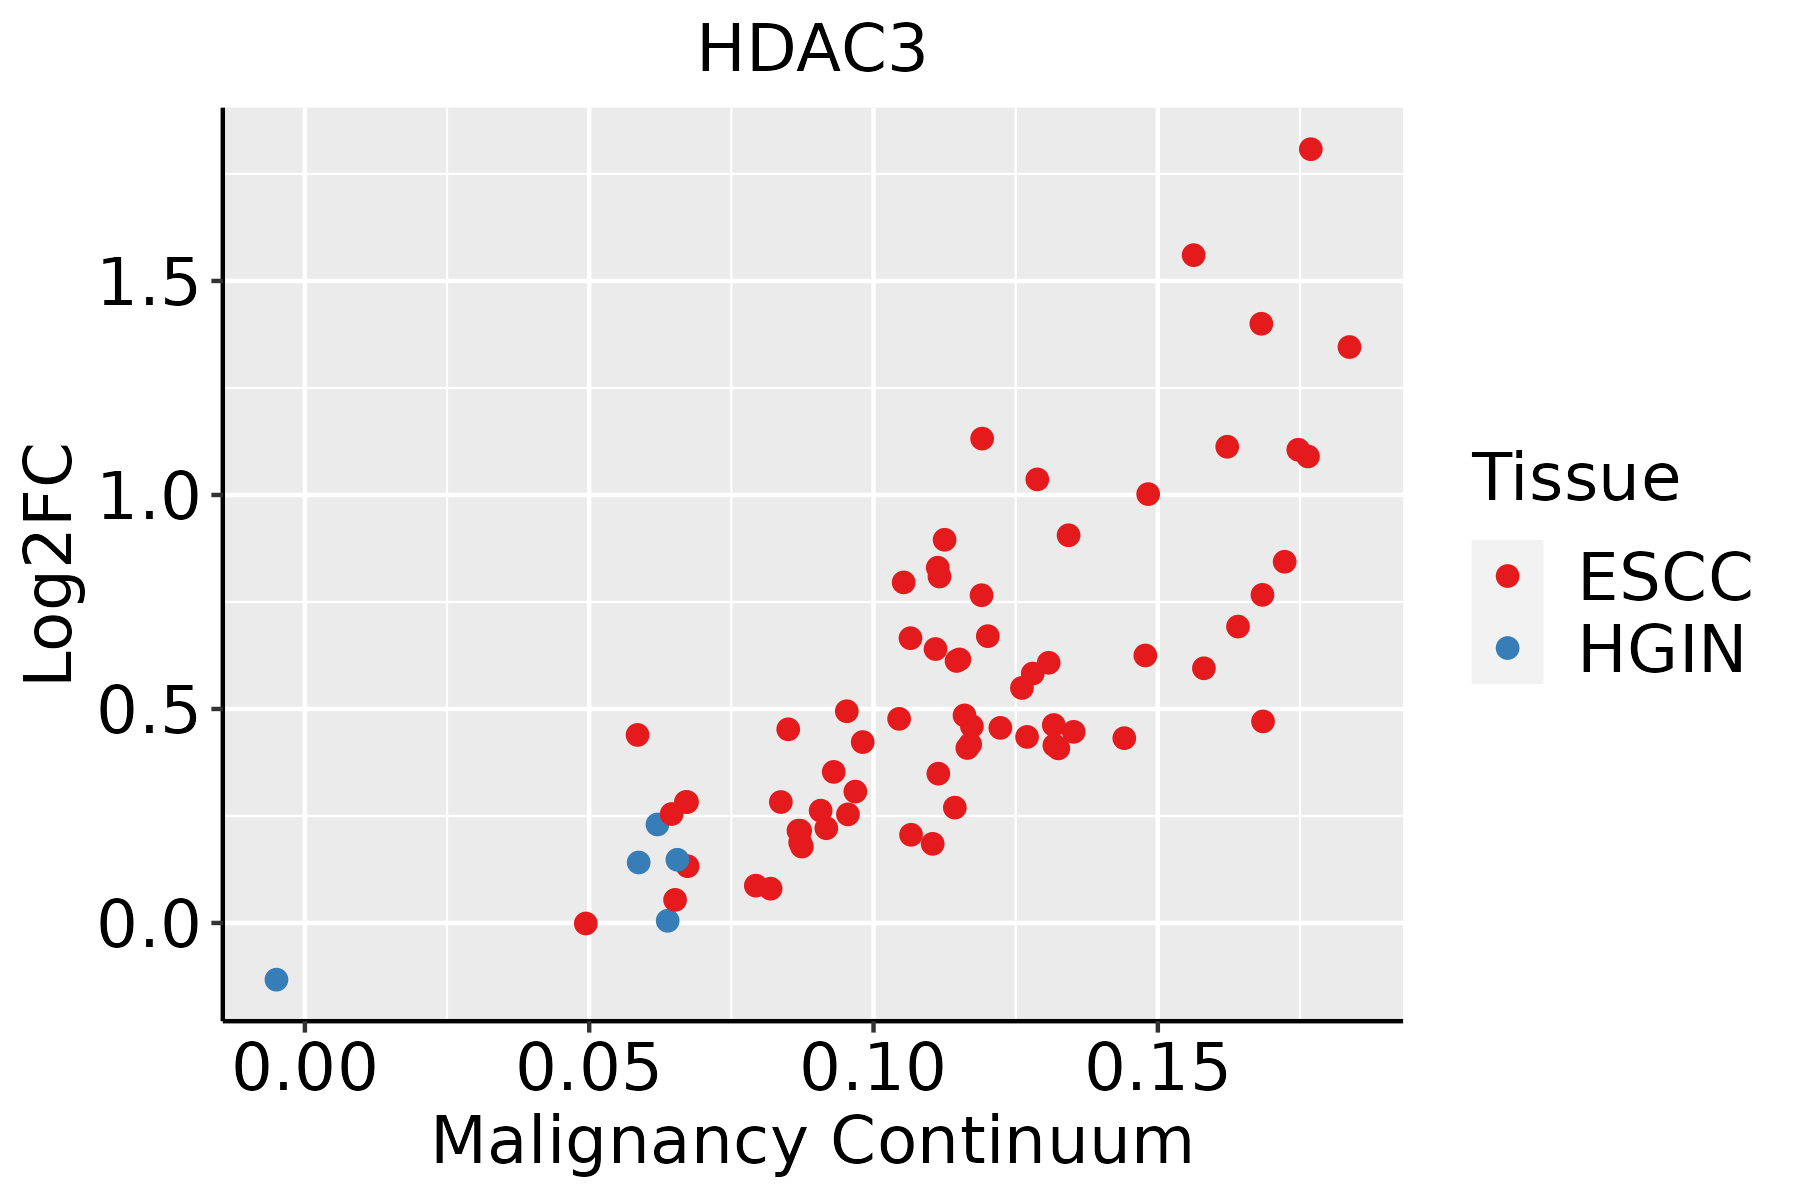 | ESCC: Esophageal squamous cell carcinoma |
| HGIN: High-grade intraepithelial neoplasias | ||
| LGIN: Low-grade intraepithelial neoplasias | ||
| Liver | 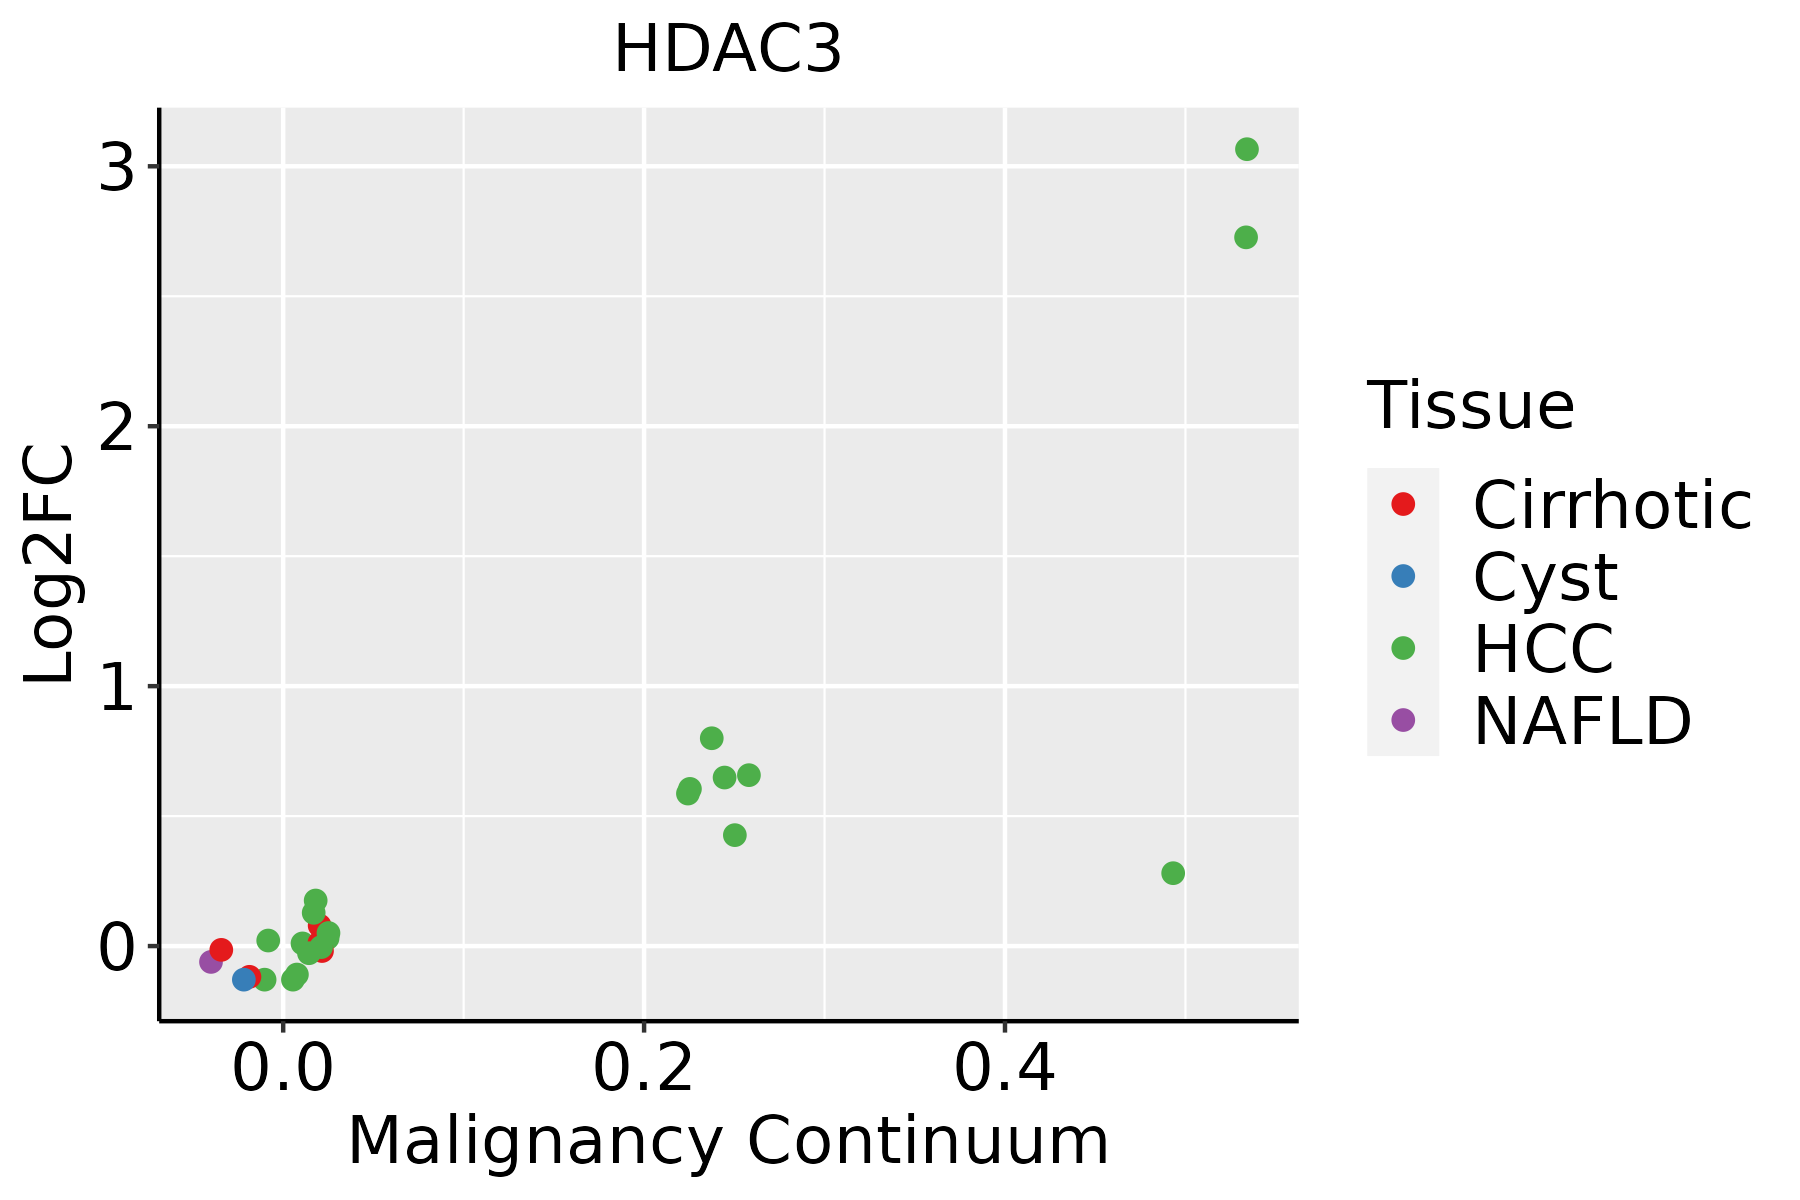 | HCC: Hepatocellular carcinoma |
| NAFLD: Non-alcoholic fatty liver disease | ||
| Oral Cavity | 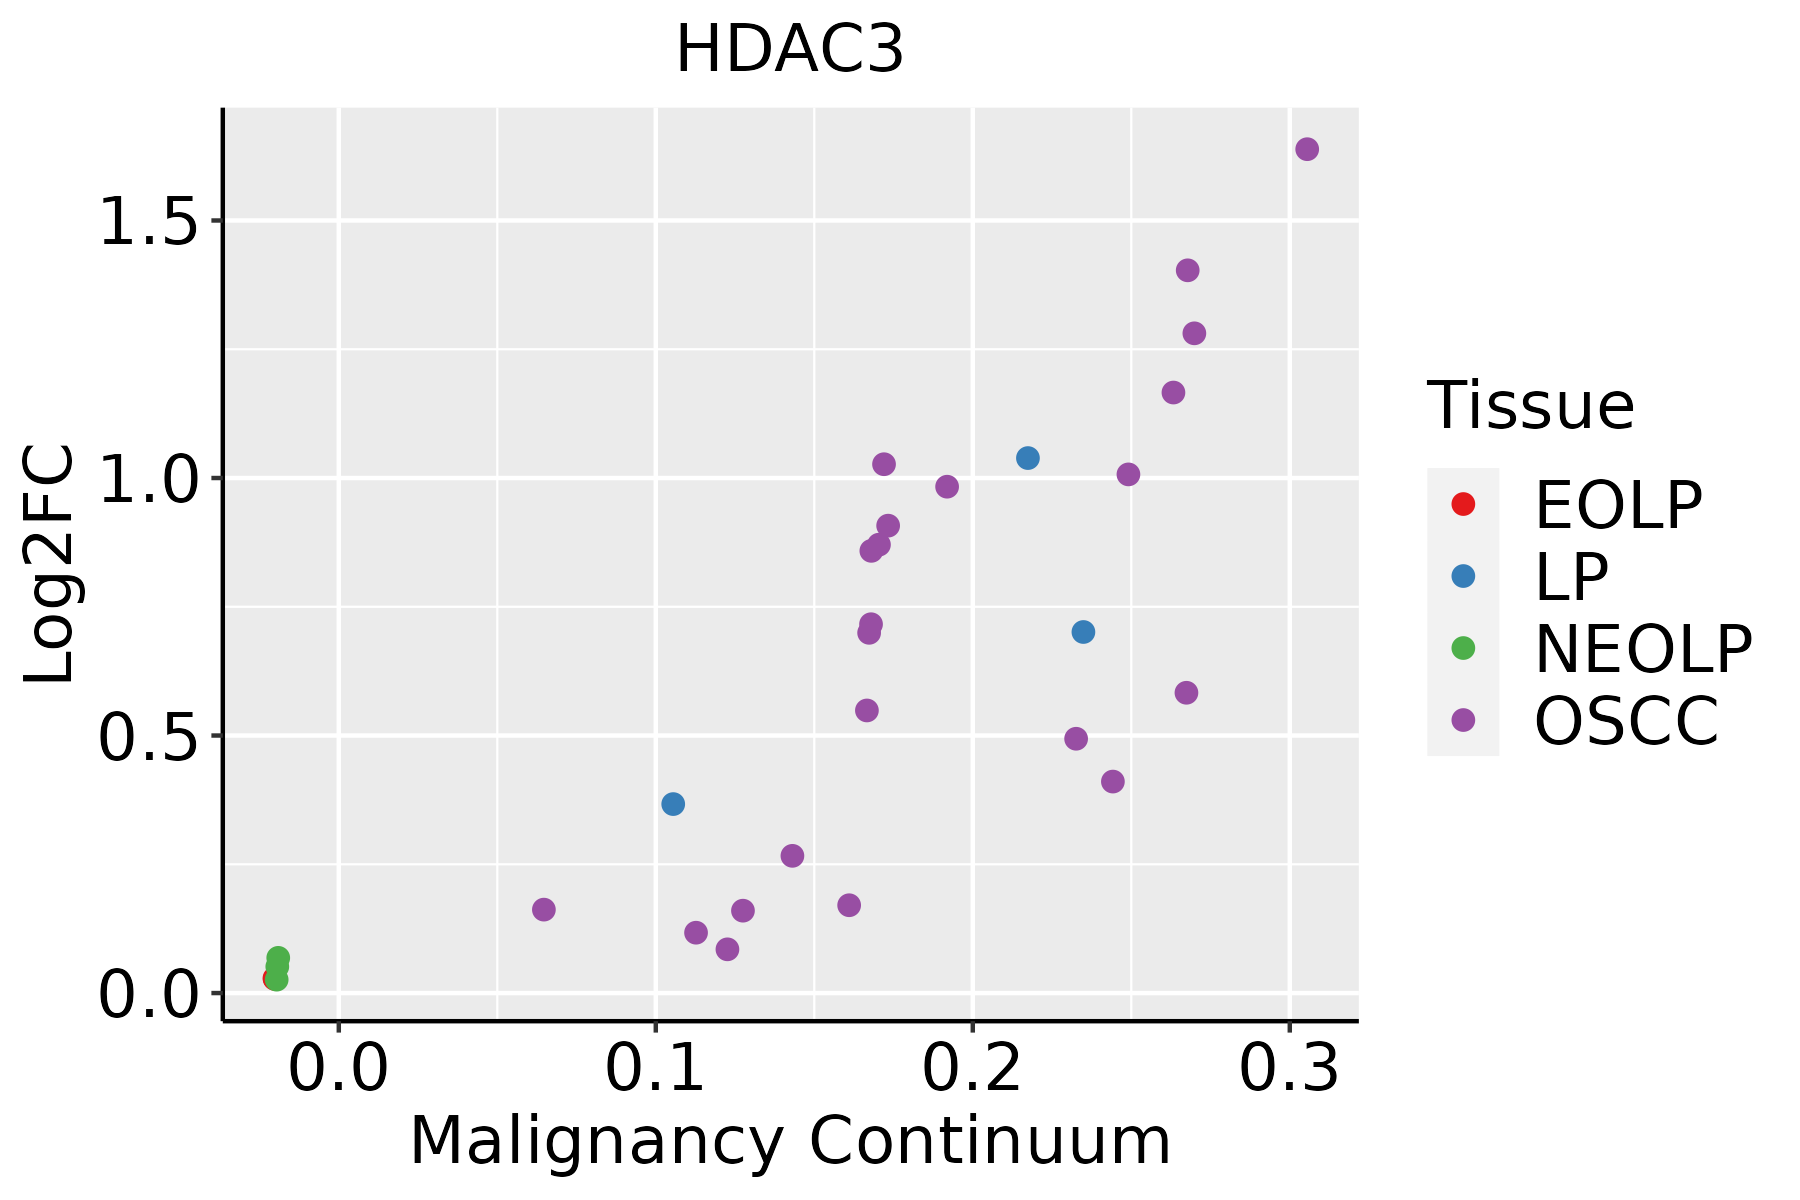 | EOLP: Erosive Oral lichen planus |
| LP: leukoplakia | ||
| NEOLP: Non-erosive oral lichen planus | ||
| OSCC: Oral squamous cell carcinoma | ||
| Skin | 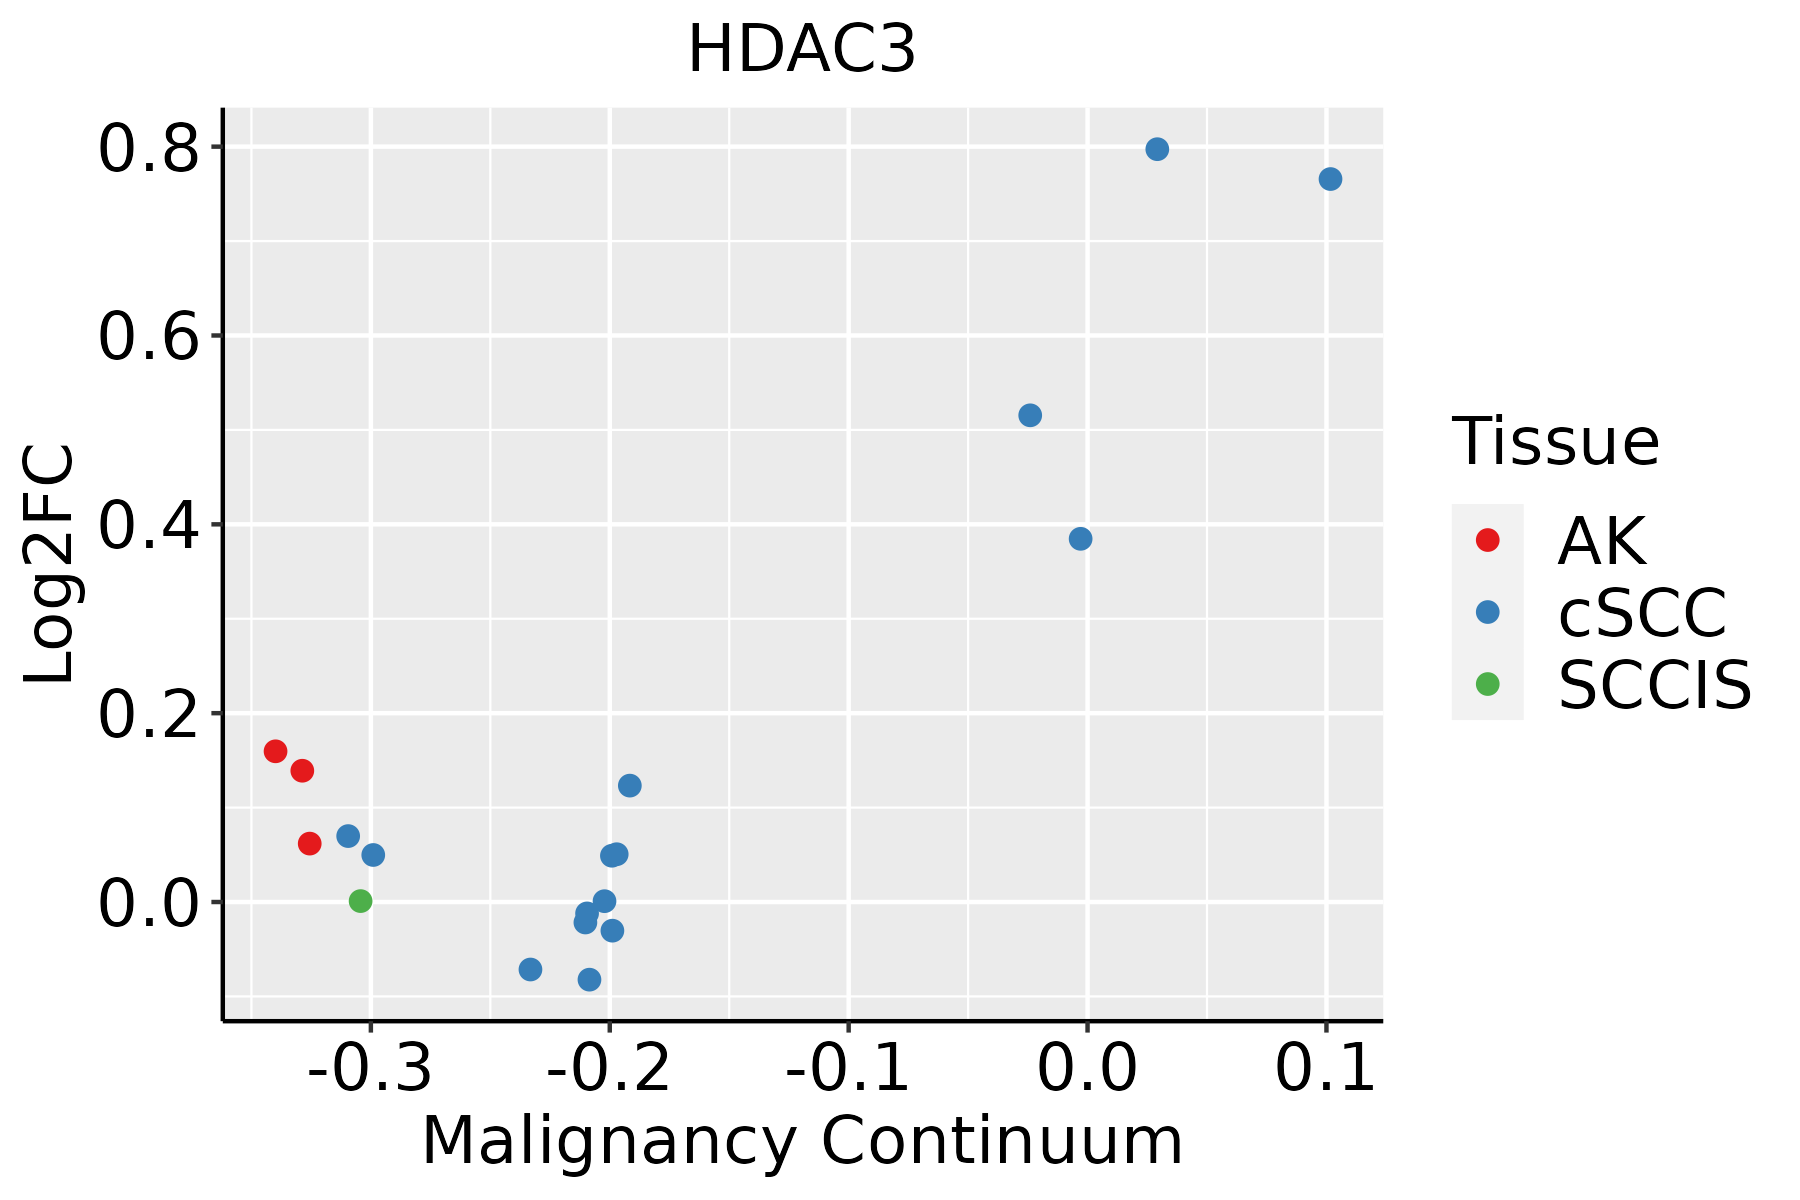 | AK: Actinic keratosis |
| cSCC: Cutaneous squamous cell carcinoma | ||
| SCCIS:squamous cell carcinoma in situ | ||
| Thyroid | 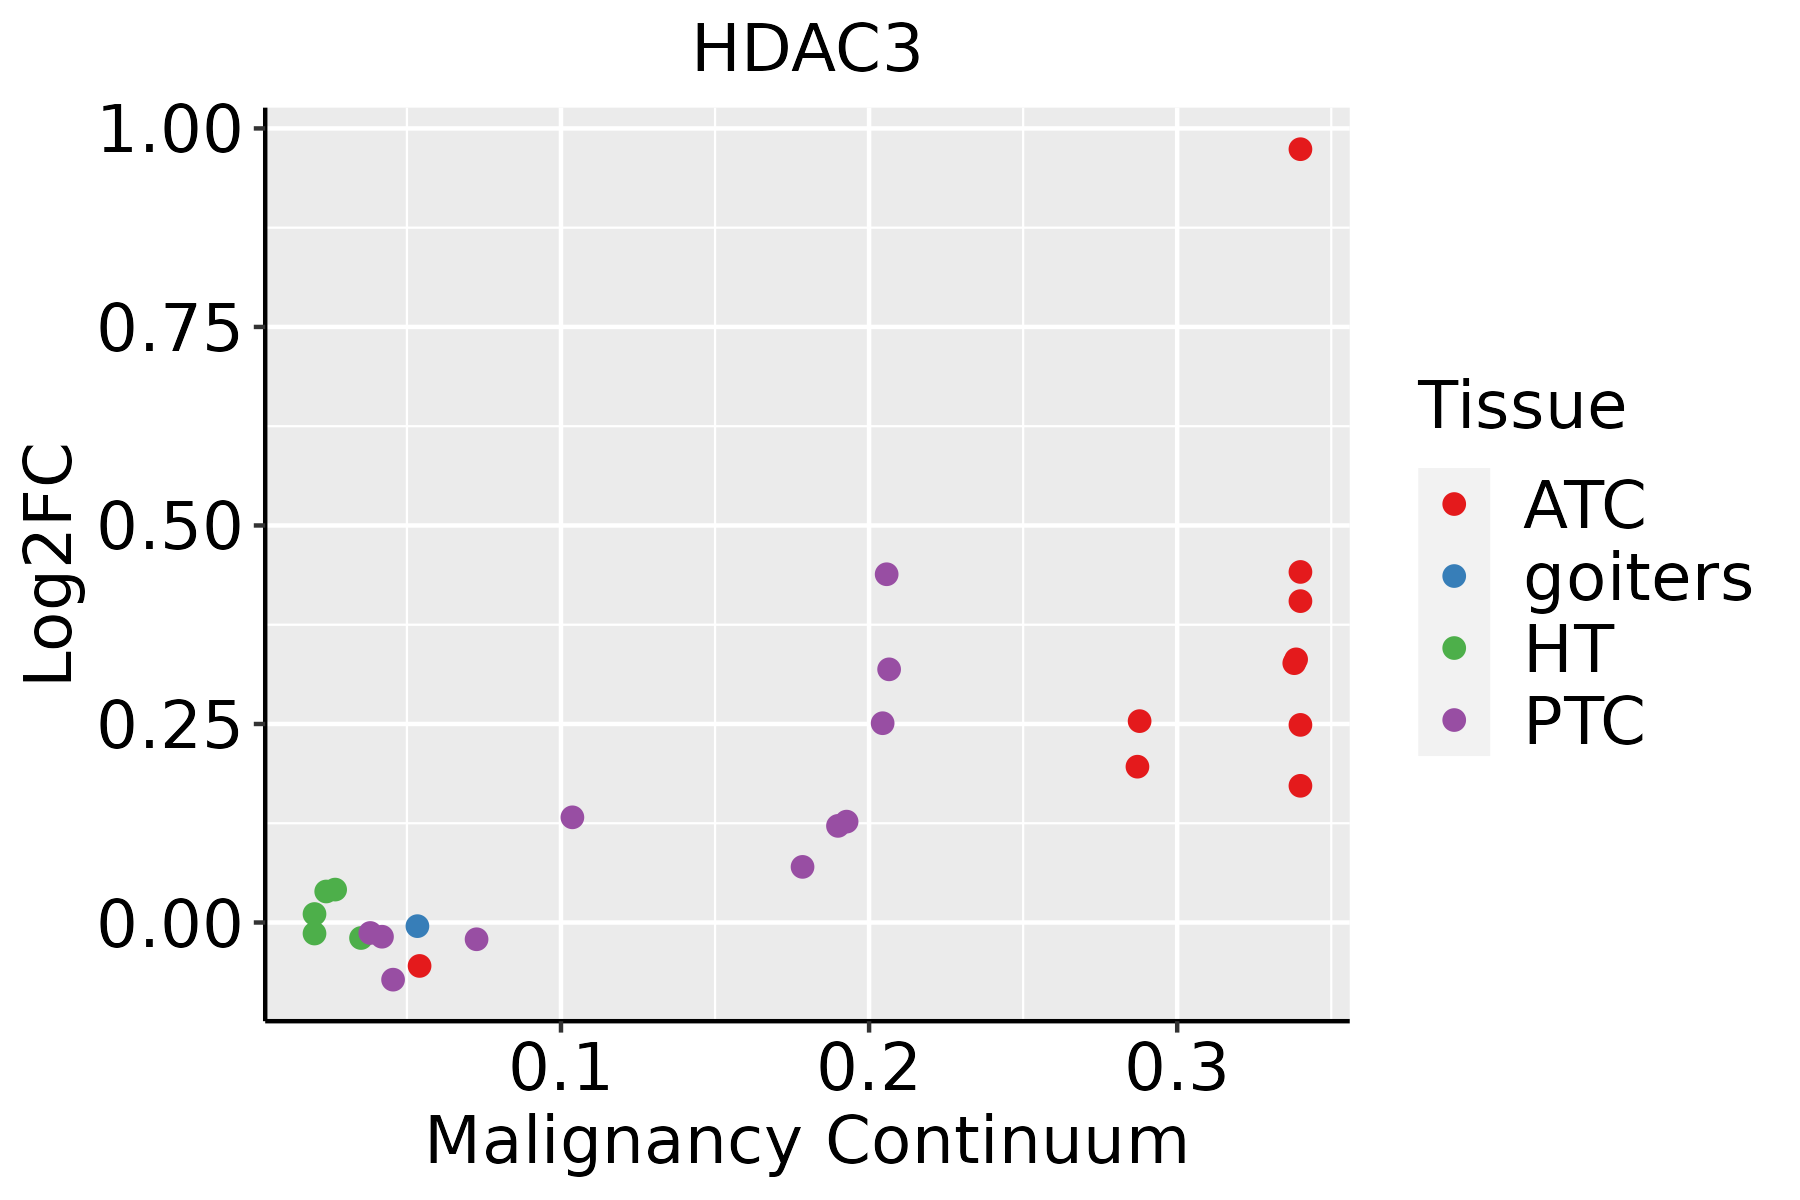 | ATC: Anaplastic thyroid cancer |
| HT: Hashimoto's thyroiditis | ||
| PTC: Papillary thyroid cancer |
| ∗log2FC in expression of this searched gene in stem-like cells from each diseased tissue sample relative to stem-like cells in normal samples in each tissue plotted against the malignancy continuum. Samples are colored based on if they are from different disease stage. |
Top |
Malignant transformation related pathway analysis |
| Find out the enriched GO biological processes and KEGG pathways involved in transition from healthy to precancer to cancer |
| Tissue | Disease Stage | Enriched GO biological Processes |
| Colorectum | AD |  |
| Colorectum | SER |  |
| Colorectum | MSS |  |
| Colorectum | MSI-H |  |
| Colorectum | FAP |  |
| ∗Top 15 enriched GO BP terms are showed in the bar plot of each disease state in each tissue. Each row represents a significant GO biological process which is colored according to the -log10(p.adjust). |
| Page: 1 2 3 4 5 6 7 8 9 |
| GO ID | Tissue | Disease Stage | Description | Gene Ratio | Bg Ratio | pvalue | p.adjust | Count |
| GO:0072594110 | Esophagus | ESCC | establishment of protein localization to organelle | 311/8552 | 422/18723 | 3.02e-32 | 2.13e-29 | 311 |
| GO:0006913110 | Esophagus | ESCC | nucleocytoplasmic transport | 230/8552 | 301/18723 | 6.04e-28 | 2.02e-25 | 230 |
| GO:0051169110 | Esophagus | ESCC | nuclear transport | 230/8552 | 301/18723 | 6.04e-28 | 2.02e-25 | 230 |
| GO:001657015 | Esophagus | ESCC | histone modification | 323/8552 | 463/18723 | 2.61e-26 | 7.88e-24 | 323 |
| GO:0031647111 | Esophagus | ESCC | regulation of protein stability | 223/8552 | 298/18723 | 5.76e-25 | 1.52e-22 | 223 |
| GO:003238618 | Esophagus | ESCC | regulation of intracellular transport | 243/8552 | 337/18723 | 3.20e-23 | 7.25e-21 | 243 |
| GO:003450418 | Esophagus | ESCC | protein localization to nucleus | 211/8552 | 290/18723 | 4.06e-21 | 6.60e-19 | 211 |
| GO:1903320111 | Esophagus | ESCC | regulation of protein modification by small protein conjugation or removal | 181/8552 | 242/18723 | 1.80e-20 | 2.60e-18 | 181 |
| GO:1903829111 | Esophagus | ESCC | positive regulation of cellular protein localization | 199/8552 | 276/18723 | 2.99e-19 | 3.45e-17 | 199 |
| GO:0033157110 | Esophagus | ESCC | regulation of intracellular protein transport | 169/8552 | 229/18723 | 3.31e-18 | 3.23e-16 | 169 |
| GO:0032388110 | Esophagus | ESCC | positive regulation of intracellular transport | 152/8552 | 202/18723 | 7.89e-18 | 7.36e-16 | 152 |
| GO:0031396111 | Esophagus | ESCC | regulation of protein ubiquitination | 154/8552 | 210/18723 | 2.70e-16 | 2.04e-14 | 154 |
| GO:1904951111 | Esophagus | ESCC | positive regulation of establishment of protein localization | 216/8552 | 319/18723 | 1.01e-15 | 6.86e-14 | 216 |
| GO:0046822110 | Esophagus | ESCC | regulation of nucleocytoplasmic transport | 88/8552 | 106/18723 | 1.88e-15 | 1.19e-13 | 88 |
| GO:009031617 | Esophagus | ESCC | positive regulation of intracellular protein transport | 122/8552 | 160/18723 | 2.45e-15 | 1.49e-13 | 122 |
| GO:001703818 | Esophagus | ESCC | protein import | 149/8552 | 206/18723 | 5.90e-15 | 3.31e-13 | 149 |
| GO:0051222111 | Esophagus | ESCC | positive regulation of protein transport | 204/8552 | 303/18723 | 1.56e-14 | 8.38e-13 | 204 |
| GO:000705114 | Esophagus | ESCC | spindle organization | 134/8552 | 184/18723 | 5.70e-14 | 2.87e-12 | 134 |
| GO:190018018 | Esophagus | ESCC | regulation of protein localization to nucleus | 102/8552 | 136/18723 | 2.84e-12 | 1.13e-10 | 102 |
| GO:190018217 | Esophagus | ESCC | positive regulation of protein localization to nucleus | 70/8552 | 87/18723 | 2.63e-11 | 8.99e-10 | 70 |
| Page: 1 2 3 4 5 6 7 8 9 10 11 12 13 14 15 16 17 18 19 |
| Pathway ID | Tissue | Disease Stage | Description | Gene Ratio | Bg Ratio | pvalue | p.adjust | qvalue | Count |
| hsa0520325 | Esophagus | ESCC | Viral carcinogenesis | 137/4205 | 204/8465 | 2.47e-07 | 1.88e-06 | 9.62e-07 | 137 |
| hsa0491928 | Esophagus | ESCC | Thyroid hormone signaling pathway | 78/4205 | 121/8465 | 6.79e-04 | 2.23e-03 | 1.14e-03 | 78 |
| hsa0520335 | Esophagus | ESCC | Viral carcinogenesis | 137/4205 | 204/8465 | 2.47e-07 | 1.88e-06 | 9.62e-07 | 137 |
| hsa04919113 | Esophagus | ESCC | Thyroid hormone signaling pathway | 78/4205 | 121/8465 | 6.79e-04 | 2.23e-03 | 1.14e-03 | 78 |
| hsa0491912 | Liver | HCC | Thyroid hormone signaling pathway | 75/4020 | 121/8465 | 8.76e-04 | 3.38e-03 | 1.88e-03 | 75 |
| hsa052032 | Liver | HCC | Viral carcinogenesis | 117/4020 | 204/8465 | 2.68e-03 | 8.98e-03 | 5.00e-03 | 117 |
| hsa0491913 | Liver | HCC | Thyroid hormone signaling pathway | 75/4020 | 121/8465 | 8.76e-04 | 3.38e-03 | 1.88e-03 | 75 |
| hsa052033 | Liver | HCC | Viral carcinogenesis | 117/4020 | 204/8465 | 2.68e-03 | 8.98e-03 | 5.00e-03 | 117 |
| hsa052038 | Oral cavity | OSCC | Viral carcinogenesis | 124/3704 | 204/8465 | 5.57e-07 | 3.28e-06 | 1.67e-06 | 124 |
| hsa0491926 | Oral cavity | OSCC | Thyroid hormone signaling pathway | 73/3704 | 121/8465 | 1.63e-04 | 5.52e-04 | 2.81e-04 | 73 |
| hsa0520314 | Oral cavity | OSCC | Viral carcinogenesis | 124/3704 | 204/8465 | 5.57e-07 | 3.28e-06 | 1.67e-06 | 124 |
| hsa04919112 | Oral cavity | OSCC | Thyroid hormone signaling pathway | 73/3704 | 121/8465 | 1.63e-04 | 5.52e-04 | 2.81e-04 | 73 |
| hsa0520324 | Oral cavity | LP | Viral carcinogenesis | 90/2418 | 204/8465 | 1.20e-06 | 1.38e-05 | 8.89e-06 | 90 |
| hsa0520334 | Oral cavity | LP | Viral carcinogenesis | 90/2418 | 204/8465 | 1.20e-06 | 1.38e-05 | 8.89e-06 | 90 |
| Page: 1 |
Top |
Cell-cell communication analysis |
| Identification of potential cell-cell interactions between two cell types and their ligand-receptor pairs for different disease states |
| Ligand | Receptor | LRpair | Pathway | Tissue | Disease Stage |
| Page: 1 |
Top |
Single-cell gene regulatory network inference analysis |
| Find out the significant the regulons (TFs) and the target genes of each regulon across cell types for different disease states |
| TF | Cell Type | Tissue | Disease Stage | Target Gene | RSS | Regulon Activity |
| ∗The dot plots of a searched regulon are shown for all cell subpopulations in each disease state of each tissue based on the regulon specific score inferred using pySCENIC and by calculating the average expression. |
| Page: 1 |
Top |
Somatic mutation of malignant transformation related genes |
| Annotation of somatic variants for genes involved in malignant transformation |
| Hugo Symbol | Variant Class | Variant Classification | dbSNP RS | HGVSc | HGVSp | HGVSp Short | SWISSPROT | BIOTYPE | SIFT | PolyPhen | Tumor Sample Barcode | Tissue | Histology | Sex | Age | Stage | Therapy Types | Drugs | Outcome |
| HDAC3 | SNV | Missense_Mutation | c.597N>G | p.Phe199Leu | p.F199L | O15379 | protein_coding | deleterious(0) | probably_damaging(0.999) | TCGA-E2-A14V-01 | Breast | breast invasive carcinoma | Female | <65 | I/II | Chemotherapy | cyclophosphamide | SD | |
| HDAC3 | SNV | Missense_Mutation | c.1012C>T | p.Leu338Phe | p.L338F | O15379 | protein_coding | deleterious(0) | probably_damaging(0.999) | TCGA-E2-A155-01 | Breast | breast invasive carcinoma | Female | <65 | I/II | Chemotherapy | cytoxan | SD | |
| HDAC3 | deletion | Frame_Shift_Del | novel | c.731delN | p.Val244GlyfsTer72 | p.V244Gfs*72 | O15379 | protein_coding | TCGA-LL-A6FQ-01 | Breast | breast invasive carcinoma | Female | >=65 | III/IV | Unknown | Unknown | SD | ||
| HDAC3 | SNV | Missense_Mutation | novel | c.445G>A | p.Asp149Asn | p.D149N | O15379 | protein_coding | deleterious(0) | probably_damaging(1) | TCGA-2W-A8YY-01 | Cervix | cervical & endocervical cancer | Female | <65 | I/II | Chemotherapy | cisplatin | CR |
| HDAC3 | SNV | Missense_Mutation | novel | c.38T>C | p.Val13Ala | p.V13A | O15379 | protein_coding | deleterious(0.01) | possibly_damaging(0.897) | TCGA-DG-A2KK-01 | Cervix | cervical & endocervical cancer | Female | <65 | III/IV | Chemotherapy | cisplatin | SD |
| HDAC3 | SNV | Missense_Mutation | c.708C>G | p.Phe236Leu | p.F236L | O15379 | protein_coding | deleterious(0) | benign(0.366) | TCGA-EK-A2PG-01 | Cervix | cervical & endocervical cancer | Female | >=65 | I/II | Unknown | Unknown | SD | |
| HDAC3 | SNV | Missense_Mutation | c.803N>A | p.Cys268Tyr | p.C268Y | O15379 | protein_coding | deleterious(0) | probably_damaging(0.997) | TCGA-FU-A3HZ-01 | Cervix | cervical & endocervical cancer | Female | <65 | I/II | Chemotherapy | cisplatin | CR | |
| HDAC3 | SNV | Missense_Mutation | c.1271N>A | p.Ser424Asn | p.S424N | O15379 | protein_coding | tolerated(0.57) | benign(0) | TCGA-IR-A3LK-01 | Cervix | cervical & endocervical cancer | Female | >=65 | I/II | Chemotherapy | cisplatin | PD | |
| HDAC3 | SNV | Missense_Mutation | c.192N>T | p.Glu64Asp | p.E64D | O15379 | protein_coding | tolerated(1) | benign(0.003) | TCGA-A6-2686-01 | Colorectum | colon adenocarcinoma | Female | >=65 | I/II | Unknown | Unknown | SD | |
| HDAC3 | SNV | Missense_Mutation | novel | c.712C>T | p.Pro238Ser | p.P238S | O15379 | protein_coding | tolerated(0.08) | probably_damaging(0.95) | TCGA-AA-3930-01 | Colorectum | colon adenocarcinoma | Male | >=65 | III/IV | Chemotherapy | capecitabine | PD |
| Page: 1 2 3 4 5 6 |
Top |
Related drugs of malignant transformation related genes |
| Identification of chemicals and drugs interact with genes involved in malignant transfromation |
| (DGIdb 4.0) |
| Entrez ID | Symbol | Category | Interaction Types | Drug Claim Name | Drug Name | PMIDs |
| 8841 | HDAC3 | ENZYME, TRANSCRIPTION FACTOR, DRUGGABLE GENOME | inhibitor | CUDC-101 | CUDC-101 | |
| 8841 | HDAC3 | ENZYME, TRANSCRIPTION FACTOR, DRUGGABLE GENOME | BELINOSTAT | BELINOSTAT | 25937017 | |
| 8841 | HDAC3 | ENZYME, TRANSCRIPTION FACTOR, DRUGGABLE GENOME | 7-ETHYL-10-HYDROXY-CAMPTOTHECIN | 7-ETHYL-10-HYDROXYCAMPTOTHECIN | 23622981 | |
| 8841 | HDAC3 | ENZYME, TRANSCRIPTION FACTOR, DRUGGABLE GENOME | inhibitor | 187051792 | PANOBINOSTAT | |
| 8841 | HDAC3 | ENZYME, TRANSCRIPTION FACTOR, DRUGGABLE GENOME | VALPROIC ACID | VALPROIC ACID | 18294844,16921367,25304896 | |
| 8841 | HDAC3 | ENZYME, TRANSCRIPTION FACTOR, DRUGGABLE GENOME | RG2833 | |||
| 8841 | HDAC3 | ENZYME, TRANSCRIPTION FACTOR, DRUGGABLE GENOME | PMID29671355-Compound-25 | |||
| 8841 | HDAC3 | ENZYME, TRANSCRIPTION FACTOR, DRUGGABLE GENOME | inhibitor | 252166579 | TACEDINALINE | |
| 8841 | HDAC3 | ENZYME, TRANSCRIPTION FACTOR, DRUGGABLE GENOME | inhibitor | VALPROIC ACID | DEPAKOTE | |
| 8841 | HDAC3 | ENZYME, TRANSCRIPTION FACTOR, DRUGGABLE GENOME | 2-ENE-VALPROATE | CHEMBL117487 | 17566732 |
| Page: 1 2 3 4 5 6 7 8 9 10 11 |

Copyright 2023-Present -The University of Texas Health Science Center at Houston |