
|
|||||
|
 | |
| |
| |
| |
| |
| |
|
Gene: HDAC11 |
Gene summary for HDAC11 |
| Gene information | Species | Human | Gene symbol | HDAC11 | Gene ID | 79885 |
| Gene name | histone deacetylase 11 | |
| Gene Alias | HD11 | |
| Cytomap | 3p25.1 | |
| Gene Type | protein-coding | GO ID | GO:0006325 | UniProtAcc | Q96DB2 |
Top |
Malignant transformation analysis |
| Identification of the aberrant gene expression in precancerous and cancerous lesions by comparing the gene expression of stem-like cells in diseased tissues with normal stem cells |
| Entrez ID | Symbol | Replicates | Species | Organ | Tissue | Adj P-value | Log2FC | Malignancy |
| 79885 | HDAC11 | HCC1_Meng | Human | Liver | HCC | 6.66e-22 | 2.96e-02 | 0.0246 |
| 79885 | HDAC11 | HCC2_Meng | Human | Liver | HCC | 6.93e-07 | 1.81e-02 | 0.0107 |
| 79885 | HDAC11 | HCC2 | Human | Liver | HCC | 6.77e-10 | 3.53e+00 | 0.5341 |
| 79885 | HDAC11 | HCC5 | Human | Liver | HCC | 1.67e-11 | 2.47e-01 | 0.4932 |
| 79885 | HDAC11 | S014 | Human | Liver | HCC | 7.76e-03 | 3.21e-01 | 0.2254 |
| 79885 | HDAC11 | S015 | Human | Liver | HCC | 3.14e-09 | 5.85e-01 | 0.2375 |
| 79885 | HDAC11 | S016 | Human | Liver | HCC | 2.17e-08 | 4.38e-01 | 0.2243 |
| 79885 | HDAC11 | S027 | Human | Liver | HCC | 1.45e-06 | 6.16e-01 | 0.2446 |
| 79885 | HDAC11 | S028 | Human | Liver | HCC | 1.34e-15 | 6.80e-01 | 0.2503 |
| 79885 | HDAC11 | S029 | Human | Liver | HCC | 2.16e-11 | 6.89e-01 | 0.2581 |
| Page: 1 |
| Tissue | Expression Dynamics | Abbreviation |
| Liver | 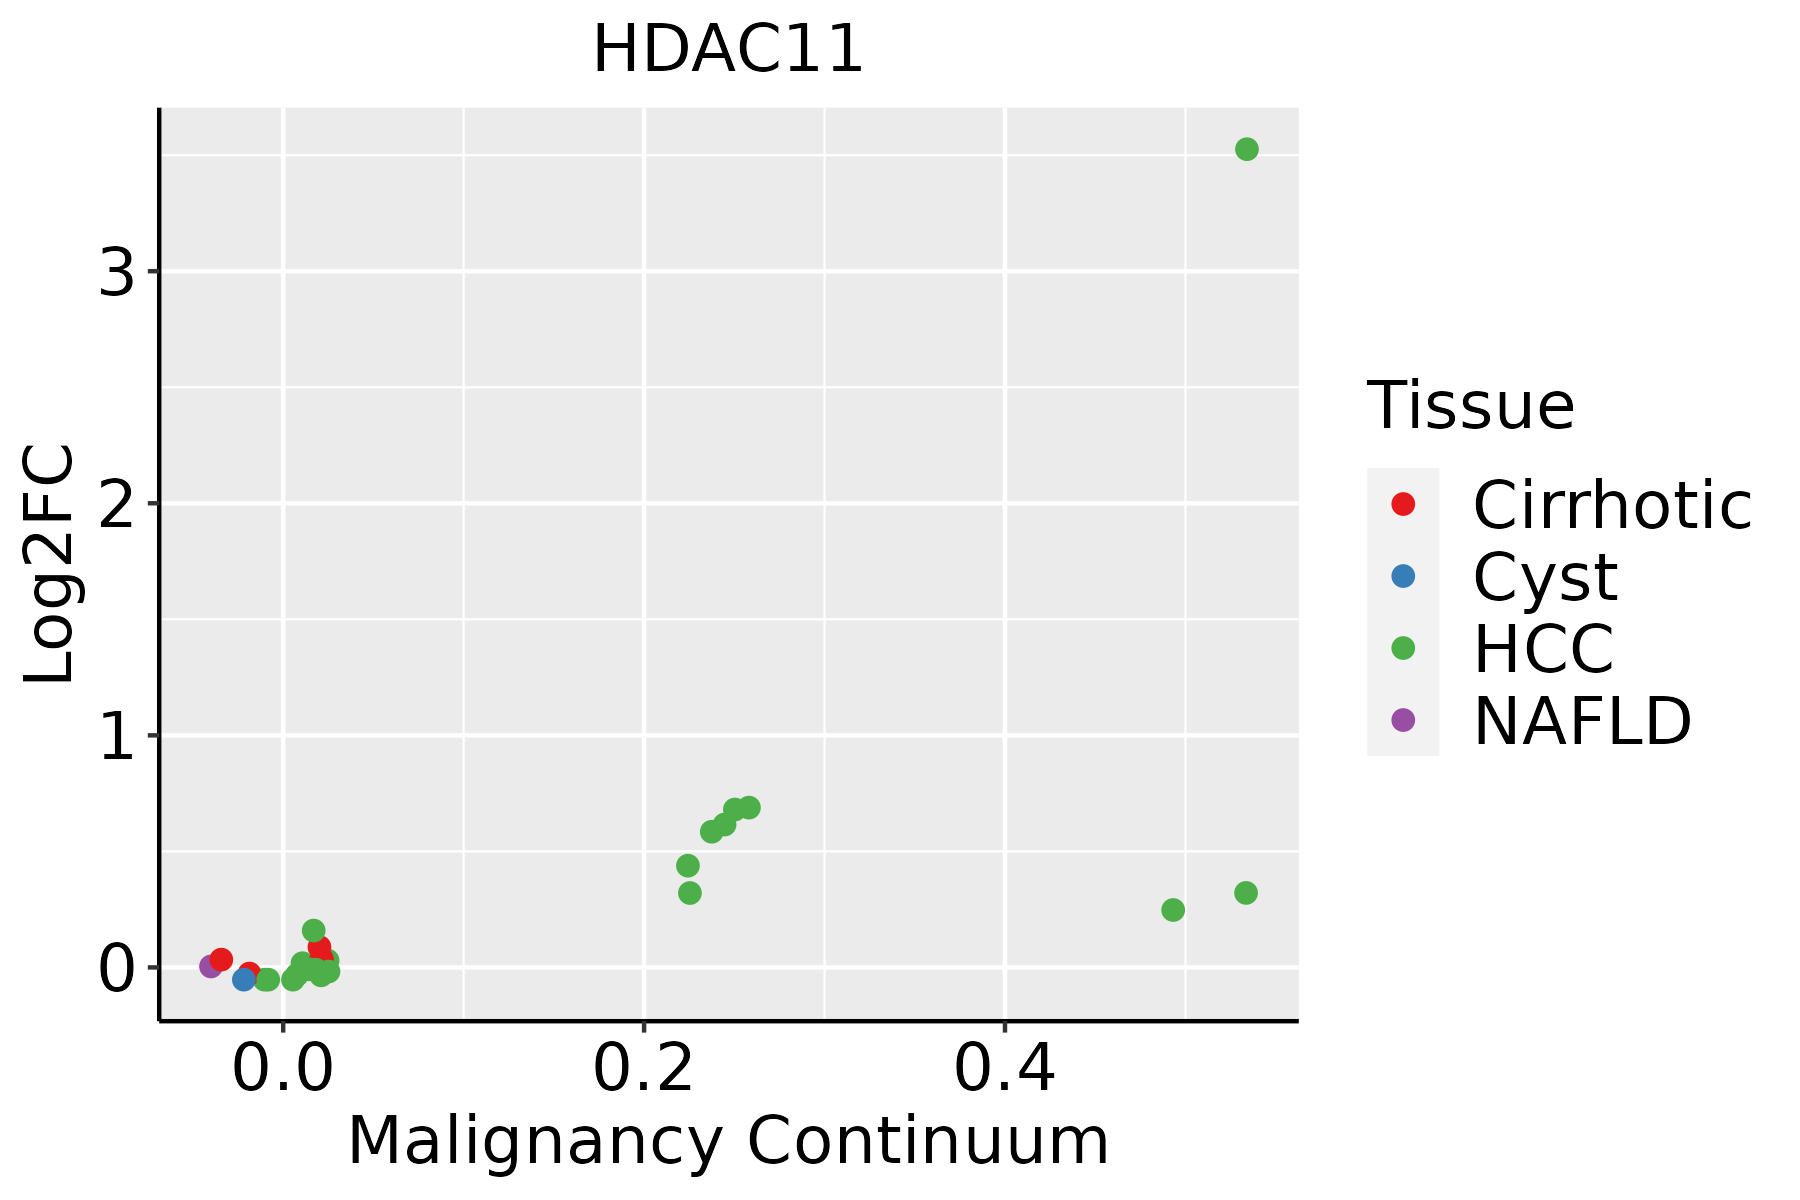 | HCC: Hepatocellular carcinoma |
| NAFLD: Non-alcoholic fatty liver disease |
| ∗log2FC in expression of this searched gene in stem-like cells from each diseased tissue sample relative to stem-like cells in normal samples in each tissue plotted against the malignancy continuum. Samples are colored based on if they are from different disease stage. |
Top |
Malignant transformation related pathway analysis |
| Find out the enriched GO biological processes and KEGG pathways involved in transition from healthy to precancer to cancer |
| Tissue | Disease Stage | Enriched GO biological Processes |
| Colorectum | AD |  |
| Colorectum | SER |  |
| Colorectum | MSS |  |
| Colorectum | MSI-H |  |
| Colorectum | FAP |  |
| ∗Top 15 enriched GO BP terms are showed in the bar plot of each disease state in each tissue. Each row represents a significant GO biological process which is colored according to the -log10(p.adjust). |
| Page: 1 2 3 4 5 6 7 8 9 |
| GO ID | Tissue | Disease Stage | Description | Gene Ratio | Bg Ratio | pvalue | p.adjust | Count |
| GO:001657021 | Liver | HCC | histone modification | 283/7958 | 463/18723 | 2.68e-16 | 2.33e-14 | 283 |
| GO:0098732 | Liver | HCC | macromolecule deacylation | 67/7958 | 116/18723 | 6.46e-04 | 3.99e-03 | 67 |
| GO:000632511 | Liver | HCC | chromatin organization | 206/7958 | 409/18723 | 7.23e-04 | 4.41e-03 | 206 |
| GO:00356011 | Liver | HCC | protein deacylation | 64/7958 | 112/18723 | 1.23e-03 | 6.83e-03 | 64 |
| GO:00064761 | Liver | HCC | protein deacetylation | 55/7958 | 101/18723 | 1.01e-02 | 3.79e-02 | 55 |
| GO:00420631 | Liver | HCC | gliogenesis | 148/7958 | 301/18723 | 1.10e-02 | 4.07e-02 | 148 |
| Page: 1 |
| Pathway ID | Tissue | Disease Stage | Description | Gene Ratio | Bg Ratio | pvalue | p.adjust | qvalue | Count |
| hsa052032 | Liver | HCC | Viral carcinogenesis | 117/4020 | 204/8465 | 2.68e-03 | 8.98e-03 | 5.00e-03 | 117 |
| hsa052033 | Liver | HCC | Viral carcinogenesis | 117/4020 | 204/8465 | 2.68e-03 | 8.98e-03 | 5.00e-03 | 117 |
| Page: 1 |
Top |
Cell-cell communication analysis |
| Identification of potential cell-cell interactions between two cell types and their ligand-receptor pairs for different disease states |
| Ligand | Receptor | LRpair | Pathway | Tissue | Disease Stage |
| Page: 1 |
Top |
Single-cell gene regulatory network inference analysis |
| Find out the significant the regulons (TFs) and the target genes of each regulon across cell types for different disease states |
| TF | Cell Type | Tissue | Disease Stage | Target Gene | RSS | Regulon Activity |
| ∗The dot plots of a searched regulon are shown for all cell subpopulations in each disease state of each tissue based on the regulon specific score inferred using pySCENIC and by calculating the average expression. |
| Page: 1 |
Top |
Somatic mutation of malignant transformation related genes |
| Annotation of somatic variants for genes involved in malignant transformation |
| Hugo Symbol | Variant Class | Variant Classification | dbSNP RS | HGVSc | HGVSp | HGVSp Short | SWISSPROT | BIOTYPE | SIFT | PolyPhen | Tumor Sample Barcode | Tissue | Histology | Sex | Age | Stage | Therapy Types | Drugs | Outcome |
| HDAC11 | SNV | Missense_Mutation | c.672G>T | p.Glu224Asp | p.E224D | Q96DB2 | protein_coding | deleterious(0.01) | possibly_damaging(0.516) | TCGA-BH-A0AU-01 | Breast | breast invasive carcinoma | Female | <65 | I/II | Unknown | Unknown | SD | |
| HDAC11 | SNV | Missense_Mutation | novel | c.569N>A | p.Arg190Gln | p.R190Q | Q96DB2 | protein_coding | deleterious(0.02) | probably_damaging(0.939) | TCGA-OL-A5DA-01 | Breast | breast invasive carcinoma | Female | <65 | I/II | Unknown | Unknown | SD |
| HDAC11 | deletion | Frame_Shift_Del | novel | c.631delN | p.Asp212ThrfsTer68 | p.D212Tfs*68 | Q96DB2 | protein_coding | TCGA-D8-A27V-01 | Breast | breast invasive carcinoma | Female | <65 | I/II | Hormone Therapy | tamoxiphen | SD | ||
| HDAC11 | SNV | Missense_Mutation | c.670G>A | p.Glu224Lys | p.E224K | Q96DB2 | protein_coding | deleterious(0.03) | benign(0.261) | TCGA-IR-A3LK-01 | Cervix | cervical & endocervical cancer | Female | >=65 | I/II | Chemotherapy | cisplatin | PD | |
| HDAC11 | SNV | Missense_Mutation | novel | c.896N>G | p.Val299Gly | p.V299G | Q96DB2 | protein_coding | deleterious(0) | probably_damaging(0.925) | TCGA-AA-3684-01 | Colorectum | colon adenocarcinoma | Female | >=65 | III/IV | Unknown | Unknown | SD |
| HDAC11 | SNV | Missense_Mutation | c.68N>A | p.Arg23His | p.R23H | Q96DB2 | protein_coding | tolerated(0.14) | benign(0.022) | TCGA-AY-6197-01 | Colorectum | colon adenocarcinoma | Male | <65 | I/II | Unknown | Unknown | SD | |
| HDAC11 | SNV | Missense_Mutation | c.1019N>T | p.Pro340Leu | p.P340L | Q96DB2 | protein_coding | tolerated_low_confidence(0.08) | benign(0.001) | TCGA-CM-5861-01 | Colorectum | colon adenocarcinoma | Female | <65 | I/II | Unknown | Unknown | PD | |
| HDAC11 | SNV | Missense_Mutation | c.595T>C | p.Tyr199His | p.Y199H | Q96DB2 | protein_coding | deleterious(0) | possibly_damaging(0.706) | TCGA-D5-6928-01 | Colorectum | colon adenocarcinoma | Male | >=65 | I/II | Unknown | Unknown | SD | |
| HDAC11 | SNV | Missense_Mutation | c.560N>T | p.Gly187Val | p.G187V | Q96DB2 | protein_coding | deleterious(0) | probably_damaging(1) | TCGA-G4-6628-01 | Colorectum | colon adenocarcinoma | Male | >=65 | I/II | Unknown | Unknown | SD | |
| HDAC11 | SNV | Missense_Mutation | novel | c.643N>A | p.Ala215Thr | p.A215T | Q96DB2 | protein_coding | deleterious(0) | possibly_damaging(0.831) | TCGA-A5-A0G1-01 | Endometrium | uterine corpus endometrioid carcinoma | Female | >=65 | I/II | Unknown | Unknown | SD |
| Page: 1 2 3 4 5 |
Top |
Related drugs of malignant transformation related genes |
| Identification of chemicals and drugs interact with genes involved in malignant transfromation |
| (DGIdb 4.0) |
| Entrez ID | Symbol | Category | Interaction Types | Drug Claim Name | Drug Name | PMIDs |
| 79885 | HDAC11 | DRUGGABLE GENOME, ENZYME | PMID29671355-Compound-44 | |||
| 79885 | HDAC11 | DRUGGABLE GENOME, ENZYME | inhibitor | CHEMBL3545368 | PANOBINOSTAT LACTATE | |
| 79885 | HDAC11 | DRUGGABLE GENOME, ENZYME | CUDC-101 | CUDC-101 | ||
| 79885 | HDAC11 | DRUGGABLE GENOME, ENZYME | PRACINOSTAT | PRACINOSTAT | ||
| 79885 | HDAC11 | DRUGGABLE GENOME, ENZYME | APICIDIN | APICIDIN | 19705846 | |
| 79885 | HDAC11 | DRUGGABLE GENOME, ENZYME | DAUNORUBICIN | DAUNORUBICIN | 22260166 | |
| 79885 | HDAC11 | DRUGGABLE GENOME, ENZYME | inhibitor | 348353622 | ||
| 79885 | HDAC11 | DRUGGABLE GENOME, ENZYME | VORINOSTAT | VORINOSTAT | ||
| 79885 | HDAC11 | DRUGGABLE GENOME, ENZYME | inhibitor | CHEMBL27759 | ENTINOSTAT | |
| 79885 | HDAC11 | DRUGGABLE GENOME, ENZYME | PMID29671355-Compound-21 |
| Page: 1 2 3 4 5 6 |

Copyright 2023-Present -The University of Texas Health Science Center at Houston |