
|
|||||
|
 | |
| |
| |
| |
| |
| |
|
Gene: HDAC10 |
Gene summary for HDAC10 |
| Gene information | Species | Human | Gene symbol | HDAC10 | Gene ID | 83933 |
| Gene name | histone deacetylase 10 | |
| Gene Alias | HD10 | |
| Cytomap | 22q13.33 | |
| Gene Type | protein-coding | GO ID | GO:0000122 | UniProtAcc | Q969S8 |
Top |
Malignant transformation analysis |
| Identification of the aberrant gene expression in precancerous and cancerous lesions by comparing the gene expression of stem-like cells in diseased tissues with normal stem cells |
| Entrez ID | Symbol | Replicates | Species | Organ | Tissue | Adj P-value | Log2FC | Malignancy |
| 83933 | HDAC10 | LZE7T | Human | Esophagus | ESCC | 5.09e-09 | 4.09e-01 | 0.0667 |
| 83933 | HDAC10 | LZE8T | Human | Esophagus | ESCC | 4.45e-03 | 1.35e-01 | 0.067 |
| 83933 | HDAC10 | LZE20T | Human | Esophagus | ESCC | 5.14e-04 | 1.65e-01 | 0.0662 |
| 83933 | HDAC10 | LZE21D1 | Human | Esophagus | HGIN | 3.51e-02 | 2.07e-01 | 0.0632 |
| 83933 | HDAC10 | LZE22T | Human | Esophagus | ESCC | 2.12e-03 | 2.59e-01 | 0.068 |
| 83933 | HDAC10 | LZE24T | Human | Esophagus | ESCC | 4.43e-18 | 3.82e-01 | 0.0596 |
| 83933 | HDAC10 | LZE21T | Human | Esophagus | ESCC | 2.77e-06 | 3.23e-01 | 0.0655 |
| 83933 | HDAC10 | P1T-E | Human | Esophagus | ESCC | 2.54e-19 | 6.49e-01 | 0.0875 |
| 83933 | HDAC10 | P2T-E | Human | Esophagus | ESCC | 9.58e-11 | 1.31e-01 | 0.1177 |
| 83933 | HDAC10 | P4T-E | Human | Esophagus | ESCC | 9.76e-10 | 1.69e-01 | 0.1323 |
| 83933 | HDAC10 | P5T-E | Human | Esophagus | ESCC | 8.88e-12 | 2.43e-01 | 0.1327 |
| 83933 | HDAC10 | P8T-E | Human | Esophagus | ESCC | 1.45e-22 | 3.69e-01 | 0.0889 |
| 83933 | HDAC10 | P9T-E | Human | Esophagus | ESCC | 1.71e-09 | 1.68e-01 | 0.1131 |
| 83933 | HDAC10 | P10T-E | Human | Esophagus | ESCC | 3.46e-15 | 2.87e-01 | 0.116 |
| 83933 | HDAC10 | P11T-E | Human | Esophagus | ESCC | 4.64e-20 | 6.42e-01 | 0.1426 |
| 83933 | HDAC10 | P12T-E | Human | Esophagus | ESCC | 1.49e-17 | 1.94e-01 | 0.1122 |
| 83933 | HDAC10 | P15T-E | Human | Esophagus | ESCC | 3.28e-17 | 3.84e-01 | 0.1149 |
| 83933 | HDAC10 | P16T-E | Human | Esophagus | ESCC | 1.01e-23 | 3.06e-01 | 0.1153 |
| 83933 | HDAC10 | P17T-E | Human | Esophagus | ESCC | 3.39e-12 | 4.48e-01 | 0.1278 |
| 83933 | HDAC10 | P20T-E | Human | Esophagus | ESCC | 2.45e-21 | 4.82e-01 | 0.1124 |
| Page: 1 2 3 4 |
| Tissue | Expression Dynamics | Abbreviation |
| Esophagus | 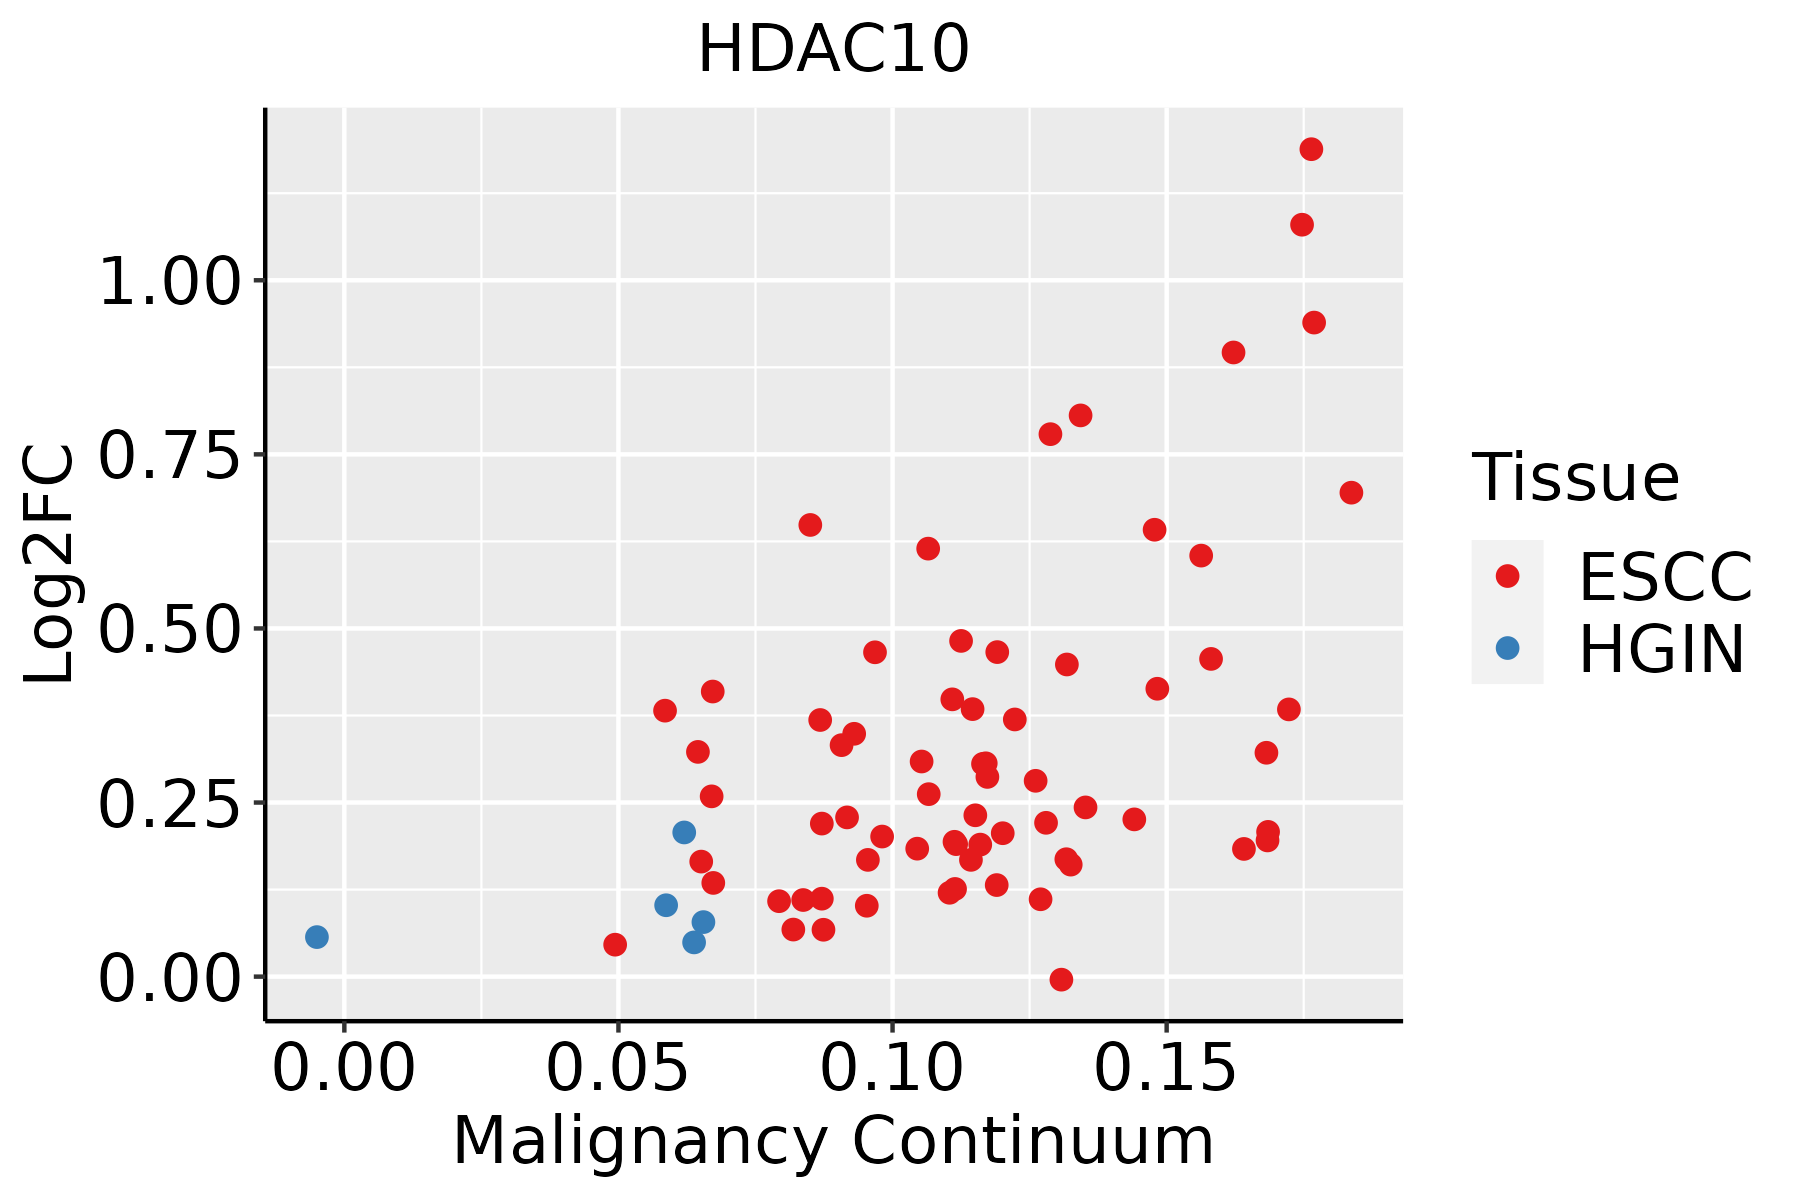 | ESCC: Esophageal squamous cell carcinoma |
| HGIN: High-grade intraepithelial neoplasias | ||
| LGIN: Low-grade intraepithelial neoplasias | ||
| Oral Cavity | 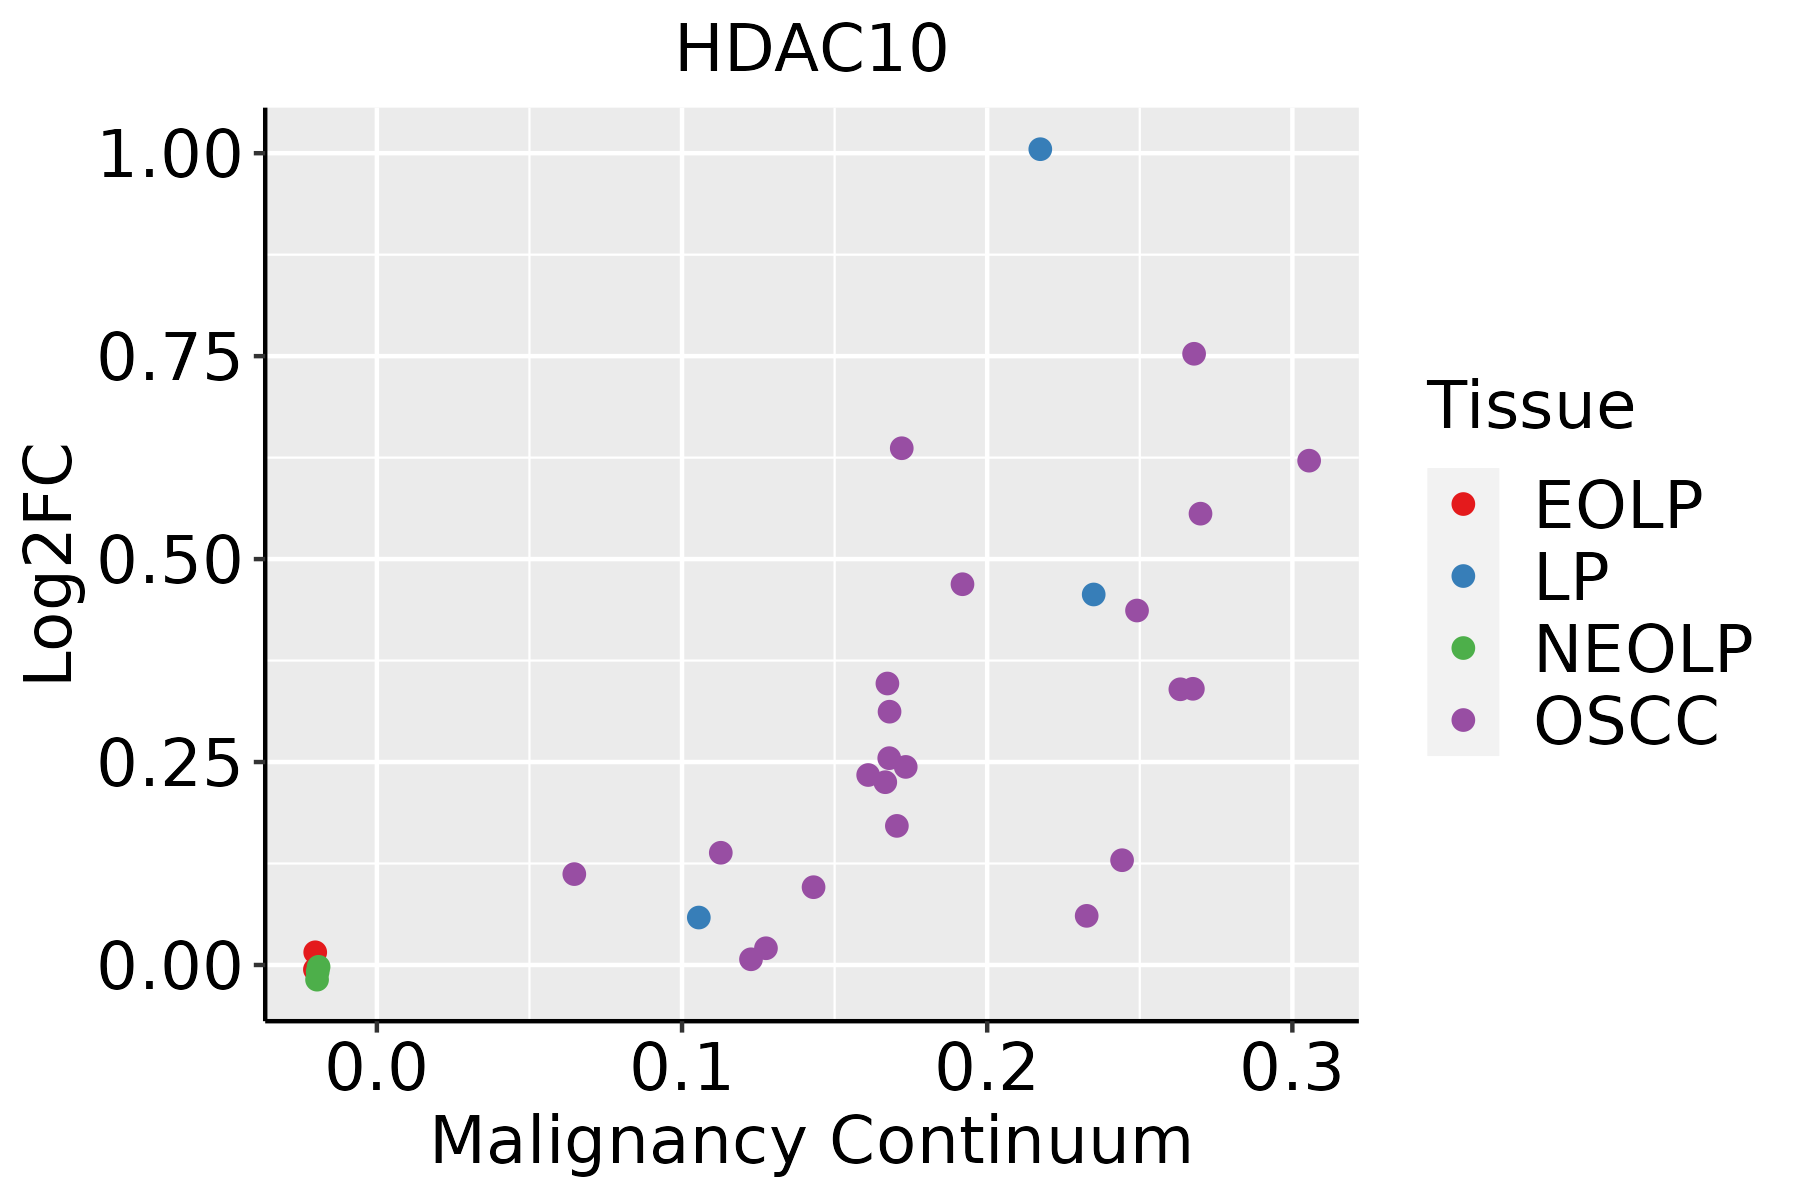 | EOLP: Erosive Oral lichen planus |
| LP: leukoplakia | ||
| NEOLP: Non-erosive oral lichen planus | ||
| OSCC: Oral squamous cell carcinoma |
| ∗log2FC in expression of this searched gene in stem-like cells from each diseased tissue sample relative to stem-like cells in normal samples in each tissue plotted against the malignancy continuum. Samples are colored based on if they are from different disease stage. |
Top |
Malignant transformation related pathway analysis |
| Find out the enriched GO biological processes and KEGG pathways involved in transition from healthy to precancer to cancer |
| Tissue | Disease Stage | Enriched GO biological Processes |
| Colorectum | AD |  |
| Colorectum | SER |  |
| Colorectum | MSS |  |
| Colorectum | MSI-H |  |
| Colorectum | FAP |  |
| ∗Top 15 enriched GO BP terms are showed in the bar plot of each disease state in each tissue. Each row represents a significant GO biological process which is colored according to the -log10(p.adjust). |
| Page: 1 2 3 4 5 6 7 8 9 |
| GO ID | Tissue | Disease Stage | Description | Gene Ratio | Bg Ratio | pvalue | p.adjust | Count |
| GO:001623616 | Esophagus | HGIN | macroautophagy | 77/2587 | 291/18723 | 7.15e-09 | 4.61e-07 | 77 |
| GO:00182057 | Esophagus | HGIN | peptidyl-lysine modification | 88/2587 | 376/18723 | 2.99e-07 | 1.39e-05 | 88 |
| GO:000632516 | Esophagus | HGIN | chromatin organization | 92/2587 | 409/18723 | 1.05e-06 | 4.16e-05 | 92 |
| GO:005105214 | Esophagus | HGIN | regulation of DNA metabolic process | 79/2587 | 359/18723 | 1.38e-05 | 3.85e-04 | 79 |
| GO:200102019 | Esophagus | HGIN | regulation of response to DNA damage stimulus | 52/2587 | 219/18723 | 5.00e-05 | 1.19e-03 | 52 |
| GO:005105416 | Esophagus | HGIN | positive regulation of DNA metabolic process | 47/2587 | 201/18723 | 1.65e-04 | 3.21e-03 | 47 |
| GO:00165708 | Esophagus | HGIN | histone modification | 92/2587 | 463/18723 | 1.70e-04 | 3.30e-03 | 92 |
| GO:001657015 | Esophagus | ESCC | histone modification | 323/8552 | 463/18723 | 2.61e-26 | 7.88e-24 | 323 |
| GO:001623617 | Esophagus | ESCC | macroautophagy | 216/8552 | 291/18723 | 1.94e-23 | 4.57e-21 | 216 |
| GO:001820514 | Esophagus | ESCC | peptidyl-lysine modification | 259/8552 | 376/18723 | 3.90e-20 | 5.26e-18 | 259 |
| GO:005105215 | Esophagus | ESCC | regulation of DNA metabolic process | 232/8552 | 359/18723 | 2.40e-13 | 1.13e-11 | 232 |
| GO:005105417 | Esophagus | ESCC | positive regulation of DNA metabolic process | 139/8552 | 201/18723 | 1.20e-11 | 4.33e-10 | 139 |
| GO:2001020110 | Esophagus | ESCC | regulation of response to DNA damage stimulus | 145/8552 | 219/18723 | 5.97e-10 | 1.50e-08 | 145 |
| GO:000632517 | Esophagus | ESCC | chromatin organization | 240/8552 | 409/18723 | 6.52e-08 | 1.14e-06 | 240 |
| GO:00356015 | Esophagus | ESCC | protein deacylation | 79/8552 | 112/18723 | 8.30e-08 | 1.42e-06 | 79 |
| GO:00987325 | Esophagus | ESCC | macromolecule deacylation | 80/8552 | 116/18723 | 3.19e-07 | 4.50e-06 | 80 |
| GO:00165754 | Esophagus | ESCC | histone deacetylation | 60/8552 | 82/18723 | 3.85e-07 | 5.32e-06 | 60 |
| GO:00064765 | Esophagus | ESCC | protein deacetylation | 70/8552 | 101/18723 | 1.29e-06 | 1.58e-05 | 70 |
| GO:20010228 | Esophagus | ESCC | positive regulation of response to DNA damage stimulus | 69/8552 | 105/18723 | 2.66e-05 | 2.22e-04 | 69 |
| GO:00420636 | Esophagus | ESCC | gliogenesis | 172/8552 | 301/18723 | 3.75e-05 | 3.04e-04 | 172 |
| Page: 1 2 3 |
| Pathway ID | Tissue | Disease Stage | Description | Gene Ratio | Bg Ratio | pvalue | p.adjust | qvalue | Count |
| hsa052039 | Esophagus | HGIN | Viral carcinogenesis | 53/1383 | 204/8465 | 2.58e-04 | 2.71e-03 | 2.15e-03 | 53 |
| hsa0520315 | Esophagus | HGIN | Viral carcinogenesis | 53/1383 | 204/8465 | 2.58e-04 | 2.71e-03 | 2.15e-03 | 53 |
| hsa0520325 | Esophagus | ESCC | Viral carcinogenesis | 137/4205 | 204/8465 | 2.47e-07 | 1.88e-06 | 9.62e-07 | 137 |
| hsa0520335 | Esophagus | ESCC | Viral carcinogenesis | 137/4205 | 204/8465 | 2.47e-07 | 1.88e-06 | 9.62e-07 | 137 |
| hsa052038 | Oral cavity | OSCC | Viral carcinogenesis | 124/3704 | 204/8465 | 5.57e-07 | 3.28e-06 | 1.67e-06 | 124 |
| hsa0520314 | Oral cavity | OSCC | Viral carcinogenesis | 124/3704 | 204/8465 | 5.57e-07 | 3.28e-06 | 1.67e-06 | 124 |
| hsa0520324 | Oral cavity | LP | Viral carcinogenesis | 90/2418 | 204/8465 | 1.20e-06 | 1.38e-05 | 8.89e-06 | 90 |
| hsa0520334 | Oral cavity | LP | Viral carcinogenesis | 90/2418 | 204/8465 | 1.20e-06 | 1.38e-05 | 8.89e-06 | 90 |
| Page: 1 |
Top |
Cell-cell communication analysis |
| Identification of potential cell-cell interactions between two cell types and their ligand-receptor pairs for different disease states |
| Ligand | Receptor | LRpair | Pathway | Tissue | Disease Stage |
| Page: 1 |
Top |
Single-cell gene regulatory network inference analysis |
| Find out the significant the regulons (TFs) and the target genes of each regulon across cell types for different disease states |
| TF | Cell Type | Tissue | Disease Stage | Target Gene | RSS | Regulon Activity |
| ∗The dot plots of a searched regulon are shown for all cell subpopulations in each disease state of each tissue based on the regulon specific score inferred using pySCENIC and by calculating the average expression. |
| Page: 1 |
Top |
Somatic mutation of malignant transformation related genes |
| Annotation of somatic variants for genes involved in malignant transformation |
| Hugo Symbol | Variant Class | Variant Classification | dbSNP RS | HGVSc | HGVSp | HGVSp Short | SWISSPROT | BIOTYPE | SIFT | PolyPhen | Tumor Sample Barcode | Tissue | Histology | Sex | Age | Stage | Therapy Types | Drugs | Outcome |
| HDAC10 | SNV | Missense_Mutation | novel | c.1753N>G | p.Leu585Val | p.L585V | Q969S8 | protein_coding | tolerated(0.13) | possibly_damaging(0.718) | TCGA-BH-A0B6-01 | Breast | breast invasive carcinoma | Female | <65 | I/II | Unknown | Unknown | SD |
| HDAC10 | SNV | Missense_Mutation | novel | c.1078C>G | p.Gln360Glu | p.Q360E | Q969S8 | protein_coding | tolerated(0.6) | benign(0.001) | TCGA-BH-A0BP-01 | Breast | breast invasive carcinoma | Female | >=65 | I/II | Unknown | Unknown | SD |
| HDAC10 | deletion | Frame_Shift_Del | novel | c.1689delG | p.Leu564CysfsTer54 | p.L564Cfs*54 | Q969S8 | protein_coding | TCGA-D8-A27V-01 | Breast | breast invasive carcinoma | Female | <65 | I/II | Hormone Therapy | tamoxiphen | SD | ||
| HDAC10 | SNV | Missense_Mutation | novel | c.1450N>A | p.Ala484Thr | p.A484T | Q969S8 | protein_coding | tolerated(0.37) | benign(0.033) | TCGA-VS-A959-01 | Cervix | cervical & endocervical cancer | Female | >=65 | I/II | Unknown | Unknown | SD |
| HDAC10 | SNV | Missense_Mutation | novel | c.1493N>A | p.Gly498Asp | p.G498D | Q969S8 | protein_coding | tolerated(0.24) | benign(0.215) | TCGA-AA-A010-01 | Colorectum | colon adenocarcinoma | Female | <65 | I/II | Chemotherapy | folinic | CR |
| HDAC10 | SNV | Missense_Mutation | novel | c.271N>A | p.Asp91Asn | p.D91N | Q969S8 | protein_coding | tolerated(0.12) | benign(0.073) | TCGA-AZ-4315-01 | Colorectum | colon adenocarcinoma | Male | <65 | I/II | Unknown | Unknown | SD |
| HDAC10 | SNV | Missense_Mutation | c.602N>A | p.Arg201His | p.R201H | Q969S8 | protein_coding | tolerated(0.14) | benign(0.022) | TCGA-WS-AB45-01 | Colorectum | colon adenocarcinoma | Female | <65 | I/II | Unknown | Unknown | SD | |
| HDAC10 | SNV | Missense_Mutation | rs202169873 | c.880N>A | p.Gly294Ser | p.G294S | Q969S8 | protein_coding | tolerated(0.08) | benign(0.426) | TCGA-EI-6882-01 | Colorectum | rectum adenocarcinoma | Male | <65 | I/II | Unknown | Unknown | SD |
| HDAC10 | SNV | Missense_Mutation | novel | c.1258N>A | p.Asp420Asn | p.D420N | Q969S8 | protein_coding | tolerated(0.09) | benign(0.276) | TCGA-A5-A0G1-01 | Endometrium | uterine corpus endometrioid carcinoma | Female | >=65 | I/II | Unknown | Unknown | SD |
| HDAC10 | SNV | Missense_Mutation | novel | c.1091N>T | p.Ala364Val | p.A364V | Q969S8 | protein_coding | tolerated(0.14) | benign(0.013) | TCGA-A5-A1OF-01 | Endometrium | uterine corpus endometrioid carcinoma | Female | <65 | I/II | Unknown | Unknown | SD |
| Page: 1 2 3 4 5 |
Top |
Related drugs of malignant transformation related genes |
| Identification of chemicals and drugs interact with genes involved in malignant transfromation |
| (DGIdb 4.0) |
| Entrez ID | Symbol | Category | Interaction Types | Drug Claim Name | Drug Name | PMIDs |
| 83933 | HDAC10 | ENZYME, DRUGGABLE GENOME, DNA REPAIR | APICIDIN | APICIDIN | 19705846 | |
| 83933 | HDAC10 | ENZYME, DRUGGABLE GENOME, DNA REPAIR | inhibitor | 187051805 | QUISINOSTAT | |
| 83933 | HDAC10 | ENZYME, DRUGGABLE GENOME, DNA REPAIR | BUTYRYLHYDROXAMIC ACID | BUTYRYLHYDROXAMIC ACID | 21874153 | |
| 83933 | HDAC10 | ENZYME, DRUGGABLE GENOME, DNA REPAIR | RESMINOSTAT | RESMINOSTAT | ||
| 83933 | HDAC10 | ENZYME, DRUGGABLE GENOME, DNA REPAIR | inhibitor | 348353623 | ||
| 83933 | HDAC10 | ENZYME, DRUGGABLE GENOME, DNA REPAIR | BELINOSTAT | BELINOSTAT | ||
| 83933 | HDAC10 | ENZYME, DRUGGABLE GENOME, DNA REPAIR | PRACINOSTAT | PRACINOSTAT | ||
| 83933 | HDAC10 | ENZYME, DRUGGABLE GENOME, DNA REPAIR | ENTINOSTAT | ENTINOSTAT | 19966789,20491440 | |
| 83933 | HDAC10 | ENZYME, DRUGGABLE GENOME, DNA REPAIR | MOCETINOSTAT | MOCETINOSTAT | 23829483,26287310 | |
| 83933 | HDAC10 | ENZYME, DRUGGABLE GENOME, DNA REPAIR | inhibitor | GIVINOSTAT | GIVINOSTAT |
| Page: 1 2 3 4 5 6 7 |

Copyright 2023-Present -The University of Texas Health Science Center at Houston |