
|
|||||
|
 | |
| |
| |
| |
| |
| |
|
Gene: HCST |
Gene summary for HCST |
| Gene information | Species | Human | Gene symbol | HCST | Gene ID | 10870 |
| Gene name | hematopoietic cell signal transducer | |
| Gene Alias | DAP10 | |
| Cytomap | 19q13.12 | |
| Gene Type | protein-coding | GO ID | GO:0002376 | UniProtAcc | Q9UBK5 |
Top |
Malignant transformation analysis |
| Identification of the aberrant gene expression in precancerous and cancerous lesions by comparing the gene expression of stem-like cells in diseased tissues with normal stem cells |
| Entrez ID | Symbol | Replicates | Species | Organ | Tissue | Adj P-value | Log2FC | Malignancy |
| 10870 | HCST | CA_HPV_1 | Human | Cervix | CC | 1.77e-12 | 5.05e-01 | 0.0264 |
| 10870 | HCST | HSIL_HPV_1 | Human | Cervix | HSIL_HPV | 3.01e-03 | 3.80e-01 | 0.0116 |
| 10870 | HCST | N_HPV_2 | Human | Cervix | N_HPV | 1.06e-09 | 4.07e-01 | -0.0131 |
| 10870 | HCST | CCI_1 | Human | Cervix | CC | 2.41e-04 | -5.23e-01 | 0.528 |
| 10870 | HCST | CCI_2 | Human | Cervix | CC | 7.57e-04 | -5.23e-01 | 0.5249 |
| 10870 | HCST | CCI_3 | Human | Cervix | CC | 2.37e-06 | -5.23e-01 | 0.516 |
| 10870 | HCST | CCII_1 | Human | Cervix | CC | 4.21e-07 | -5.12e-01 | 0.3249 |
| 10870 | HCST | Tumor | Human | Cervix | CC | 3.10e-23 | -5.13e-01 | 0.1241 |
| 10870 | HCST | sample1 | Human | Cervix | CC | 1.28e-07 | -5.23e-01 | 0.0959 |
| 10870 | HCST | sample3 | Human | Cervix | CC | 7.70e-21 | -5.04e-01 | 0.1387 |
| 10870 | HCST | H2 | Human | Cervix | HSIL_HPV | 2.33e-14 | -4.58e-01 | 0.0632 |
| 10870 | HCST | L1 | Human | Cervix | CC | 5.59e-03 | -3.29e-01 | 0.0802 |
| 10870 | HCST | T1 | Human | Cervix | CC | 1.67e-11 | -4.89e-01 | 0.0918 |
| 10870 | HCST | T3 | Human | Cervix | CC | 6.67e-22 | -5.16e-01 | 0.1389 |
| 10870 | HCST | LZE4T | Human | Esophagus | ESCC | 1.12e-11 | 5.56e-01 | 0.0811 |
| 10870 | HCST | LZE7T | Human | Esophagus | ESCC | 1.44e-05 | 5.70e-01 | 0.0667 |
| 10870 | HCST | LZE8T | Human | Esophagus | ESCC | 4.94e-03 | 3.25e-01 | 0.067 |
| 10870 | HCST | LZE22D1 | Human | Esophagus | HGIN | 8.67e-03 | 3.05e-01 | 0.0595 |
| 10870 | HCST | LZE6T | Human | Esophagus | ESCC | 4.51e-18 | 1.06e+00 | 0.0845 |
| 10870 | HCST | C21 | Human | Oral cavity | OSCC | 1.02e-26 | 8.41e-01 | 0.2678 |
| Page: 1 2 |
| Tissue | Expression Dynamics | Abbreviation |
| Cervix | 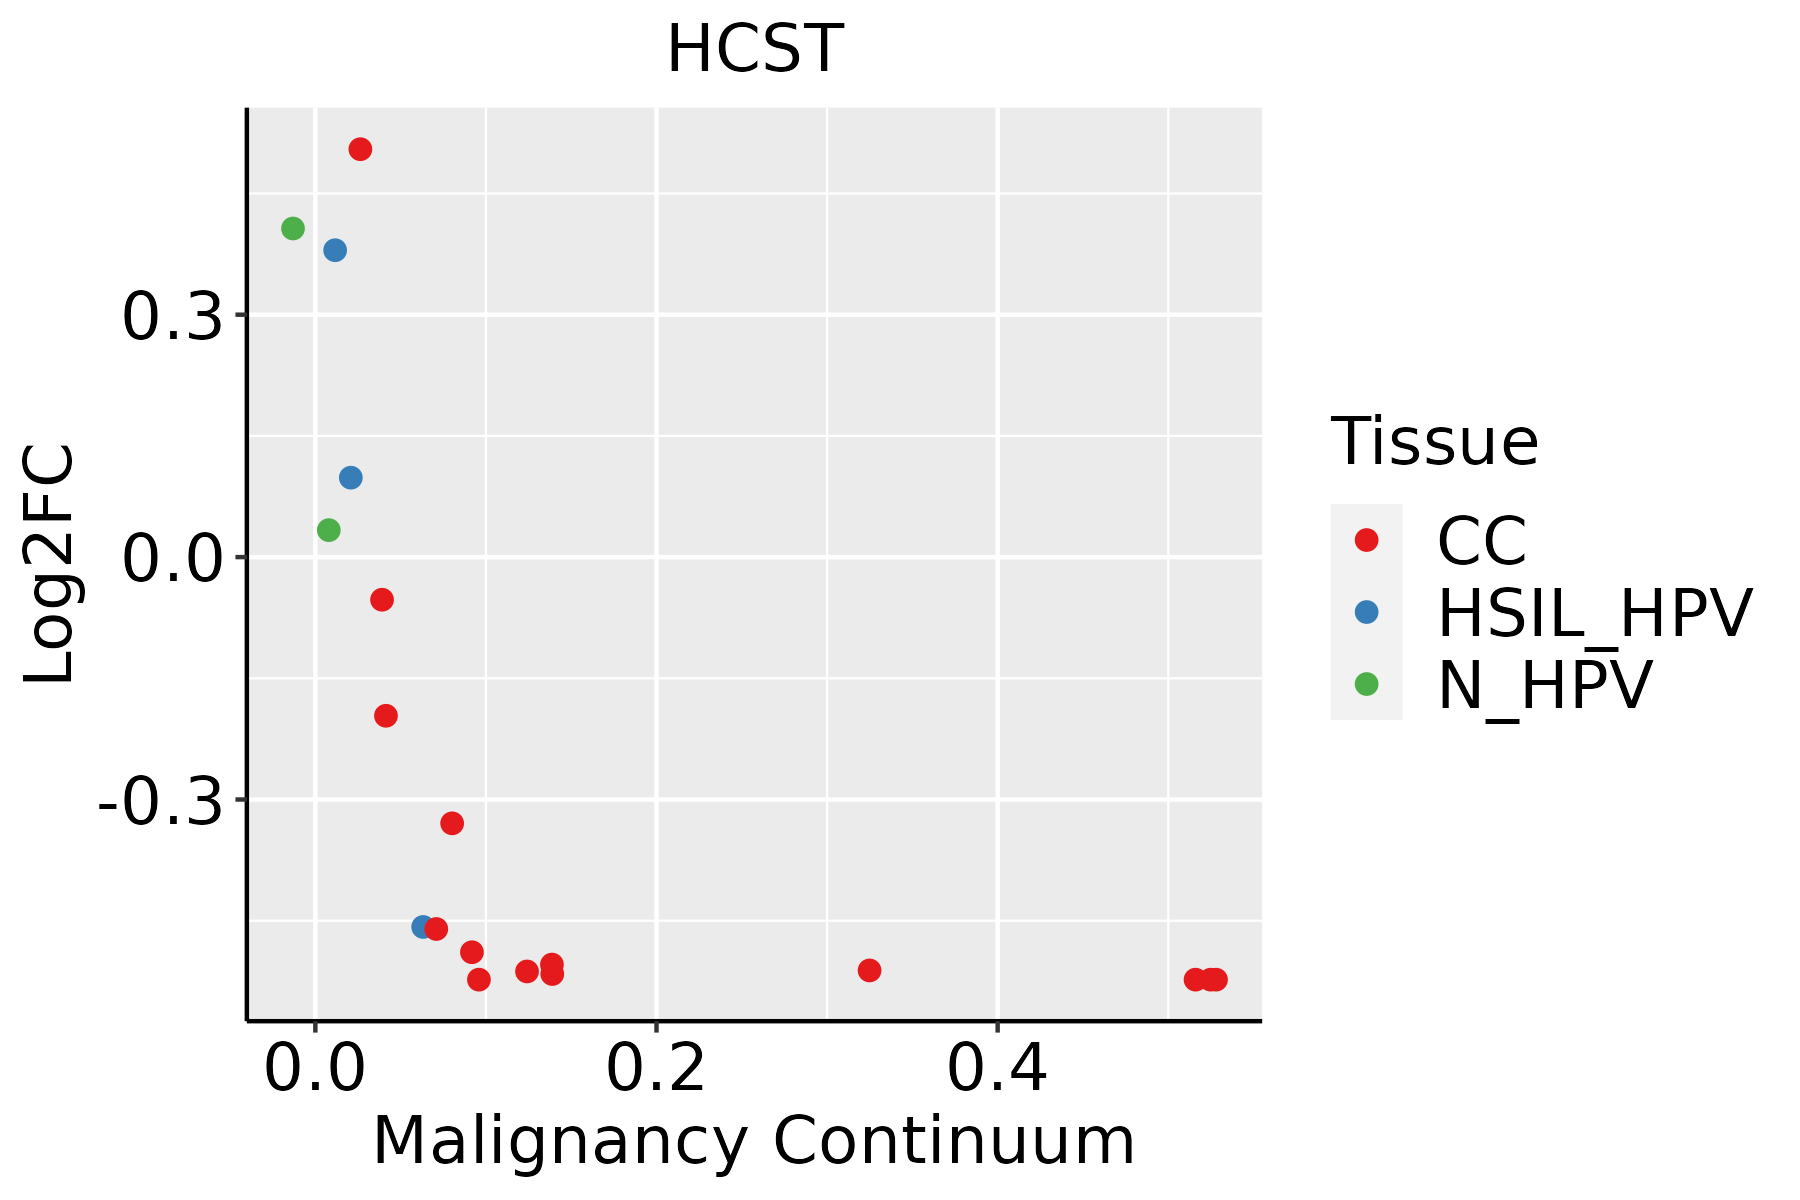 | CC: Cervix cancer |
| HSIL_HPV: HPV-infected high-grade squamous intraepithelial lesions | ||
| N_HPV: HPV-infected normal cervix | ||
| Esophagus | 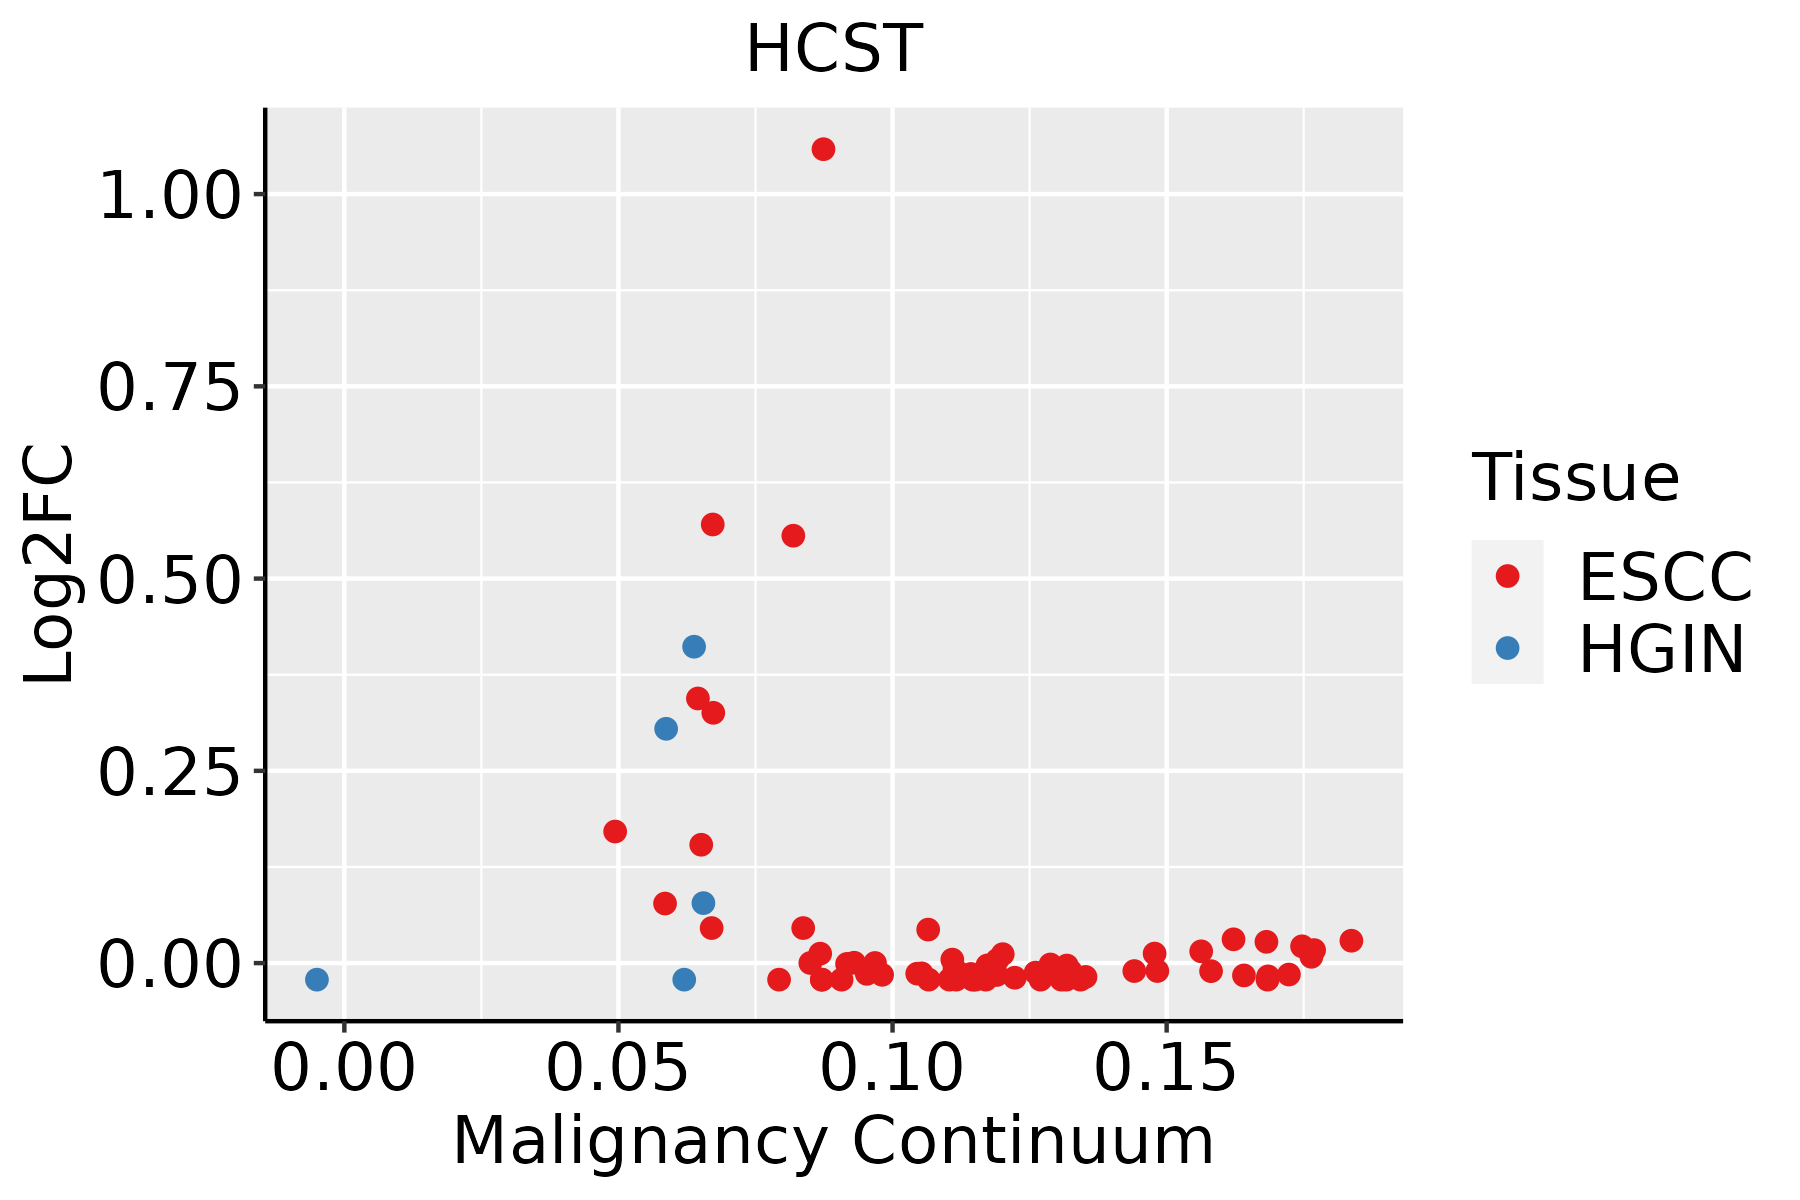 | ESCC: Esophageal squamous cell carcinoma |
| HGIN: High-grade intraepithelial neoplasias | ||
| LGIN: Low-grade intraepithelial neoplasias | ||
| Oral Cavity | 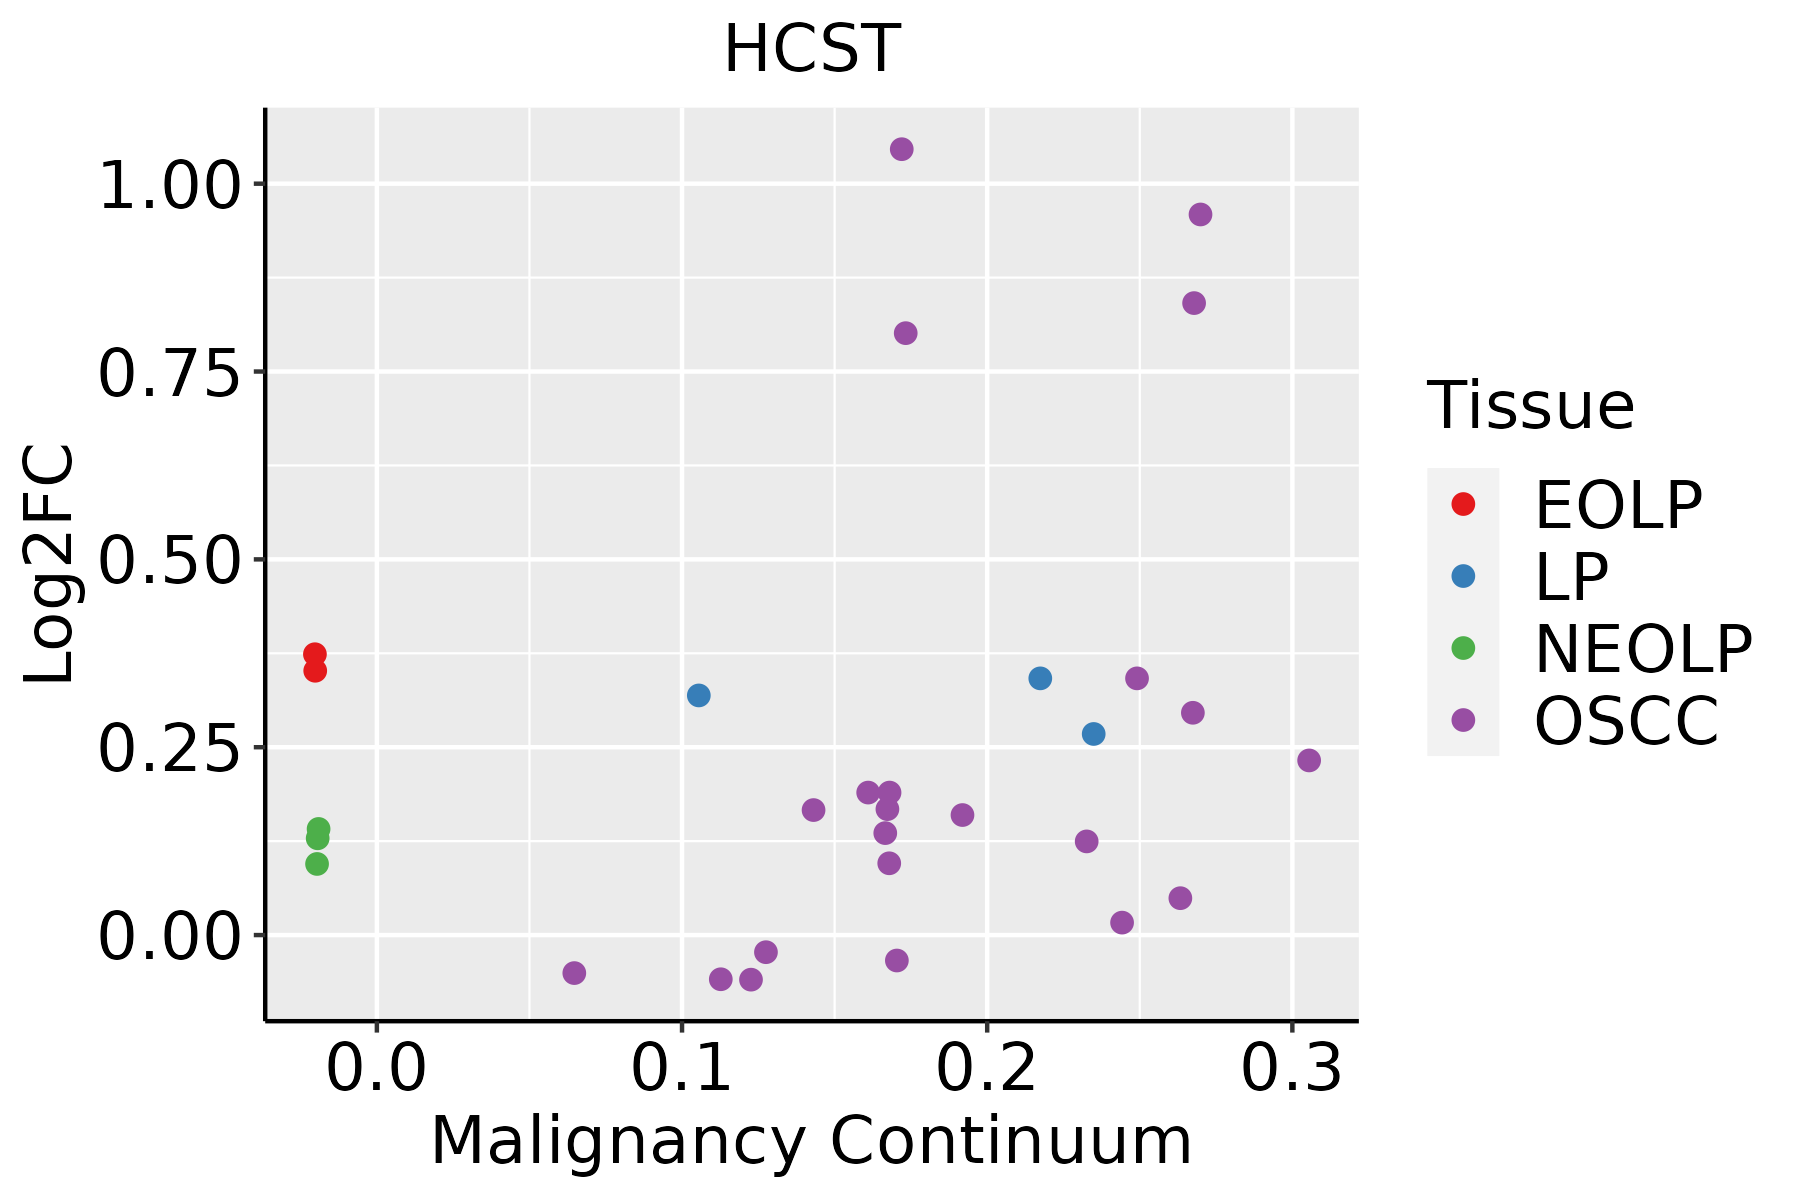 | EOLP: Erosive Oral lichen planus |
| LP: leukoplakia | ||
| NEOLP: Non-erosive oral lichen planus | ||
| OSCC: Oral squamous cell carcinoma |
| ∗log2FC in expression of this searched gene in stem-like cells from each diseased tissue sample relative to stem-like cells in normal samples in each tissue plotted against the malignancy continuum. Samples are colored based on if they are from different disease stage. |
Top |
Malignant transformation related pathway analysis |
| Find out the enriched GO biological processes and KEGG pathways involved in transition from healthy to precancer to cancer |
| Tissue | Disease Stage | Enriched GO biological Processes |
| Colorectum | AD |  |
| Colorectum | SER |  |
| Colorectum | MSS |  |
| Colorectum | MSI-H |  |
| Colorectum | FAP |  |
| ∗Top 15 enriched GO BP terms are showed in the bar plot of each disease state in each tissue. Each row represents a significant GO biological process which is colored according to the -log10(p.adjust). |
| Page: 1 2 3 4 5 6 7 8 9 |
| GO ID | Tissue | Disease Stage | Description | Gene Ratio | Bg Ratio | pvalue | p.adjust | Count |
| GO:0014065 | Cervix | CC | phosphatidylinositol 3-kinase signaling | 28/2311 | 144/18723 | 9.50e-03 | 4.72e-02 | 28 |
| Page: 1 |
| Pathway ID | Tissue | Disease Stage | Description | Gene Ratio | Bg Ratio | pvalue | p.adjust | qvalue | Count |
| hsa04650 | Oral cavity | EOLP | Natural killer cell mediated cytotoxicity | 38/1218 | 132/8465 | 1.26e-05 | 7.01e-05 | 4.13e-05 | 38 |
| hsa046501 | Oral cavity | EOLP | Natural killer cell mediated cytotoxicity | 38/1218 | 132/8465 | 1.26e-05 | 7.01e-05 | 4.13e-05 | 38 |
| Page: 1 |
Top |
Cell-cell communication analysis |
| Identification of potential cell-cell interactions between two cell types and their ligand-receptor pairs for different disease states |
| Ligand | Receptor | LRpair | Pathway | Tissue | Disease Stage |
| ULBP1 | KLRK1_HCST | ULBP1_KLRK1_HCST | NKG2D | Cervix | ADJ |
| Page: 1 |
Top |
Single-cell gene regulatory network inference analysis |
| Find out the significant the regulons (TFs) and the target genes of each regulon across cell types for different disease states |
| TF | Cell Type | Tissue | Disease Stage | Target Gene | RSS | Regulon Activity |
| ∗The dot plots of a searched regulon are shown for all cell subpopulations in each disease state of each tissue based on the regulon specific score inferred using pySCENIC and by calculating the average expression. |
| Page: 1 |
Top |
Somatic mutation of malignant transformation related genes |
| Annotation of somatic variants for genes involved in malignant transformation |
| Hugo Symbol | Variant Class | Variant Classification | dbSNP RS | HGVSc | HGVSp | HGVSp Short | SWISSPROT | BIOTYPE | SIFT | PolyPhen | Tumor Sample Barcode | Tissue | Histology | Sex | Age | Stage | Therapy Types | Drugs | Outcome |
| HCST | SNV | Missense_Mutation | novel | c.274A>G | p.Arg92Gly | p.R92G | Q9UBK5 | protein_coding | deleterious_low_confidence(0) | probably_damaging(0.969) | TCGA-A5-A0GG-01 | Endometrium | uterine corpus endometrioid carcinoma | Female | >=65 | I/II | Unknown | Unknown | SD |
| HCST | SNV | Missense_Mutation | c.101N>A | p.Gly34Asp | p.G34D | Q9UBK5 | protein_coding | tolerated_low_confidence(0.81) | benign(0.007) | TCGA-D1-A17Q-01 | Endometrium | uterine corpus endometrioid carcinoma | Female | <65 | I/II | Unknown | Unknown | SD | |
| HCST | SNV | Missense_Mutation | c.110N>A | p.Gly37Asp | p.G37D | Q9UBK5 | protein_coding | deleterious_low_confidence(0) | probably_damaging(0.958) | TCGA-44-7669-01 | Lung | lung adenocarcinoma | Male | <65 | I/II | Chemotherapy | alimta | PD | |
| HCST | SNV | Missense_Mutation | c.178G>A | p.Ala60Thr | p.A60T | Q9UBK5 | protein_coding | deleterious_low_confidence(0.02) | benign(0) | TCGA-HU-A4GN-01 | Stomach | stomach adenocarcinoma | Male | <65 | I/II | Chemotherapy | mitomycin | PD | |
| HCST | SNV | Missense_Mutation | rs759213775 | c.152N>T | p.Ala51Val | p.A51V | Q9UBK5 | protein_coding | tolerated_low_confidence(0.37) | benign(0.031) | TCGA-EL-A4K7-01 | Thyroid | thyroid carcinoma | Male | >=65 | III/IV | Unknown | Unknown | SD |
| Page: 1 |
Top |
Related drugs of malignant transformation related genes |
| Identification of chemicals and drugs interact with genes involved in malignant transfromation |
| (DGIdb 4.0) |
| Entrez ID | Symbol | Category | Interaction Types | Drug Claim Name | Drug Name | PMIDs |
| Page: 1 |

Copyright 2023-Present -The University of Texas Health Science Center at Houston |