
|
|||||
|
 | |
| |
| |
| |
| |
| |
|
Gene: HCFC1 |
Gene summary for HCFC1 |
| Gene information | Species | Human | Gene symbol | HCFC1 | Gene ID | 3054 |
| Gene name | host cell factor C1 | |
| Gene Alias | CFF | |
| Cytomap | Xq28 | |
| Gene Type | protein-coding | GO ID | GO:0000122 | UniProtAcc | P51610 |
Top |
Malignant transformation analysis |
| Identification of the aberrant gene expression in precancerous and cancerous lesions by comparing the gene expression of stem-like cells in diseased tissues with normal stem cells |
| Entrez ID | Symbol | Replicates | Species | Organ | Tissue | Adj P-value | Log2FC | Malignancy |
| 3054 | HCFC1 | HTA11_1938_2000001011 | Human | Colorectum | AD | 1.44e-04 | 3.18e-01 | -0.0811 |
| 3054 | HCFC1 | HTA11_347_2000001011 | Human | Colorectum | AD | 7.18e-03 | 2.27e-01 | -0.1954 |
| 3054 | HCFC1 | HTA11_696_2000001011 | Human | Colorectum | AD | 2.27e-04 | 2.49e-01 | -0.1464 |
| 3054 | HCFC1 | HTA11_1391_2000001011 | Human | Colorectum | AD | 1.31e-05 | 3.52e-01 | -0.059 |
| 3054 | HCFC1 | HTA11_866_3004761011 | Human | Colorectum | AD | 3.06e-10 | 3.52e-01 | 0.096 |
| 3054 | HCFC1 | HTA11_7696_3000711011 | Human | Colorectum | AD | 5.91e-08 | 3.10e-01 | 0.0674 |
| 3054 | HCFC1 | HTA11_99999970781_79442 | Human | Colorectum | MSS | 4.93e-10 | 4.01e-01 | 0.294 |
| 3054 | HCFC1 | HTA11_99999965104_69814 | Human | Colorectum | MSS | 3.92e-03 | 1.82e-01 | 0.281 |
| 3054 | HCFC1 | HTA11_99999971662_82457 | Human | Colorectum | MSS | 2.26e-22 | 5.75e-01 | 0.3859 |
| 3054 | HCFC1 | HTA11_99999973899_84307 | Human | Colorectum | MSS | 5.76e-06 | 5.32e-01 | 0.2585 |
| 3054 | HCFC1 | HTA11_99999974143_84620 | Human | Colorectum | MSS | 3.64e-05 | 2.66e-01 | 0.3005 |
| 3054 | HCFC1 | LZE2T | Human | Esophagus | ESCC | 5.27e-05 | 6.63e-01 | 0.082 |
| 3054 | HCFC1 | LZE4T | Human | Esophagus | ESCC | 6.91e-04 | 4.64e-02 | 0.0811 |
| 3054 | HCFC1 | LZE7T | Human | Esophagus | ESCC | 5.37e-11 | 6.87e-01 | 0.0667 |
| 3054 | HCFC1 | LZE8T | Human | Esophagus | ESCC | 1.03e-10 | 1.80e-01 | 0.067 |
| 3054 | HCFC1 | LZE20T | Human | Esophagus | ESCC | 1.57e-07 | 1.55e-01 | 0.0662 |
| 3054 | HCFC1 | LZE24T | Human | Esophagus | ESCC | 1.00e-14 | 3.64e-01 | 0.0596 |
| 3054 | HCFC1 | LZE6T | Human | Esophagus | ESCC | 2.20e-05 | 2.37e-01 | 0.0845 |
| 3054 | HCFC1 | P1T-E | Human | Esophagus | ESCC | 2.64e-15 | 5.95e-01 | 0.0875 |
| 3054 | HCFC1 | P2T-E | Human | Esophagus | ESCC | 3.94e-37 | 7.67e-01 | 0.1177 |
| Page: 1 2 3 4 5 6 7 |
| Tissue | Expression Dynamics | Abbreviation |
| Colorectum (GSE201348) |  | FAP: Familial adenomatous polyposis |
| CRC: Colorectal cancer | ||
| Colorectum (HTA11) |  | AD: Adenomas |
| SER: Sessile serrated lesions | ||
| MSI-H: Microsatellite-high colorectal cancer | ||
| MSS: Microsatellite stable colorectal cancer | ||
| Esophagus | 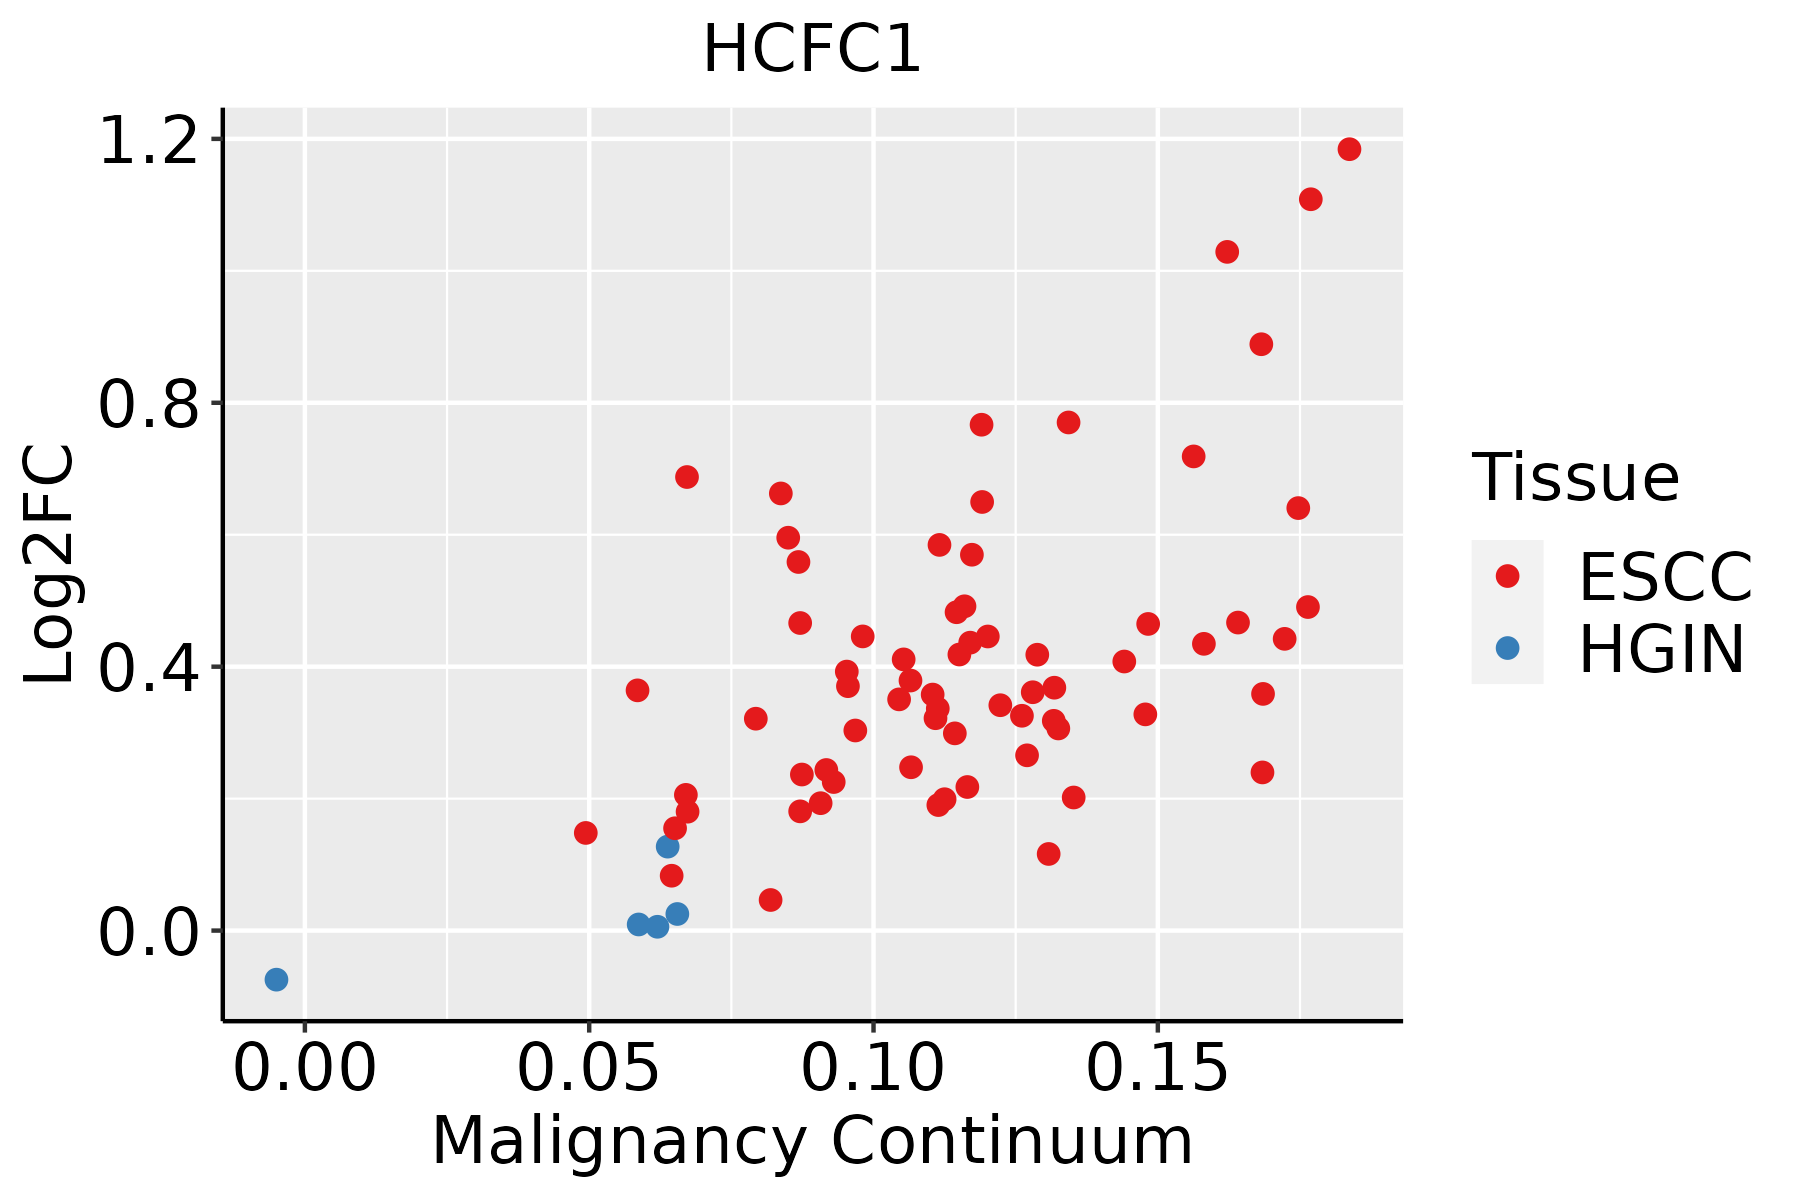 | ESCC: Esophageal squamous cell carcinoma |
| HGIN: High-grade intraepithelial neoplasias | ||
| LGIN: Low-grade intraepithelial neoplasias | ||
| Liver | 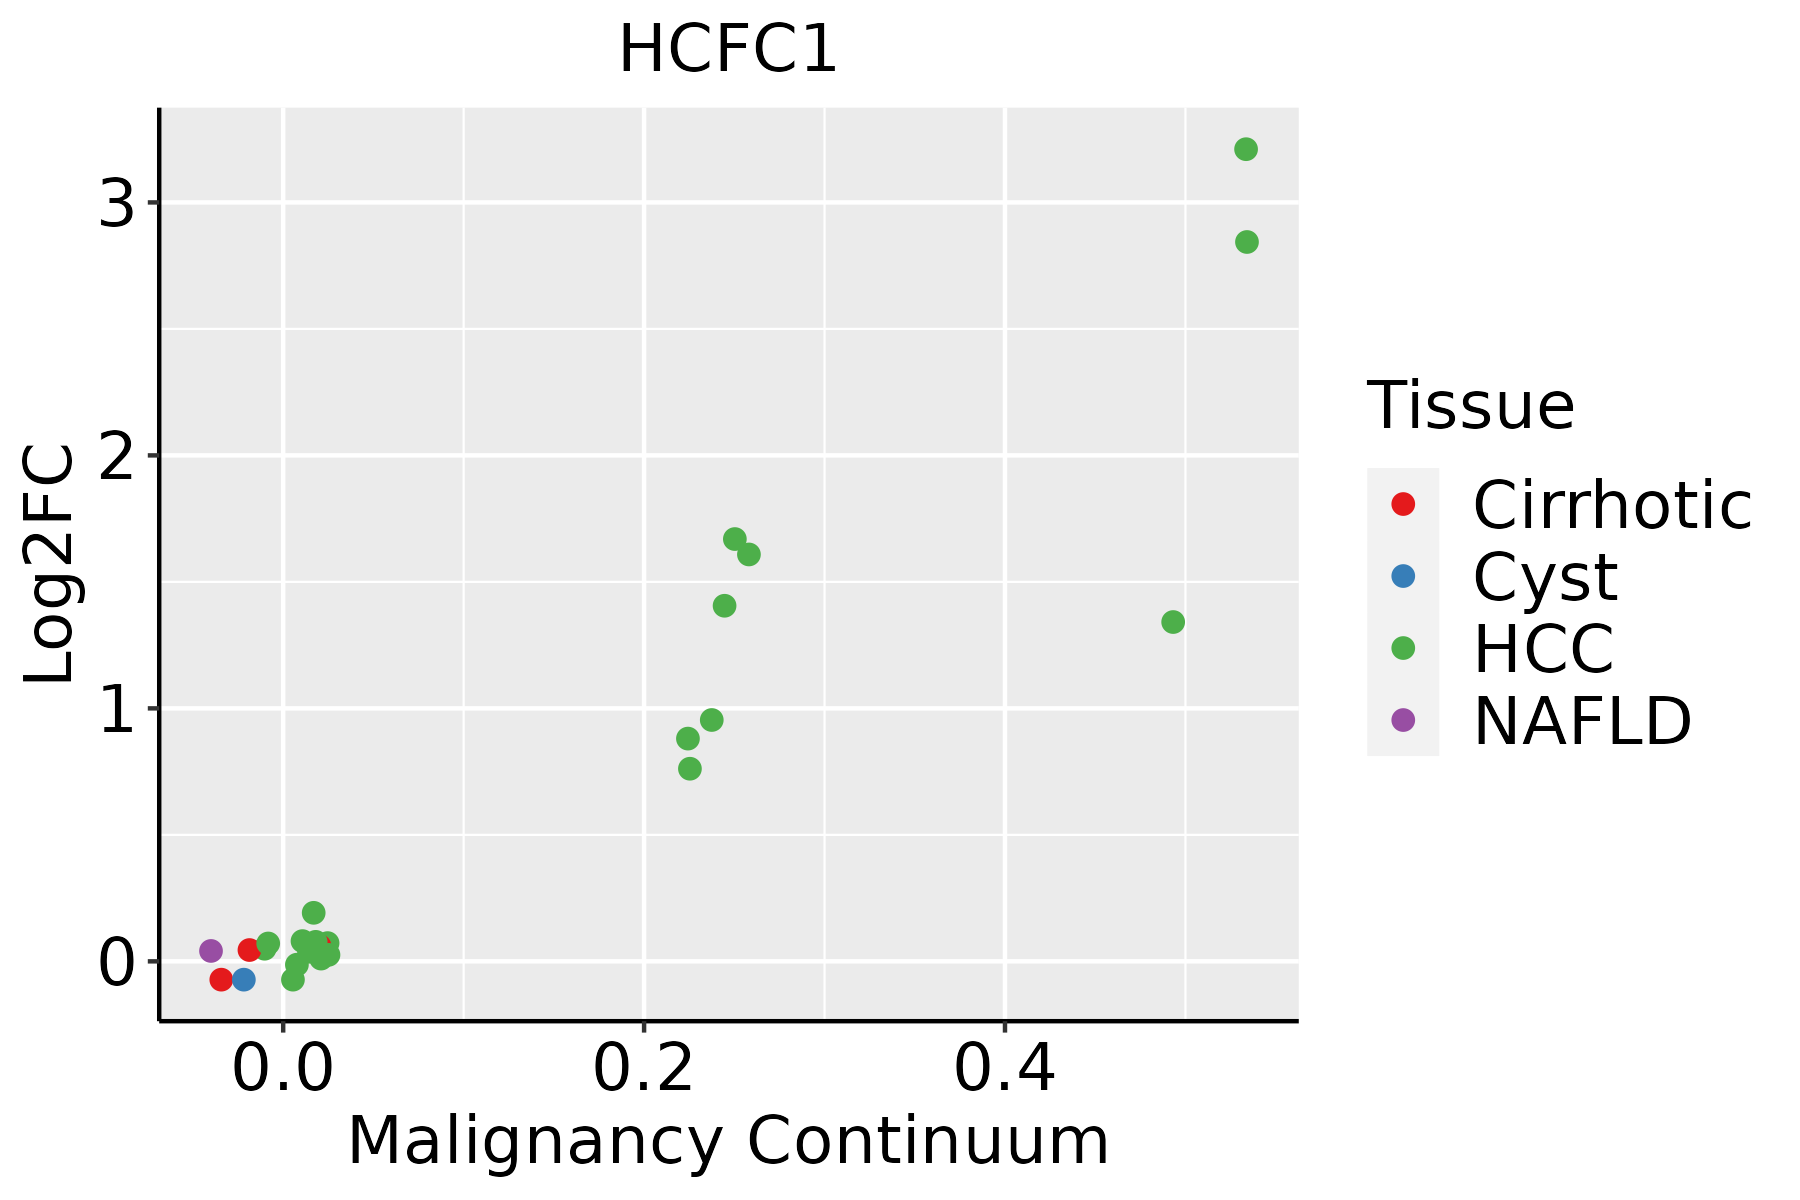 | HCC: Hepatocellular carcinoma |
| NAFLD: Non-alcoholic fatty liver disease | ||
| Oral Cavity | 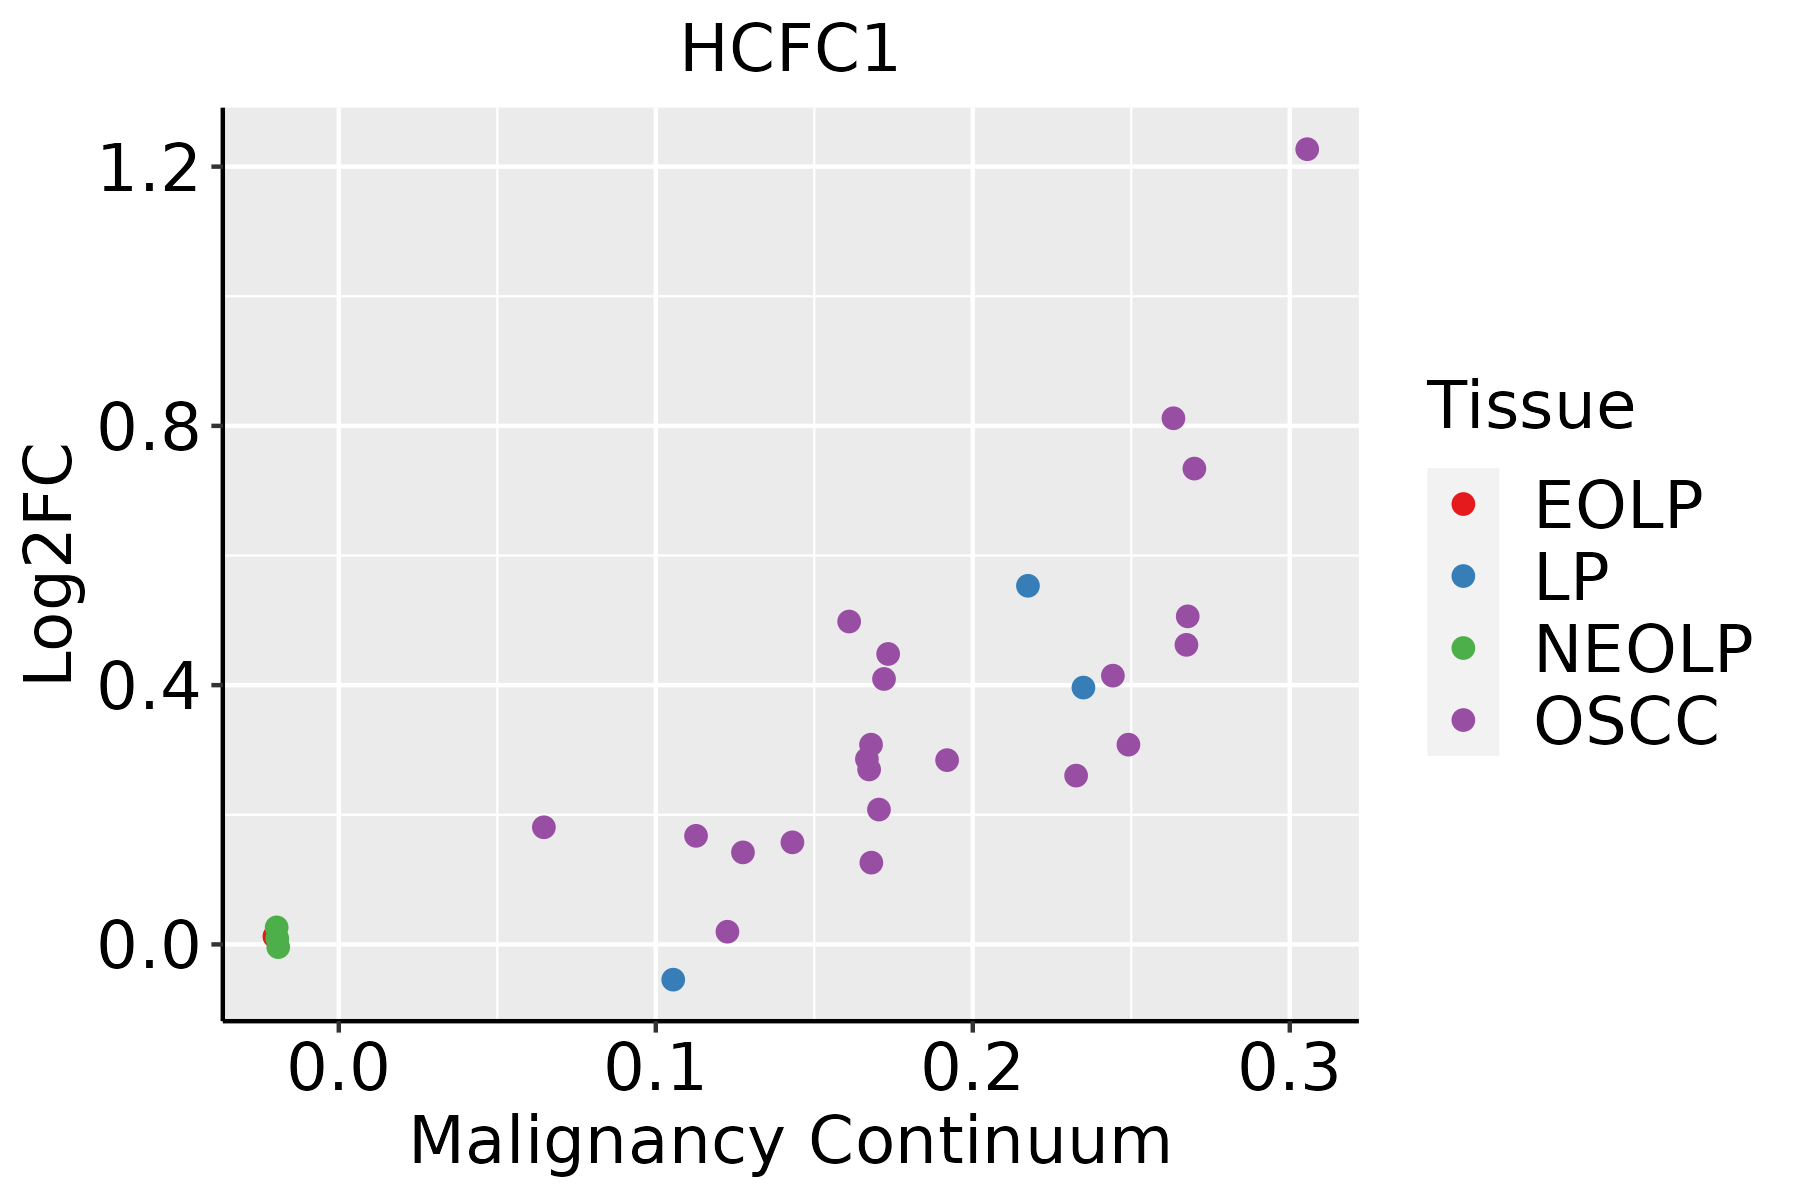 | EOLP: Erosive Oral lichen planus |
| LP: leukoplakia | ||
| NEOLP: Non-erosive oral lichen planus | ||
| OSCC: Oral squamous cell carcinoma | ||
| Skin | 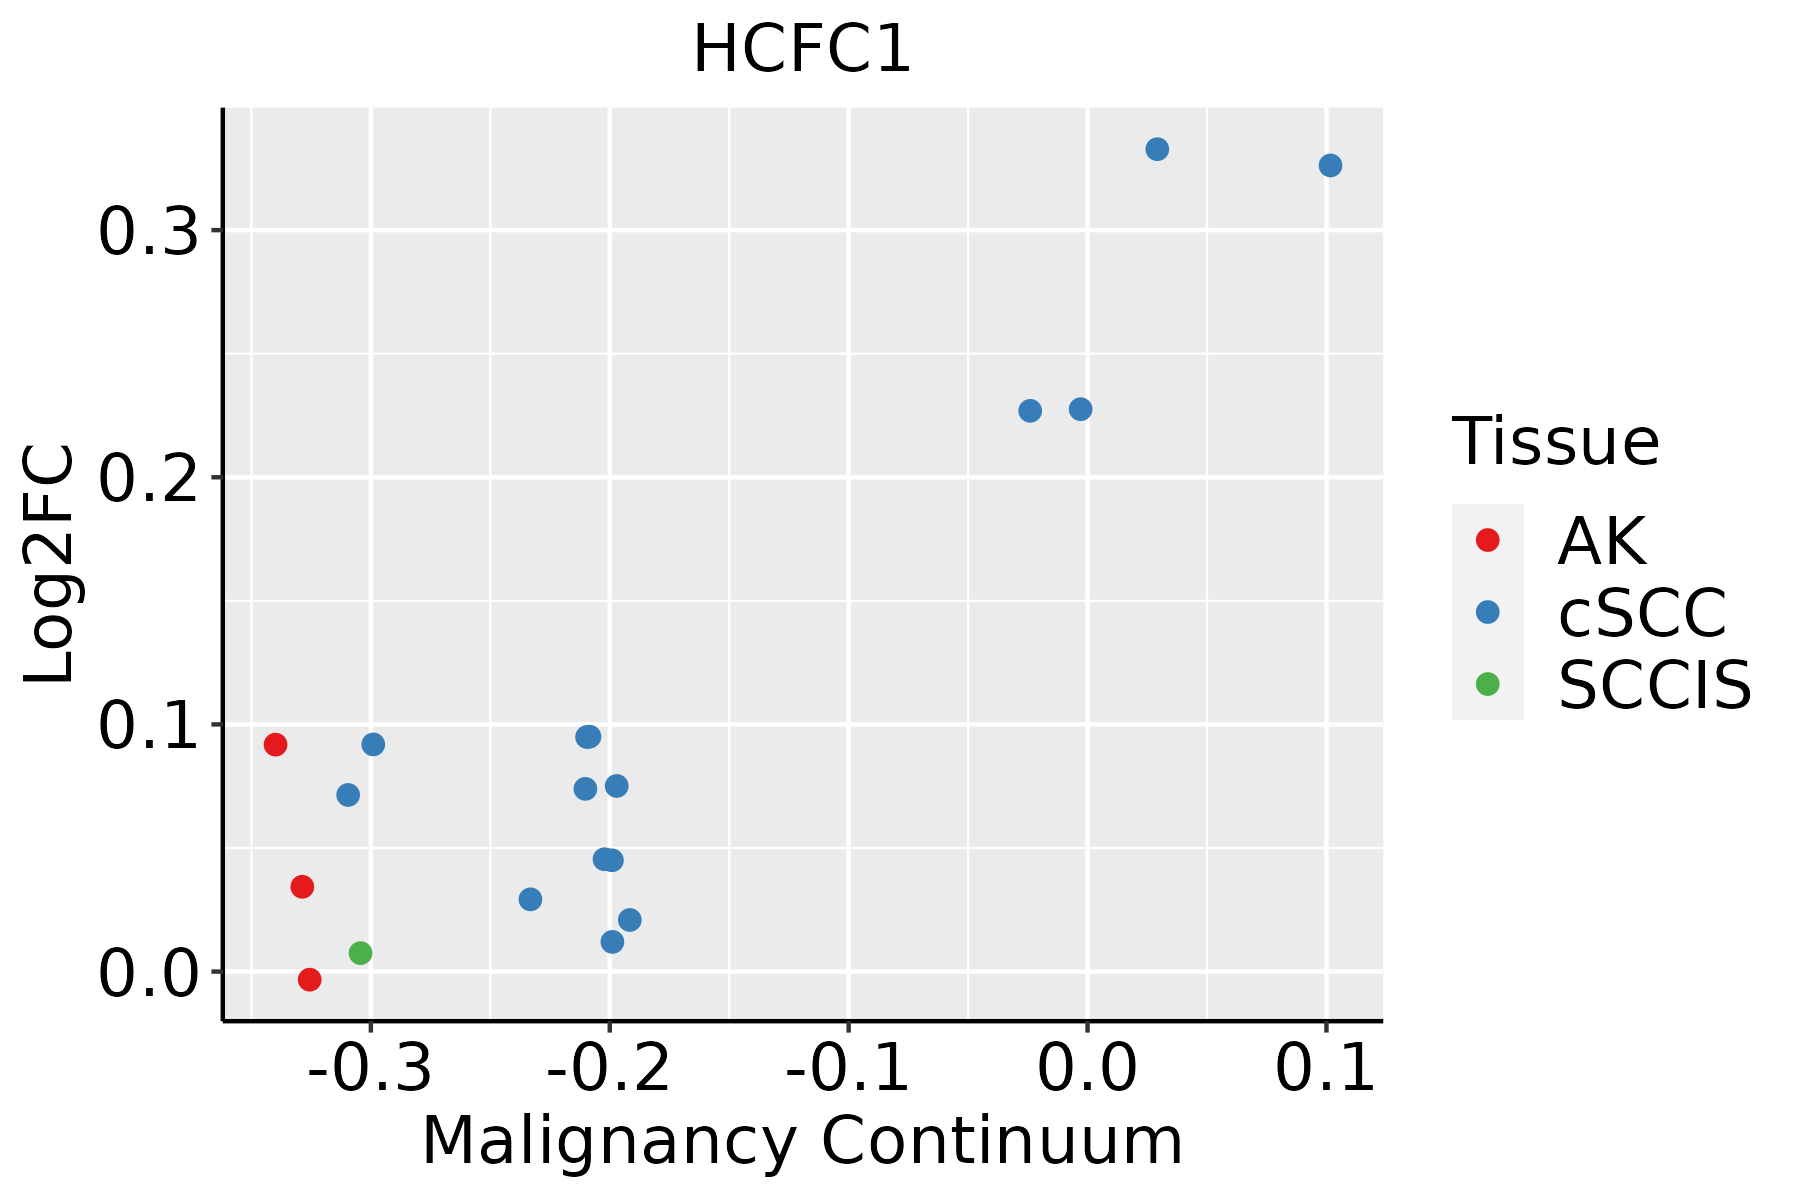 | AK: Actinic keratosis |
| cSCC: Cutaneous squamous cell carcinoma | ||
| SCCIS:squamous cell carcinoma in situ | ||
| Thyroid | 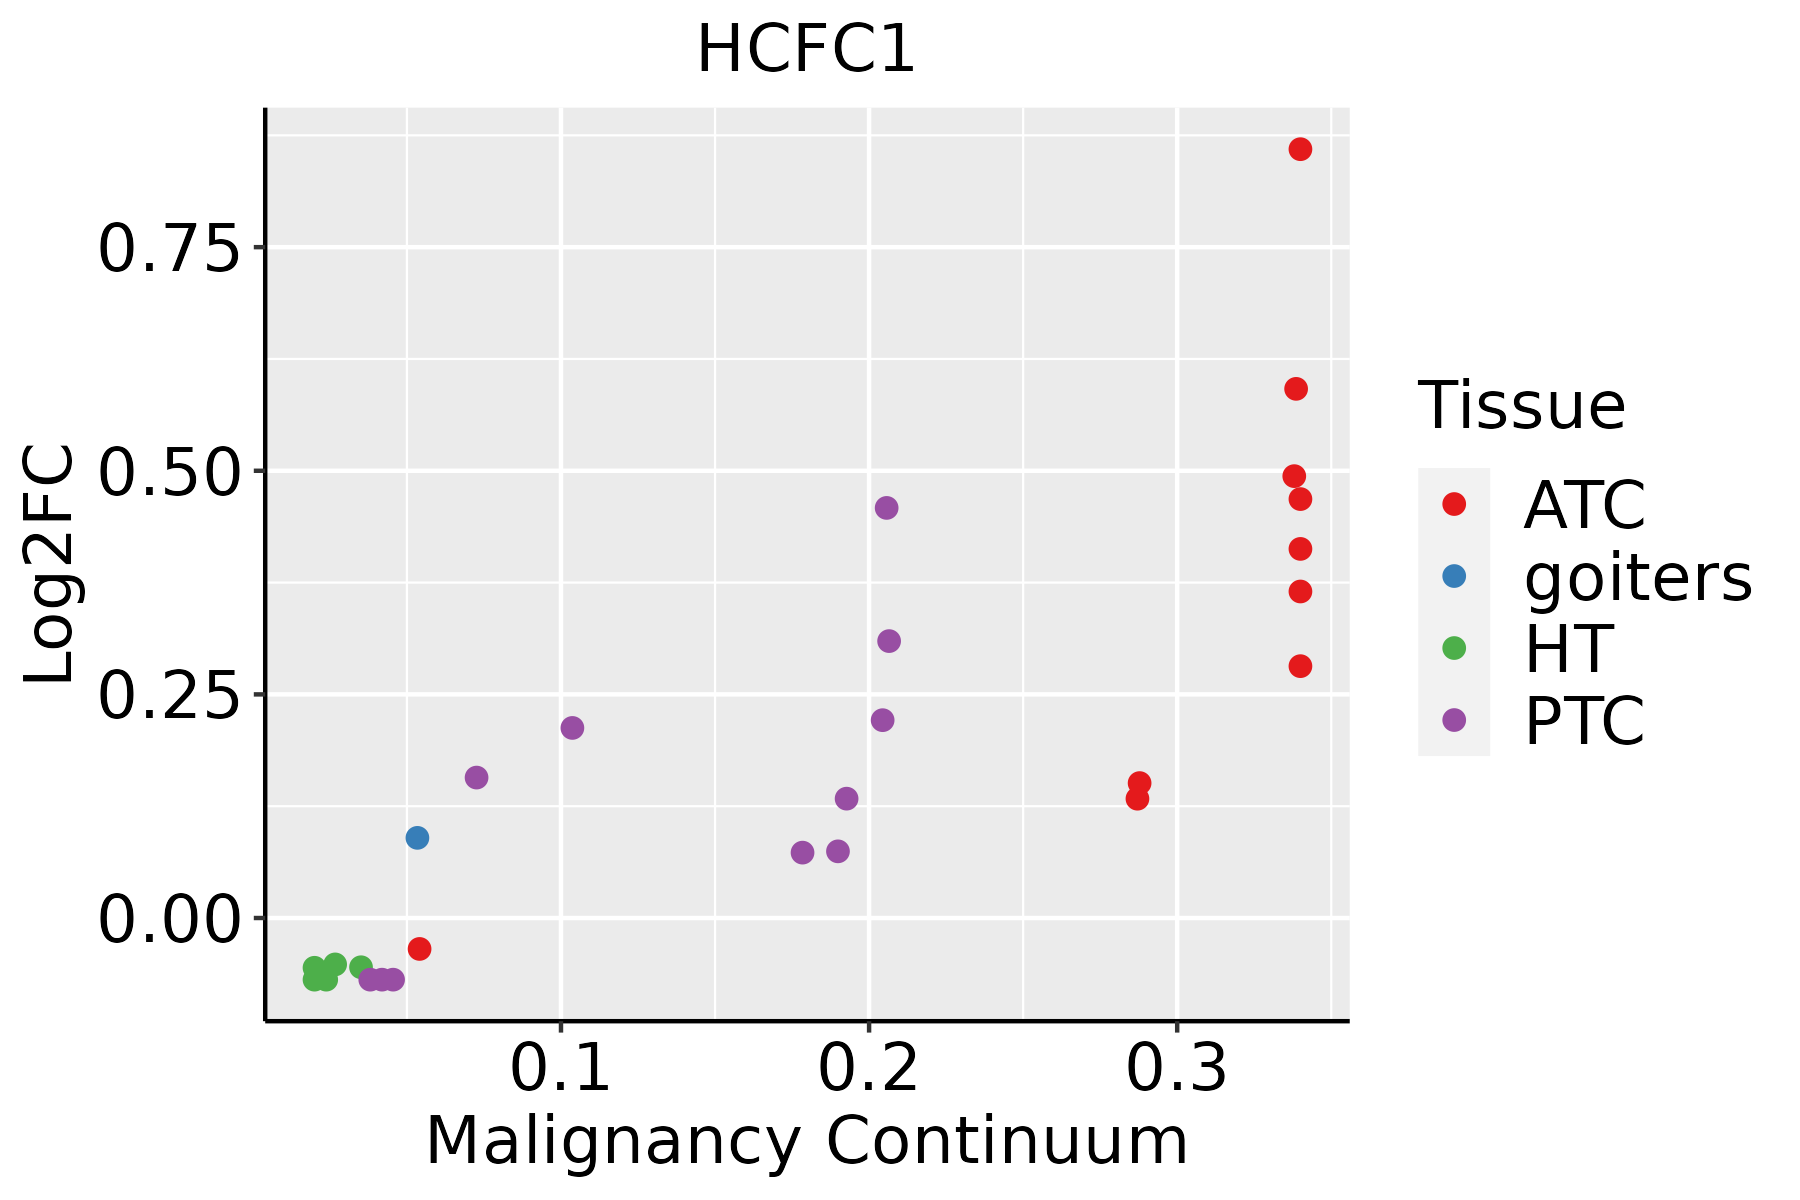 | ATC: Anaplastic thyroid cancer |
| HT: Hashimoto's thyroiditis | ||
| PTC: Papillary thyroid cancer |
| ∗log2FC in expression of this searched gene in stem-like cells from each diseased tissue sample relative to stem-like cells in normal samples in each tissue plotted against the malignancy continuum. Samples are colored based on if they are from different disease stage. |
Top |
Malignant transformation related pathway analysis |
| Find out the enriched GO biological processes and KEGG pathways involved in transition from healthy to precancer to cancer |
| Tissue | Disease Stage | Enriched GO biological Processes |
| Colorectum | AD |  |
| Colorectum | SER |  |
| Colorectum | MSS |  |
| Colorectum | MSI-H |  |
| Colorectum | FAP |  |
| ∗Top 15 enriched GO BP terms are showed in the bar plot of each disease state in each tissue. Each row represents a significant GO biological process which is colored according to the -log10(p.adjust). |
| Page: 1 2 3 4 5 6 7 8 9 |
| GO ID | Tissue | Disease Stage | Description | Gene Ratio | Bg Ratio | pvalue | p.adjust | Count |
| GO:0016032 | Colorectum | AD | viral process | 168/3918 | 415/18723 | 4.67e-20 | 3.66e-17 | 168 |
| GO:0043254 | Colorectum | AD | regulation of protein-containing complex assembly | 148/3918 | 428/18723 | 2.64e-11 | 3.18e-09 | 148 |
| GO:0031647 | Colorectum | AD | regulation of protein stability | 108/3918 | 298/18723 | 6.33e-10 | 5.08e-08 | 108 |
| GO:0050821 | Colorectum | AD | protein stabilization | 73/3918 | 191/18723 | 3.02e-08 | 1.64e-06 | 73 |
| GO:0006325 | Colorectum | AD | chromatin organization | 119/3918 | 409/18723 | 4.85e-05 | 8.33e-04 | 119 |
| GO:0045787 | Colorectum | AD | positive regulation of cell cycle | 85/3918 | 313/18723 | 4.76e-03 | 3.22e-02 | 85 |
| GO:0006338 | Colorectum | AD | chromatin remodeling | 70/3918 | 255/18723 | 7.44e-03 | 4.53e-02 | 70 |
| GO:00160322 | Colorectum | MSS | viral process | 157/3467 | 415/18723 | 7.94e-21 | 6.19e-18 | 157 |
| GO:00316472 | Colorectum | MSS | regulation of protein stability | 103/3467 | 298/18723 | 2.52e-11 | 3.49e-09 | 103 |
| GO:00432542 | Colorectum | MSS | regulation of protein-containing complex assembly | 130/3467 | 428/18723 | 1.38e-09 | 1.03e-07 | 130 |
| GO:00508212 | Colorectum | MSS | protein stabilization | 68/3467 | 191/18723 | 1.53e-08 | 8.81e-07 | 68 |
| GO:00063252 | Colorectum | MSS | chromatin organization | 107/3467 | 409/18723 | 7.22e-05 | 1.21e-03 | 107 |
| GO:0016570 | Colorectum | MSS | histone modification | 113/3467 | 463/18723 | 8.37e-04 | 8.68e-03 | 113 |
| GO:00457871 | Colorectum | MSS | positive regulation of cell cycle | 80/3467 | 313/18723 | 1.15e-03 | 1.12e-02 | 80 |
| GO:0016032111 | Esophagus | ESCC | viral process | 301/8552 | 415/18723 | 3.34e-29 | 1.32e-26 | 301 |
| GO:001657015 | Esophagus | ESCC | histone modification | 323/8552 | 463/18723 | 2.61e-26 | 7.88e-24 | 323 |
| GO:0031647111 | Esophagus | ESCC | regulation of protein stability | 223/8552 | 298/18723 | 5.76e-25 | 1.52e-22 | 223 |
| GO:001820514 | Esophagus | ESCC | peptidyl-lysine modification | 259/8552 | 376/18723 | 3.90e-20 | 5.26e-18 | 259 |
| GO:0043254111 | Esophagus | ESCC | regulation of protein-containing complex assembly | 278/8552 | 428/18723 | 3.81e-16 | 2.77e-14 | 278 |
| GO:0050821111 | Esophagus | ESCC | protein stabilization | 140/8552 | 191/18723 | 6.50e-15 | 3.61e-13 | 140 |
| Page: 1 2 3 4 5 6 7 |
| Pathway ID | Tissue | Disease Stage | Description | Gene Ratio | Bg Ratio | pvalue | p.adjust | qvalue | Count |
| Page: 1 |
Top |
Cell-cell communication analysis |
| Identification of potential cell-cell interactions between two cell types and their ligand-receptor pairs for different disease states |
| Ligand | Receptor | LRpair | Pathway | Tissue | Disease Stage |
| Page: 1 |
Top |
Single-cell gene regulatory network inference analysis |
| Find out the significant the regulons (TFs) and the target genes of each regulon across cell types for different disease states |
| TF | Cell Type | Tissue | Disease Stage | Target Gene | RSS | Regulon Activity |
| HCFC1 | TH17 | Oral cavity | EOLP | COCH,NRDE2,CCDC58, etc. | 1.33e-01 |  |
| HCFC1 | STM | Thyroid | Healthy | TRIM33,UBAP2L,SF3A3, etc. | 5.30e-01 |  |
| ∗The dot plots of a searched regulon are shown for all cell subpopulations in each disease state of each tissue based on the regulon specific score inferred using pySCENIC and by calculating the average expression. |
| Page: 1 |
Top |
Somatic mutation of malignant transformation related genes |
| Annotation of somatic variants for genes involved in malignant transformation |
| Hugo Symbol | Variant Class | Variant Classification | dbSNP RS | HGVSc | HGVSp | HGVSp Short | SWISSPROT | BIOTYPE | SIFT | PolyPhen | Tumor Sample Barcode | Tissue | Histology | Sex | Age | Stage | Therapy Types | Drugs | Outcome |
| HCFC1 | SNV | Missense_Mutation | c.1570N>T | p.Arg524Trp | p.R524W | P51610 | protein_coding | deleterious(0) | probably_damaging(0.975) | TCGA-A8-A08Z-01 | Breast | breast invasive carcinoma | Female | >=65 | III/IV | Unknown | Unknown | SD | |
| HCFC1 | SNV | Missense_Mutation | novel | c.4885N>A | p.Glu1629Lys | p.E1629K | P51610 | protein_coding | deleterious_low_confidence(0) | probably_damaging(0.971) | TCGA-AC-A3BB-01 | Breast | breast invasive carcinoma | Female | <65 | III/IV | Chemotherapy | cytoxan | CR |
| HCFC1 | SNV | Missense_Mutation | c.3083N>A | p.Thr1028Lys | p.T1028K | P51610 | protein_coding | deleterious_low_confidence(0) | probably_damaging(0.982) | TCGA-AO-A03P-01 | Breast | breast invasive carcinoma | Female | <65 | I/II | Hormone Therapy | letrozole | PD | |
| HCFC1 | SNV | Missense_Mutation | c.157G>A | p.Glu53Lys | p.E53K | P51610 | protein_coding | deleterious(0.02) | probably_damaging(0.983) | TCGA-AR-A0TZ-01 | Breast | breast invasive carcinoma | Female | <65 | III/IV | Unspecific | Doxorubicin | PD | |
| HCFC1 | SNV | Missense_Mutation | c.4481N>T | p.Pro1494Leu | p.P1494L | P51610 | protein_coding | deleterious_low_confidence(0) | possibly_damaging(0.715) | TCGA-AR-A1AN-01 | Breast | breast invasive carcinoma | Female | <65 | I/II | Chemotherapy | cytoxan | SD | |
| HCFC1 | SNV | Missense_Mutation | c.1214N>A | p.Thr405Lys | p.T405K | P51610 | protein_coding | deleterious(0.03) | probably_damaging(0.972) | TCGA-AR-A256-01 | Breast | breast invasive carcinoma | Female | <65 | I/II | Chemotherapy | doxorubicin | PD | |
| HCFC1 | SNV | Missense_Mutation | c.2908N>C | p.Glu970Gln | p.E970Q | P51610 | protein_coding | tolerated_low_confidence(0.05) | benign(0.042) | TCGA-BH-A0H5-01 | Breast | breast invasive carcinoma | Female | <65 | I/II | Chemotherapy | cytoxan | CR | |
| HCFC1 | SNV | Missense_Mutation | c.2152N>A | p.Ala718Thr | p.A718T | P51610 | protein_coding | deleterious(0.03) | possibly_damaging(0.616) | TCGA-BH-A18G-01 | Breast | breast invasive carcinoma | Female | >=65 | I/II | Unknown | Unknown | SD | |
| HCFC1 | SNV | Missense_Mutation | novel | c.5344N>T | p.Thr1782Ser | p.T1782S | P51610 | protein_coding | tolerated_low_confidence(0.1) | benign(0.04) | TCGA-BH-A8FZ-01 | Breast | breast invasive carcinoma | Female | <65 | I/II | Unknown | Unknown | SD |
| HCFC1 | SNV | Missense_Mutation | novel | c.3502N>C | p.Thr1168Pro | p.T1168P | P51610 | protein_coding | deleterious_low_confidence(0) | benign(0.425) | TCGA-C8-A12X-01 | Breast | breast invasive carcinoma | Female | <65 | I/II | Unknown | Unknown | SD |
| Page: 1 2 3 4 5 6 7 8 9 10 11 12 13 14 15 16 17 18 19 20 21 |
Top |
Related drugs of malignant transformation related genes |
| Identification of chemicals and drugs interact with genes involved in malignant transfromation |
| (DGIdb 4.0) |
| Entrez ID | Symbol | Category | Interaction Types | Drug Claim Name | Drug Name | PMIDs |
| Page: 1 |

Copyright 2023-Present -The University of Texas Health Science Center at Houston |